Study design
This study was a retrospective, observational study using publicly available secondary data. To account for the potential impact of the Covid-19 pandemic on OCS prescription rates, data were extracted for the year April 2019 to March 2020, alongside the 2019 index of multiple deprivation (IMD) scores. The study population was GP practices in England. GP practices were excluded from the analysis if data were not available. Regression analysis was used to explore the relationship between patients receiving an OCS prescription for asthma or COPD and deprivation at a GP practice level.
Data sources
Data were obtained from the NHS Business Services Authority (NHSBSA) respiratory dashboard, Quality and Outcomes Framework (QOF), Fingertips Public Health Database (PHD), and NHS Digital24,27,28,29.
The NHSBSA respiratory dashboard aims to allow healthcare providers to monitor and improve prescribing for respiratory care24. The dashboard focuses on asthma and COPD and includes seven comparator measures. While individual patient data are used to derive the measures, personally identifiable data are not included. Hence, measures are available at the GP practice level and aggregated to the Clinical commissioning Group (CCG) level. In addition, the data does not identify whether the OCS prescription is for asthma or COPD and therefore the data cannot be separated to consider the OCS prescriptions for individual diseases. Prescribing data includes all items prescribed in primary care but does not include hospital prescribing.
Fingertips PHD is a large collection of public health datasets sourced from government and NHS agencies (e.g. the Office for National Statistics and NHS Digital)27. Fingertips PHD was developed to support healthcare professionals and local authorities in providing effective and appropriate healthcare and to reduce health inequalities in their area.
NHS Digital collects patient data to support researchers and the NHS to understand diseases and improve healthcare services28. Each month, NHS Digital provides patient demographic data at the GP practice level including the number of patients registered at a GP practice stratified by age and gender.
The QOF is a programme that aims to support a high quality of care by rewarding good practices and setting targets for GP practices to achieve29. Practice achievements are measured by practices providing the QOF with data on several outcome indicators, including public health factors. The QOF only collects data from GP practices that participate in the voluntary scheme.
All data from all sources were obtained at the GP practice level and linked by a unique area code.
Outcome and exposure variables
The primary outcome variable was the proportion of patients receiving a prednisolone prescription. This was calculated as the number of unique patients receiving a prednisolone prescription (of any dosage) while also receiving medication to treat asthma or COPD divided by the total number of patients for each practice. Prescription data were obtained from the NHSBSA respiratory dashboard.
The exposure variable was social deprivation. IMD score was used as a proxy for social deprivation. IMD scores are calculated for small areas in England called Lower-layer Super Output Areas (LSOAs) and are based on seven domains: income; employment; education; skills and training; health and disability; crime; barriers to housing services and living environment30. Scores at the GP practice level are estimated using a population weighting method, with higher scores representing more deprived areas. The 2019 IMD scores at the GP practice level were obtained from Fingertips PHD.
Confounding variables
A confounding variable is a variable that influences both the outcome and exposure variable. For example, people who live in areas with higher levels of deprivation may have a higher prevalence of obesity, which may increase patient risk of developing asthma and therefore result in increased management of respiratory diseases using OCS. Confounding variables that may generate bias in the analysis were identified by interviewing three respiratory clinicians via web-based conferencing. All confounder variables were reviewed to identify which could feasibly be included in the analysis. Confounding variables included in the analysis were age, sex, treatment adherence, and prevalence of asthma, COPD, rheumatoid arthritis, mental health conditions, obesity, and smoking. Examples of potential confounding variables identified by clinicians that could not be included in the analysis were accident and emergency (A&E) attendance rates, housing density, access to health care, patient understanding of asthma, quality of the indoor living environment, ethnicity, prevalence of depression, prevalence of osteoporosis, and areas with high pollution. The exclusion criteria for variables were a) data were not publicly available b) variables could not feasibly be matched (for example, age-restricted data of 50 + ), and c) data could not be linked to GP practice data. A summary table of excluded variables are presented in Supplementary Table 1.
Mean age was estimated based on grouped data. The number of patients in each age category was multiplied by the midpoint of the age category. These values were summed and divided by the total number of patients to provide an estimated mean age for each GP practice. The proportion of males was derived as the total number of males divided by the total number of patients for each GP practice. Demographic variables were sourced from NHS Digital based on data from March 2020.
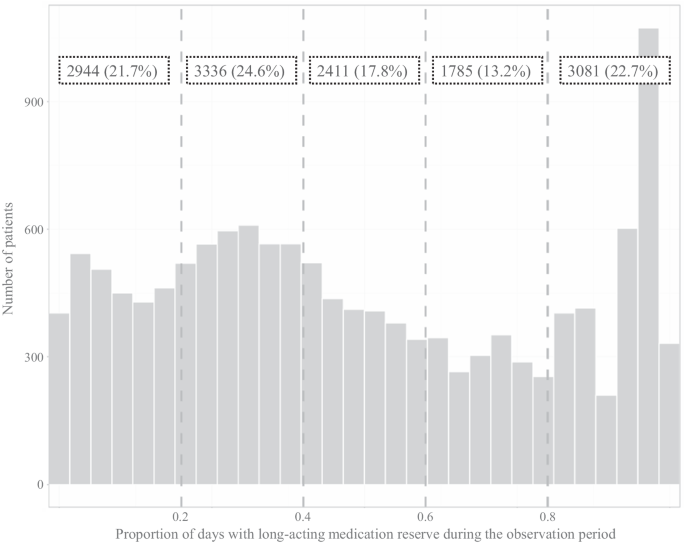
The proportion of patients prescribed five or fewer steroid inhalers, including inhaled corticosteroids (ICS) and long-acting beta-agonists (LABA) products, was used as a proxy for treatment adherence. This metric was obtained directly from the NHSBSA respiratory dashboard. The NHSBSA specifies that people who collect five or fewer prescriptions may benefit from a medication review and, therefore, may not be adhering to treatment24. The proportion of patients was calculated as the number of patients who have collected five or fewer prescriptions divided by the total number of patients receiving any prescriptions for asthma or COPD.
Prevalence data were obtained for asthma, COPD, rheumatoid arthritis, mental health, obesity, and smoking by GP practice. These variables were obtained from the QOF database, apart from smoking prevalence which was extracted from Fingertips PHD. Smoking prevalence is sourced from the GP patient survey (GPPS), an annual survey sent to patients in the UK to collect data on patient opinions of their GP practice as well as patient information such as smoking status. Smoking prevalence is the proportion of people who responded ‘occasional smoker’ or ‘regular smoker’ in the 2020 GPPS. Prevalence of mental health conditions is the proportion of patients registered at a GP practice with schizophrenia, bipolar affective disorder, or other psychoses as well as any patients receiving lithium treatments29. At source, some prevalence variables were age restricted: obesity prevalence was based on patients aged 18 and over; rheumatoid arthritis prevalence was based on people aged 16 and over; asthma prevalence was based on people aged six and over; and smoking prevalence was based on people aged 15 and over.
Statistical analysis
Data were analysed using descriptive statistics and continuous variables were summarised as mean and standard deviation. Multivariate beta regression was used to evaluate the association between prescription rates of prednisolone for patients with asthma or COPD and social deprivation after adjusting for confounders including age, sex, and treatment adherence in addition to the prevalence of rheumatoid arthritis, asthma, COPD, mental health conditions, obesity, and smoking. The assumptions of the beta regression were assessed using diagnostic plots such as Cook’s distance plot (see supplementary material for further details).
As part of the statistical model validation checks, outliers were identified based on Cook’s distance and the size of the standardised residuals. An observation was considered an outlier if it had a Cook’s distance greater than 4/n, where n is the number of observations31. Additionally, an observation with a standardised residual that was larger than 3 (in absolute value) was also considered an outlier31.
Due to the non-linear nature of the statistical model, the regression coefficients cannot be directly translated into absolute percentage changes in prescription levels. Therefore, to generate an approximate impact on prescriptions, the regression outputs were used to predict the average level of prescription whilst keeping all variables held constant at their mean value. Each variable was then set to 0 and 100 (or 0 and 1 depending on their scale) and the difference between the highest and lowest value divided by 100. This produces a simplified linear prediction on how a 1-unit change in the variable impacts the absolute proportion of patients in a GP practice who receive the prescription.
Furthermore, in order to generate 95% confidence intervals (CIs) for the regression predictions a bootstrapping approach was taken. This involves re-running the statistical model on a subset of the data 10,000 times to calculate the level of uncertainty present within the model predictions.
Log odds, standard error, and P-values were presented from the multivariable beta regression models. P-values < 0.05 were considered statistically significant. All analyses were conducted using R version 4.2.132.
Sensitivity analysis
Variables that applied an age restriction were considered ‘adult’ variables (i.e. age restricted data of 15 + ). ‘Adult’ variables included prevalence of obesity, rheumatoid arthritis, and smoking. Sensitivity analysis was conducted to explore the impact of age-restricted variables on the results of the analysis by running two additional models. Firstly, using the same data used in the base case model, a model was run that excluded ‘adult’ variables. Following this, an ‘adult’ only dataset was created by excluding patients based on age. Since age categories were defined differently across data sources, the same age limits could not be applied to all variables. For prescription data, age categories “0 to 5”, “6 to 11”, and “12 to 15” were excluded from the analysis. For patient demographic data, age categories “0 to 4”, “5 to 9”, and “10 to 14” were excluded from the analysis. A final model was run that included all confounding variables using the ‘adult’ only dataset. Therefore, variables in the third model only included people aged 15 plus to create an ‘adult’ only population. For the ‘adult’ only dataset, observations defined as outliers were also excluded from the analysis.
Reporting summary
Further information on research design is available in the Nature Research Reporting Summary linked to this article.


留言 (0)