
記住我


The study was carried out in the Amhara region, North Mecha district, which is 34 km southwest of Bahir Dar, the hub of the Amhara National Regional State, and 530 km northwest of Ethiopia’s capital, Addis Ababa. The district’s expected population in 2021 was 317,885, with 157,353 men and 160,532 women, according to the results of the 2007 national census [25]. The district comprises three climatic zones: highland “Dega”, mid-altitude “Weyna Dega” and lowlands “Kola”. The mean annual rainfall ranges from 1,000 mm to 2,000 mm. The district has 156,027 hectares of area, of which 72,178 hectares were used for cultivation and about 1,386 hectares were covered by water bodies. There are 37 rural Kebeles among these 10 Kebeles irrigated users, and the remaining are non-irrigated users. Maize and millet are mainly planted during the main rainy season, while wheat, maize, and vegetables are grown under irrigated conditions [26, 27].
Study design and periodA Community-based comparative cross-sectional study design was employed to assess minimum acceptable diet practice and its associated factors among children aged 6–59 months from irrigated and non-irrigated households in Mecha district. The study was conducted from September to October, 2021.
PopulationAll children aged 6–23 months in both irrigation and non-irrigated users in the district were the source population for the study. All children aged 6–59 months in the randomly selected kebele (for both irrigation and non-irrigated) were the study population. Mother/care takers were interviewed for the study.
Eligibility criteriaAll children aged 6–23 months who had been leaving at least for 6 months in the selected irrigated and non-irrigated user kebeles were included in the study.
Study variablesMinimum acceptable diet practice, which is a combination of minimum meal frequency and minimum dietary diversity for breastfeeding and non-breastfeeding children, is the outcome (dependent variable) variable for the study. Whereas, socio-demographic and economic, maternal, and child related factors were included in the study.
Sample size determinationAs it was a comparative cross-sectional study, the minimum sample size was determined by using the double population proportion formula [n (in each group) = f (α, β) (p1q1 + p2q2) / (p1 - p2) ²], with the following assumptions that the two groups were considered based on their irrigation status. Group one was without irrigation as not exposed (non-user HHs), and group two was with irrigation as exposed (user HH). To estimate the minimum sample size of the study, 35.5% of households with non-irrigated users attain minimum acceptable diet practice among mothers having children aged 6–23 months in Mereka district, Southern Ethiopia [28], and households practice from irrigation users not known, so 50% (P =.5) were taken. Then, the sample size estimation was calculated using Epi Info software, and with a 95% confidence level and an 80% power yielded 392, multiplied by a design effect of 2, and then adding a 5% non-response rate, the final required sample size was 824.
Sampling procedureA stratified sampling technique was used to select the study population. In the first stage, rural kebeles were stratified by irrigation land use as irrigated and non-irrigated users. In the next stage, a total of twelve kebeles (three from irrigated and nine from non-irrigated kebeles) were selected randomly using the lottery method. After allocating a sample size to each kebele of the HHs with irrigated and non-irrigated users, the required sample size was selected using a systematic sampling technique (Fig. 1). A single child was selected by the lottery method from the households in which two or more 6- to 23-month-old months children were found.
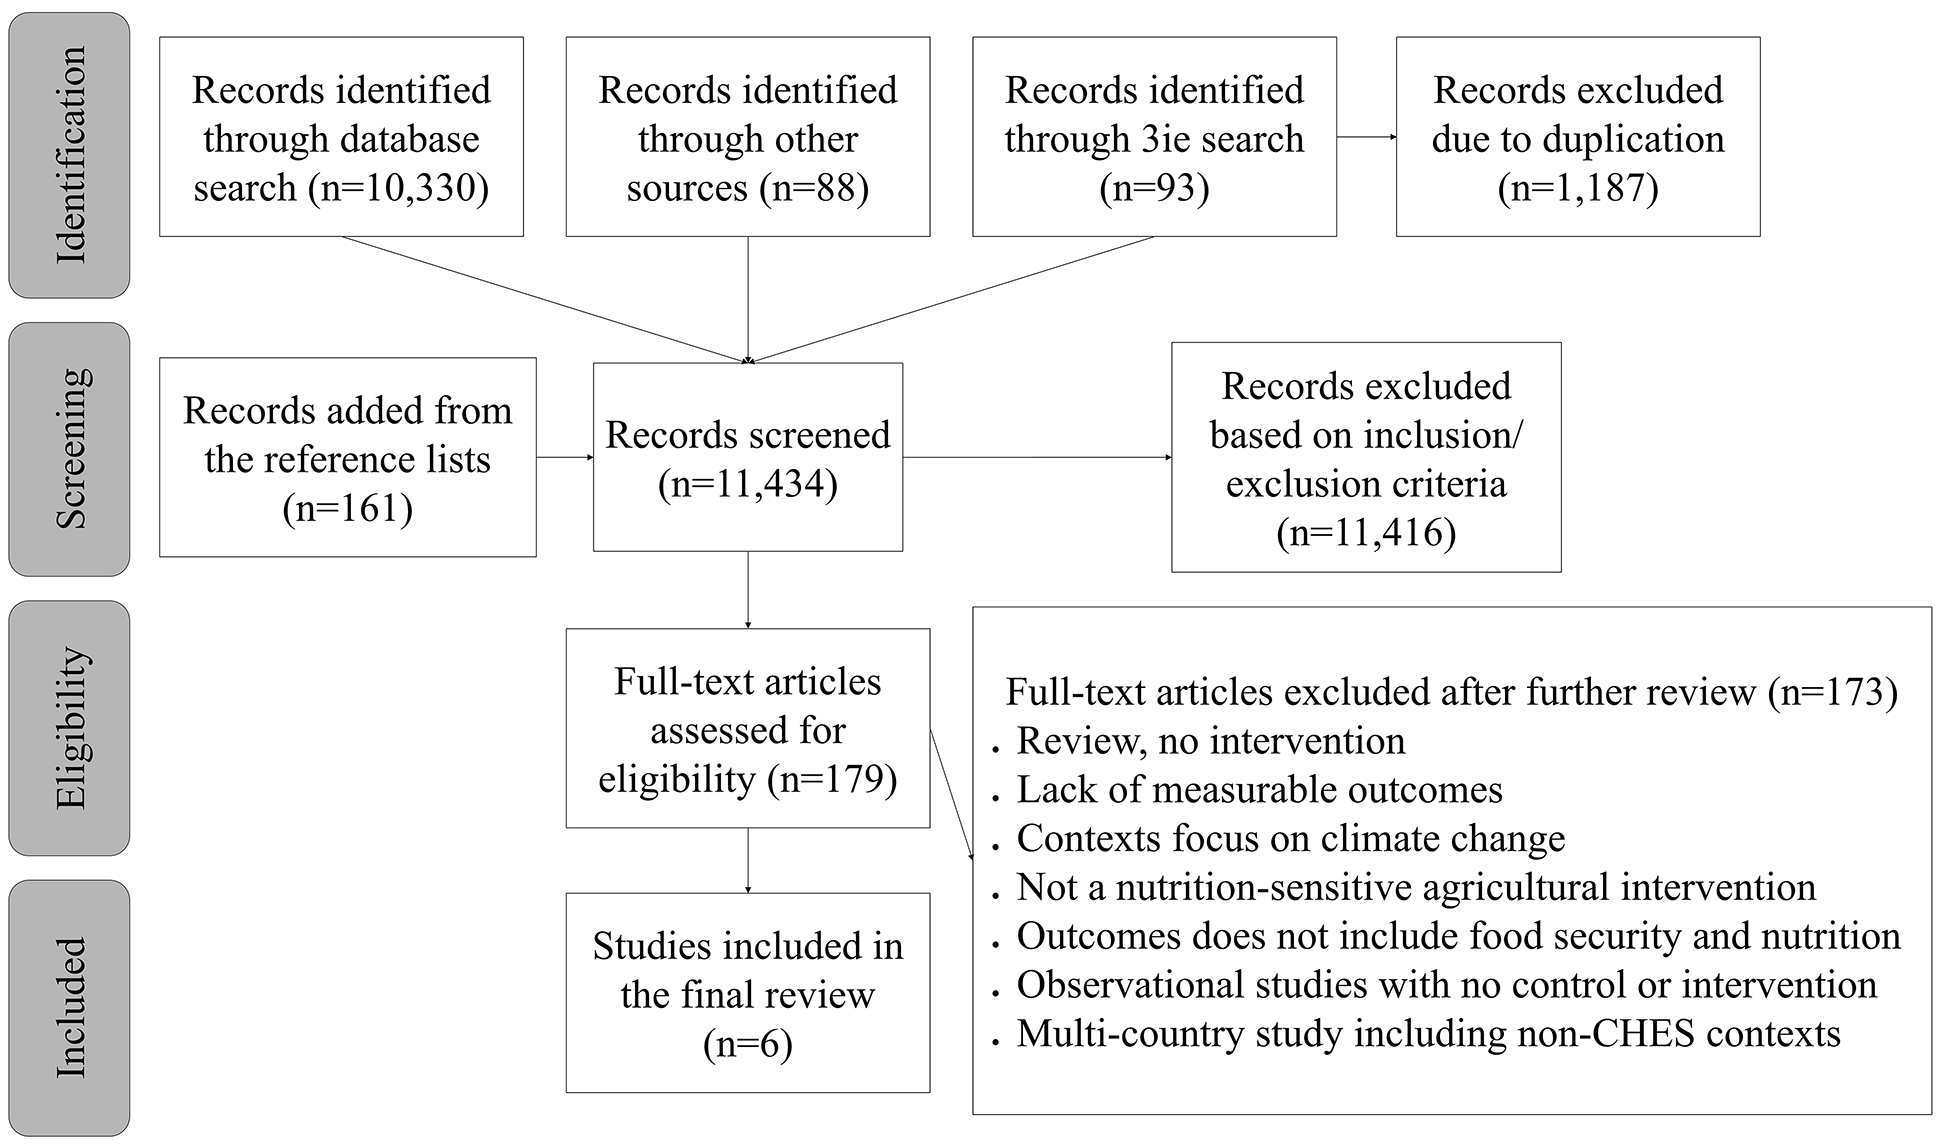
Fig. 1
Sampling procedure to study minimum acceptable diet and associated factors among infant and young children aged 6–23 months in irrigated and non-irrigated areas of north Mecha district, northwest Ethiopia, 2021
Operational definition of termsMinimum acceptable dietThe percentage of breastfed children 6–23 months of age who had at least the minimum dietary diversity and the minimum meal frequency during the previous day and non-breastfed children 6–23 months of age who received at least two milk feedings and had at least the minimum dietary diversity, not including milk feeds, and the minimum meal frequency during the previous day [4, 29].
Minimum dietary diversityPercentage of children 6–23 months of age who consumed foods and beverages from at least five out of eight defined food groups during the previous day. The eight food groups used for tabulation of this indicator are: breast milk; grains, roots, tubers and plantains; pulses (beans, peas, lentils), nuts and seeds; dairy products (milk, infant formula, yogurt, cheese); flesh foods (meat, fish, poultry, organ meats); eggs; vitamin-A rich fruits and vegetables; and other fruits and vegetables [6].
Minimum meal frequencyA child receives solid, semi-solid, or soft foods (but also includes milk for non-breastfed children) the minimum number of times or more over the previous day. The minimum number of times is 2 times for breastfed infants 6–8 months, 3 times for breastfed children 9–23 months, and 4 times for non-breastfed children 6–23 months in the last 24 h [6, 29].
Food insecurityIt is defined as a situation where people, individuals at times, lack physical and economic access to sufficient, safe, and nutritious food needed to maintain a healthy and active life. Household food security was assessed using the Household Food Insecurity Access Scale validated tool developed by Food and Nutrition Technical Assistance. The tool has nine occurrence questions followed by nine frequency of occurrence questions that measure the severity of household food insecurity in the past 4 weeks [30].
Household wealth indexA proxy measure of living standards derived from information on ownership available assets and household characteristics and households classified into five categories [18].
IrrigationIt is defined as the application of artificial water to the living plants for food production and overcoming the shortage of rainfall and helping to stabilize agricultural production and productivity [31]. Irrigation users are households who did use irrigation land whereas those households who did not use irrigation land were called “non-users”.
Maternal knowledge on IYCF practiceKnowledge of mothers on infant and child feeding practice was measured based on ten knowledge questions. Each correct answer (yes) earned one point, and any wrong answer (no) got zero. The calculated knowledge score ranged from 0 to 10 points. Those who score above the mean (5.7 ± 2.6 standard deviations) was categorized as knowledgeable and those who score below the mean was categorized as not knowledgeable.
Data collection tool and procedureMothers with children between the ages of 6 and 23 months were interviewed in-person during a home visitation, and information was gathered using a semi-structured questionnaire. The questionnaire was adopted from different literatures. The data collection tool consists of six parts; socio-demographic, wealth index, maternal and child health, maternal knowledge of IYCF practice, 24-hour recall child feeding practice, and household food insecurity. The socio-demographic tools were adapted from the 2016 Ethiopia Demography and Health Survey (EDHS) [18]. The child’s dietary diversity was assessed using the 24-hours dietary recall method [6]. Wealth status was assessed by using questions adapted from the 2016 Ethiopian Demographic and Health Survey (EDHS) and other literature [18, 32]. Household food insecurity was assessed using Household Food Insecurity Access Scale validated tool (HFIAS) [33].
Data quality assuranceTo maintain consistency, questionnaires were written in English, translated into the Amharic language spoken there, and then back into English. Both the supervisor and the data collectors received a three-day training on the goals of the research and the general methods of data collection producer. Before the actual data collection, a pretest including 5% of the samples in comparable locations was carried out. The principal investigators and supervisors verified the consistency and completeness of the gathered data every day.
Data management and analysisData were entered using Epi Data entry client version 4.6.0.6 and exported to SPSS 23.0 statistical package for analysis. Data cleaning was performed to check for consistency and values. A dietary diversity score was computed out of eight food groups, and household economic status was measured by constructing a wealth index. After labeling the variables between 0 and 1, the Principal Component Analysis (PCA) was applied. Then, the wealth status is ranked and labeled as richest, rich, middle, poorer, and poorest from the highest to the lowest rank. The HFIAS indicator categorizes households into four levels of household food insecurity (access): food-secure, mild, moderately, and severely food insecure ( < = 1, 2–10, 11–17, and > 17) respectively. A bivariable logistic regression analysis was done to assess the association between each covariate with MAD. Covariates with p value less than 0.2 during bivariable logistic regression analysis were included in a multivariable logistic regression model to control all possible confounders and identify factors significantly associated with MAD. Unadjusted and adjusted odds ratios along with a 95% confidence interval was estimated to assess the strength of the association of each explanatory variable with MAD. Variables with a p value < 0.05 in the final model were declared statistically significant. Hosmer-Lemeshow goodness-of-fit was used to test the model’s fitness.
留言 (0)