Participants
For this retrospective study, we included patients that received neuroimaging including CTP due to a suspected stroke between 2014 and 2021. All scan data were exported and anonymized to a local instance of the in-house imaging platform NORA (www.nora-imaging.org). The platform is tailored for storage, management, batch processing, visualization, and rating of medical images in a web-based environment, with a specific focus on handling large datasets. Patient records and image data were investigated to determine if a large or medium vessel occlusion was present. The study was approved by the Institutional Review Board (Ethics Committee – University of Freiburg; EK 20/1047) and carried out in accordance with the Declaration of Helsinki and its later amendments. Due to the retrospective nature of this study, the need for written informed consent was waived.
CT imaging
CT scans were performed on a 128-detector row (Somatom Definition Flash; Siemens) or a 64-detector row CT scanner (Somatom Definition 64 AS; Siemens). CTP series were acquired in the axial scan mode with the following protocols for the Somatom Definition Flash: 80 kV, 180 mAs, collimation = 16 × 1.2 mm, no gantry tilt, tube rotation time = 0.3 s, spiral mode, z-coverage = 100 mm, slice thickness = 5 mm, 27 frames every 1.5 s = 42 s scan time (effective temporal resolution in the middle of the slab = 1.5 s, in the periphery = 2.6 s) with 5 s delay after intravenous (16–18 G) injection of 40 mL of Imeron 400 (iopamidol; Bracco) + 30 mL of sodium chloride (NaCl) at a flow rate of 6 mL/s.
The parameters for Somatom Definition 64 AS were the following: 80 kV, 180 mAs, collimation = 32 × 1.2 mm, no gantry tilt, tube rotation time = 0.3 s, spiral mode, z-coverage = 90 mm, slice thickness = 5 mm, 30 frames every 1.5 s = 45 s scan time (effective temporal resolution in the middle of the slab = 1.5 s, in the periphery = 2.6 s) with 5 s delay after intravenous (16–18 G) injection of 40 mL of Imeron 400 + 30 mL of NaCl at a flow rate of 6 mL/s.
For all protocols, images reconstructed to 5-mm slices were used for perfusion processing.
Perfusion processing
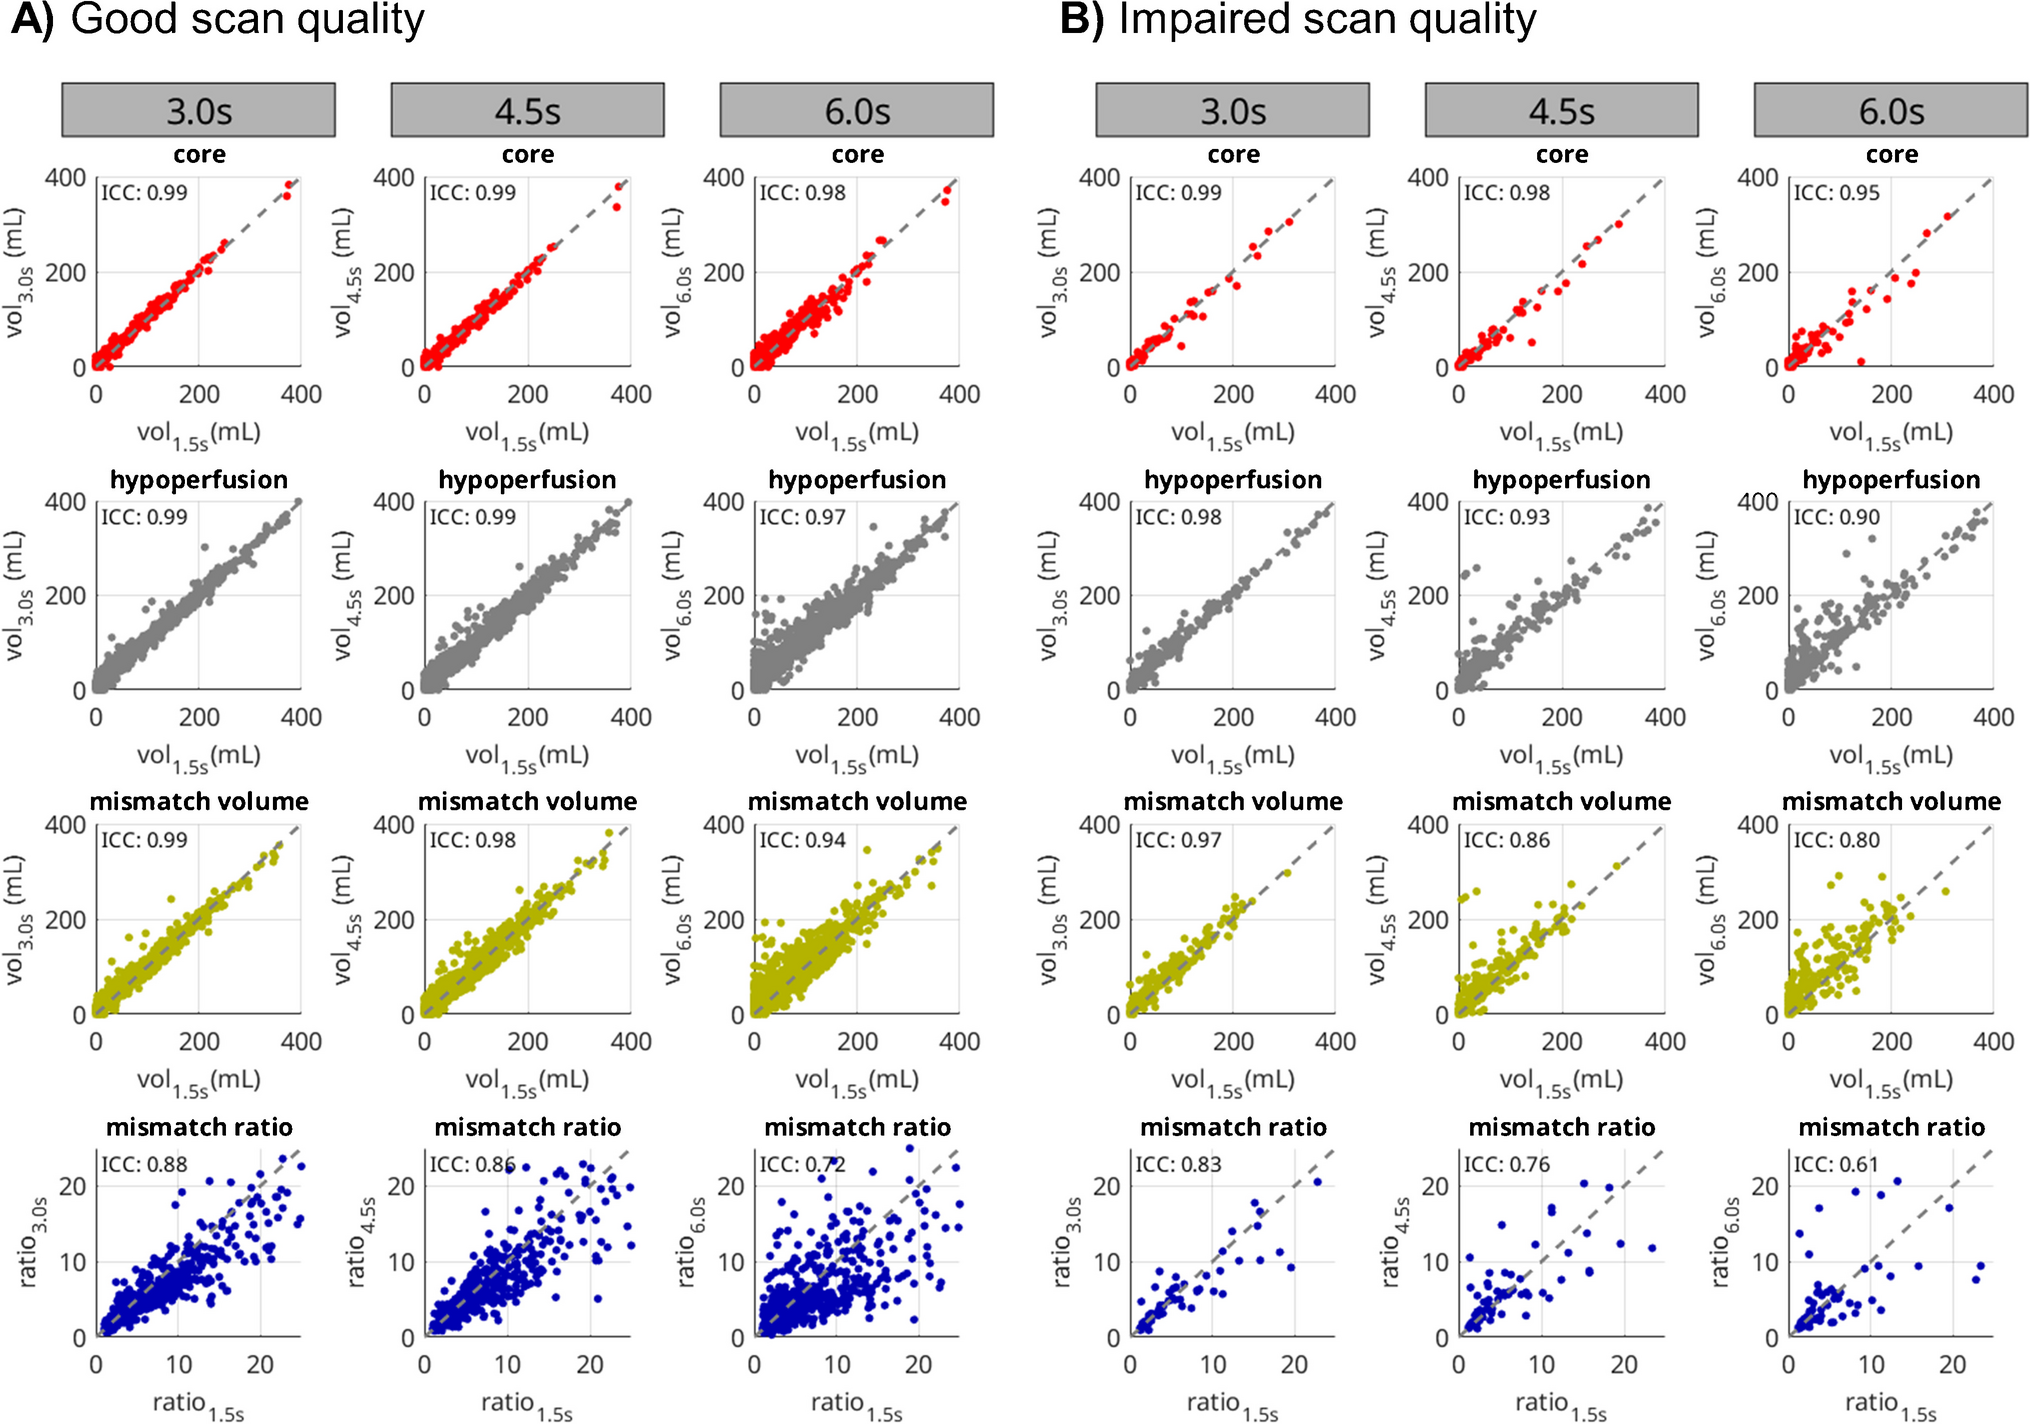
Perfusion scans were analyzed using the software package VEOcore (VEObrain GmbH, www.veobrain.com). The software provides fully automated perfusion processing including motion correction, denoising, deconvolution using Tikhonov regularization, and automated quality control. The outputs of the software are perfusion maps of cerebral blood flow (CBF), cerebral blood volume (CBV), and time to maximum of the residue function (Tmax) where CBF and CBV are normalized to the full contralateral hemisphere on a patient-individual basis. Additionally, the software provides automated segmentation and volumetry of hypoperfusion and core using the commonly established thresholds of Tmax > 6 s for hypoperfusion and CBF < 30% for the infarct core [1, 14, 15]. Further, the mismatch volume (i.e., penumbra) defined as hypoperfusion volume minus core volume, and the mismatch ratio defined as the ratio of hypoperfusion and core volume were calculated. All cases were processed with the reference sampling of 1.5 s and simulated reduced temporal resolution of 3.0 s, 4.5 s, and 6.0 s by leaving out respective time points. Good agreement of VEOcore with other perfusion software has been demonstrated [16, 17].
Quality control
Acquisition of CT perfusion data can be hampered, e.g., due to incomplete contrast administration, truncated boli, and heavy patient motion [18]. This can significantly impact the interpretability of perfusion results, ranging from limited assessment to complete uninterpretability. It can be expected that the issues become more severe with reduced temporal sampling. To investigate this, we performed a quality control based on both visual and automated measures. First, results for the reference sampling with 1.5 s were rated visually, and cases with obviously non-interpretable results due to fatal errors, such as completely truncated boli, failed contrast injection or extreme patient movement, were excluded. For the remaining cases, we used the automated quality control system provided by the VEOcore software (VEObrain GmbH, www.veobrain.com). This system analyzes the mean contrast bolus curve using several metrics and creates a notification if values are suspicious. In this study, we employed the following thresholds: temporal bolus peak position later than 90% of the acquisition window (to identify truncated boli), bolus peak height smaller than 8 HU (to identify cases with low contrast-to-noise ratio), and motion index (defined as the correlation of each dynamic scan with the first scan) smaller than 0.7 (to identify cases with strong motion). Cases without artifacts detected visually or automatically were assigned to a subset of high scan quality, and cases with artifact notifications were assigned to a subset of potentially impaired quality.
Calculation of radiation doses
All dose calculations (CTDIvol and DLP) were performed using a commercially available dose management and reporting platform (DoseM, INFINITT Europe GmbH, Frankfurt, Germany). Doses for the 3.0 s, 4.5 s, and 6.0 s were obtained by division with the proportion of timepoints required for the respective sampling scheme.
Statistical analyses
To assess the interpretability of increased temporal sampling, the original sampling with 1.5 s served as a reference and was compared with simulated 3.0 s, 4.5 s, and 6.0 s. The correlations between the calculated volumes of infarct core, hypoperfusion, mismatch, and the mismatch ratio were plotted as correlation- and bland–altman plots and quantified in terms of intraclass-correlation-coefficient (ICC), and median and standard deviation of the difference of ischemic volumes (ml) between the reference and reduced sampling schemes. The median was chosen to account for a potentially non-Gaussian distribution. For the calculation of the mismatch ratio, small core volumes might result in singular values [13]. Hence, only cases with core volume > 3 mL were considered for analyzing the mismatch ratio to obtain interpretable results [19].
As a qualitative measure of comparison, the cases were sorted according to the differences in core- and hypoperfusion volume with respect to the 1.5 s reference protocol. The 50 topmost cases with very good agreement (i.e., small differences) and low agreement (i.e., great differences) were visually inspected in order to identify reasons for outliers.
Finally, as an additional quantitative measure, in the subgroup with vessel occlusions, hypothetical decisions for mechanical thrombectomy following the DEFUSE-3 criteria [1] were compared. The DEFUSE-3 criteria state that mechanical thrombectomy is appropriate if the CBF core is smaller than 70 mL, the mismatch volume is greater than 15 mL, and the mismatch ratio (hypoperfusion/core) is larger than 1.8. Hypothetical treatment decisions were generated for the reference sampling with 1.5 s and for all other samplings based on these thresholds. The precision of every measurement is inherently limited due to noise and other factors. Consequently, for values in close proximity to the thresholds for treatment decisions, the decision criteria become indistinct. It becomes challenging to discern, for instance, whether a volume of 72 mL truly differs from 69 mL. To mitigate this ambiguity, we estimated a precision of 5 mL for the volumes and 0.2 for the mismatch ratio and applied a corresponding error margin when applying the thresholds. In other words, cases with core volumes between 65 and 75 mL, mismatch volumes between 10 and 20 mL, and mismatch ratios between 1.6 and 2.0 were excluded in the comparison with the confusion matrix. This systematic approach enhances the reliability of our analysis by minimizing the impact of measurement uncertainties and ensuring a more robust evaluation of the data. Upon applying the thresholds for sampling intervals of 3.0 s, 4.5 s, and 6.0 s, we adjusted the boundaries by these amounts to account for the measurement precision. The results were evaluated using a confusion matrix, which provides a summary of the counts for true positives, false positives, true negatives, and false negatives in relation to the 1.5 s reference. All statistical analyses were performed using MATLAB (The MathWorks, Natick, USA).
Data availability
Data is available upon reasonable request and approval by the local ethics committee.


留言 (0)