
記住我


Disclaimer: Early release articles are not considered as final versions. Any changes will be reflected in the online version in the month the article is officially released.
Author affiliations: Institut Pasteur, Paris, France (C. Besombes, A. Gessain, R. Duda, T. Giles Vernick, A. Fontanet); Institut Pasteur de Bangui, Bangui, Central African Republic (F. Mbrenga, E. Gonofio, C. Malaka, E. Nakouné); Aix-Marseille University, Marseille, France (C.-S. Bationo, J. Gaudart, J. Landier); University College London, London, United Kingdom (J. Gaudart); National Museum of Natural History, Paris (M. Curaudeau, A. Hassanin); Conservatoire National des Arts et métiers, Paris (A. Fontanet)
Mpox, caused by monkeypox virus (MPXV), remains a neglected tropical zoonotic disease of forested Central and West Africa (1). Mpox epidemiology is poorly understood, and the MPXV animal reservoir remains unknown (1). Risk factors for zoonotic infection reportedly include subsistence activities in forests and direct or indirect contact with wildlife (2–4). Those characteristics may have evolved in West Africa because Nigeria reported sustained interhuman transmission of MPXV clade II in 2017, which led to the emergence of clade IIb and the global outbreak declared in May 2022 (5). In Central Africa, however, mpox cases remain typically linked to short chains of interhuman transmission after zoonotic spillover (1).
After 1990, reported case numbers increased sharply for Congo Basin/clade I, then a sharp increase in West African/clade II began in 2000 (1). The lack of systematic surveillance hinders investigative understanding of long-term temporal trends (1) and potential seasonality. Available index case time series suggested seasonal changes in risk and high-risk periods: outbreaks occurred predominantly in September in the Central African Republic (CAR) (6), and during June–August in different regions of Democratic Republic of the Congo (DRC) (7–11). We analyzed potential zoonotic transmission seasonality from reported mpox index cases in Africa during 1970–2021.
We systematically analyzed peer-reviewed and gray literature reporting mpox (formerly monkeypox) index cases from zoonotic origin in Africa during 1970–2021. We extracted index case geographic localization and occurrence dates for temporal and spatial analysis. We used the PubMed query (“1970”[Date-Publication]: “2021/12/31”[Date-Publication]) AND monkeypox AND Africa (Appendix Figure 1).
We only included index cases defined as the first reported case presumed to result from zoonotic transmission in an epidemiologic outbreak investigation. We excluded cases outside Africa and those related to secondary interhuman transmission. We also excluded cases without PCR, viral isolation or culture, or electron microscopy confirmation; and cases without onset month or geographic localization (Appendix Figure 2).
We defined index sites as locations with >1 index case. We extracted remotely sensed meteorologic (precipitation, daytime and nighttime temperature), topographic (altitude and slope), land use–land cover data, and fire occurrence data using a 10-km radius buffer zone around each site (Appendix Table 1).
We conducted unsupervised clustering to regroup sites into climate and seasonality (hereafter climate), landscape, and environment profiles. For climate profiles, we included the average cumulative rainfall, daytime and nighttime temperature, and fire index values (Appendix Table 1) for each month in a principal component analysis. We performed hierarchical clustering on principal components, including 99% of dataset inertia, by using R version 4.3 (The R Foundation for Statistical Computing, https://www.r-project.org) and FactoMineR package (https://cran.r-project.org/web/packages/FactoMineR/index.html). We grouped sites by maximizing within-group similarity and between-groups difference. Following the same approach, we used variables describing the percentage of each buffer occupied by each land use–land cover class (e.g., evergreen closed forest, cropland) and topographic variables to obtain landscape profiles. Finally, we combined the 2 sets of variables to generate combined environment profiles (Appendix).
We used the Kruskall-Wallis test to first compare the distribution of latitudes by month of index case occurrence and then to compare months of occurrence according to site environmental characteristics defined by each profile. Using months as a quantitative variable enabled comparison of periods of the year rather than specific months. Sensitivity analyses determined whether the association remained when restricting the analysis to clade II and to recent (2001–2021) cases (Appendix).
We identified 208 index cases: 145 reported from 53 peer-reviewed articles, 26 from 35 gray literature sources, and 37 from CAR national surveillance data (Appendix Figure 2). After exclusion criteria, we retained 133 index cases from 113 sites; 64% were reported from 2000 onward (Appendix Figure 2). Clade I represented 86% of index cases, and clade II represented 13%. DRC accounted for 44% of index cases, and CAR accounted for 33% (Table).
Figure 1
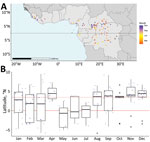
Figure 1. Distribution of cases in a study of seasonal patterns of mpox index cases, Africa, 1970–2021. A) Map of mpox index case sites and month recorded; black horizontal line indicates Equator....
Index cases occurred at a median latitude of 3.44°N (range: −5.87 to 9.53). Index cases latitudes differed significantly across months (p = 0.0354). During January–July (April excluded), index cases mostly occurred <3.44°N, whereas during August–December, most cases occurred >3.44°N (Figure 1).
Figure 2
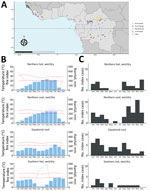
Figure 2. Seasonal distribution of mpox index cases according to the climate profile in Africa, 1970–2021. A) Map of climate/seasonal profile by site. B) Average monthly rainfall, temperature, and fire index (dotted...
We excluded 4 index sites at high altitude (>1,000 m) and 1 Sahelian index site because rare mpox occurrence prevented seasonality characterization in those settings. The other 108 sites clustered into 4 climate profiles. The equatorial cool profile had temperatures <30°C and day-night amplitude <10°C, rainfall across all months, and site latitudes ranging from −4.00° to 4.00°N (Figure 2, panels A and B). The northern cool wet-dry profile had similarly low temperatures and amplitude, a dry season during December–February, and site latitudes in the northern hemisphere. The northern hot wet-dry profile displayed temperatures >30°C during the hottest months, a marked dry season during November–March, and latitude sites in the northern hemisphere. The southern hot wet-dry profile had similarly hot temperatures, a dry season in May–August, and latitude sites in the southern hemisphere (Figure 2, panels A and B). Index cases occurred mostly in the equatorial cool (33%), northern cool wet-dry (35%), and northern hot wet-dry profiles (17%) (Table).
Cases occurred throughout the year in the equatorial cool profile and varied seasonally in the 2 northern wet-dry profiles; cases were nearly absent during April–July (Figure 2, panel C). Seasonality analysis remained inconclusive in the southern hot wet-dry profile, which had low sample size (n = 14). The distribution of index case months was significantly different between climate profiles (p = 0.004). That association persisted in sensitivity analyses (Appendix Tables 2, 3). Landscape and combined environment profiles had poorer association with the month of an index case (Appendix Tables 2, 3; Figures 4, 6, 7).
We showed that the monthly distribution of mpox index cases varied with latitude and was associated with specific climates across the main ecologic mpox niche, excluding high altitude and Sahelian sites. We identified high-risk and low-risk periods across the year in sites located in northern hemisphere climates with alternating dry and wet seasons (>50% of index cases analyzed).
A potential high-risk season occurred during August–March, spanning the last 3 months of the rainy season and all the dry season. That finding suggests complex drivers likely related to human and wildlife ecology. Various seasonal activities can increase human contact with wildlife. During the wet season, human populations settle in forest camps to collect edible caterpillars (6), a major source of protein and income (12). Hunting and trapping activities, generally conducted year round, intensify during the dry season (10). Likewise, dry season slash-and-burn activities tend to drive mammals, notably rodents, toward food resources in neighboring fields, resulting in closer contact with humans.
Multiple obstacles, including access to healthcare, hinder exhaustive mpox reporting from endemic regions. Therefore, this analysis relied on a limited series of well-characterized index cases. Such data and indirect approaches were used extensively to study mpox ecologic niches (13) and emerging diseases with similar surveillance gaps (e.g., Ebola virus) (14). Our conclusion that MPXV zoonotic transmission risk could be seasonal in regions under a dry-wet season cycle warrants further investigation.
Ongoing climate and environmental changes could exacerbate potential underlying seasonal drivers of human MPXV exposure. Determining whether specific seasons or periods bring greater risk for human transmission can improve prevention and surveillance initiatives and contribute to identifying animal reservoirs. For this, a genuine One Health approach is crucial (15).
Dr. Besombes is an infectious and tropical disease clinician and an epidemiologist, who works as a medical epidemiologist in the Emerging Diseases Epidemiology Unit at Institut Pasteur, Paris, France. Her primary research interests include the understanding of emerging infectious diseases and zoonotic diseases, through One Health and EcoHealth approaches.
留言 (0)