
記住我

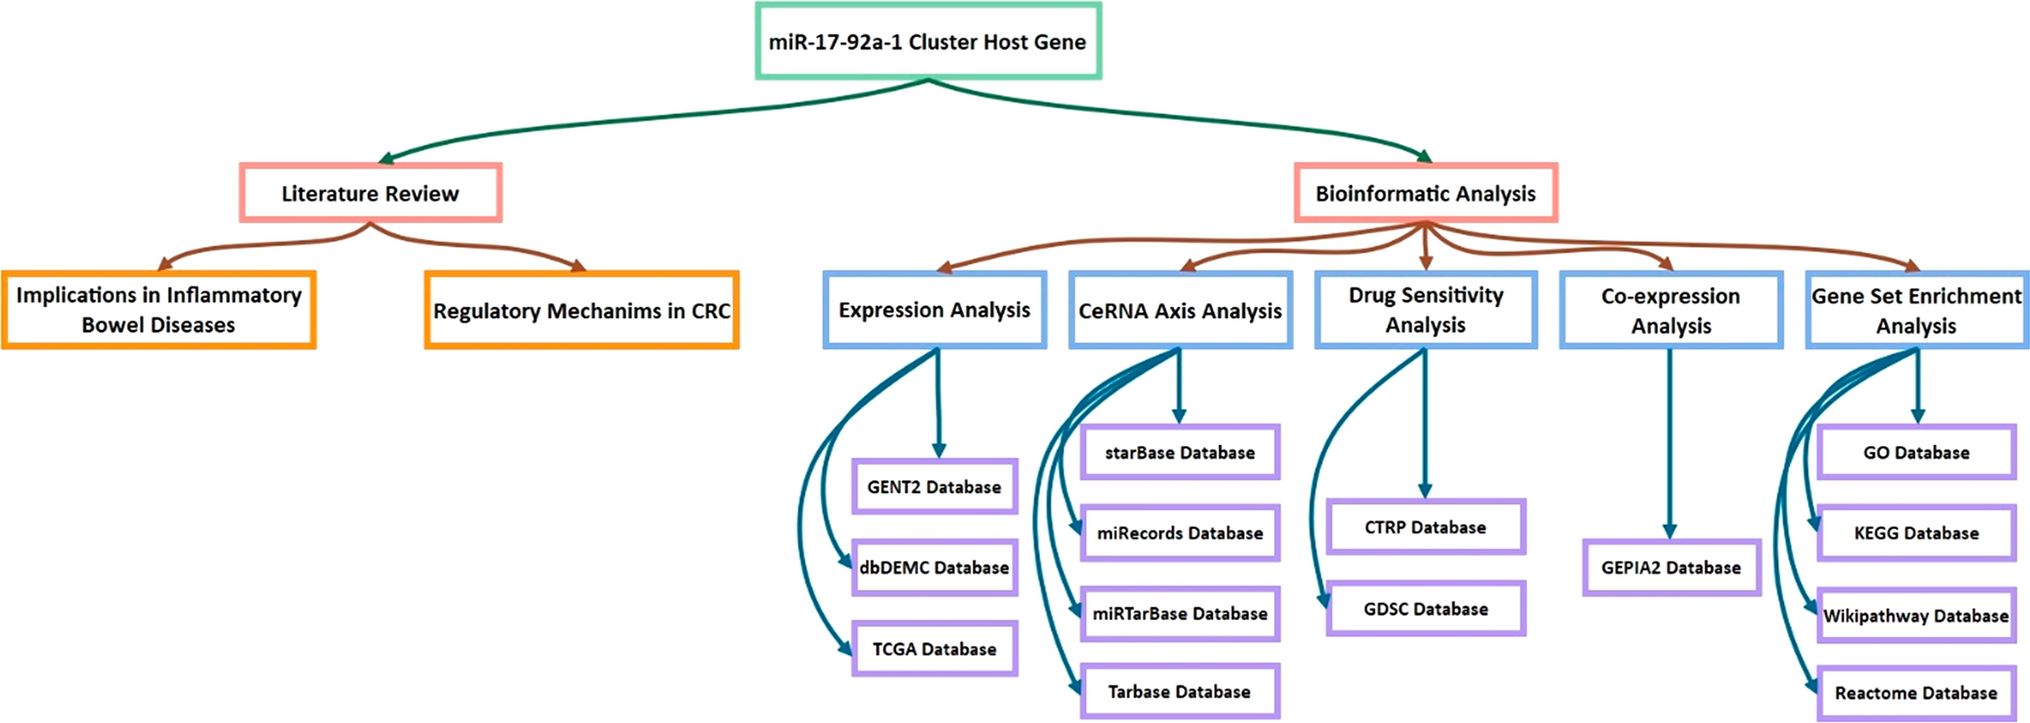
A brief flowchart depicting this study is displayed in Fig. 1. After quality control (QC) of single-cell GSE104782 data, a total of 11,517 cells and 2,000 highly variable genes were screened. Thirty principal components were selected by PCA, and t-SNE and UMAP plots showed no obvious batch in 13 clusters and each sample. Eight cell populations (neutrophils, NKs, HSCs, CD4 + T cells, monocytes, B cells, CD8 + T cells, and erythrocytes) were annotated from 13 cell clusters for subsequent analysis (Fig. 2a–b). The percentage of cell populations in each sample source was counted (Fig. 2c). Hallmark pathway enrichment analysis screened 44 pathways, including ‘IL6-JAK-STAT3 signaling’, ‘P53 pathway’, ‘PI3K AKT MTOR signaling’, ‘MYC TARGETS V1’, and other immune-related pathways that differed between NKs (Fig. 2d–e).
Fig. 1 Fig. 2
The identification of cell clusters based on the profile of a single-cell. a The T-SNE visualization of cluster distribution. b Visualization of cluster distribution using UMAP. c The bar diagrams represent the distribution of 8 types of cells in each sample. d Hallmark pathway of MM and control groups by GSVA enrichment analysis. e Heatmap visualization of Hallmark pathway enrichment
Communication between NK cells and other immune cellsLigand-receptor network relationships for cellular communication were constructed to infer communication probabilities at the pathway level, and detailed networks for each cellular interaction are shown in shell diagrams. Strong communication between NKs and monocytes and CD8 + T cells was identified(Fig. 3a–b). Alluvial plots showed the association with cell subpopulations, ligand-receptor pairs, or signaling pathways for incoming and outgoing communication modes (Fig. 3c–d).
Fig. 3
Communication between NK cells and other immune cells analyzed using cell chat. a Cell–cell interactions in 8 cell types. Direction is indicated by arrows, and edge thickness is a measure of cell interaction. b Shell diagram of cell–cell interactions maps including each cellular interaction. c–d Sankey Diagram of incoming and outgoing communication patterns between different cell subtypes and signaling pathways
Identification and functional analysis of DEGs-NKsA total of 148 DEGs-NKs between MM and control samples were selected in GSE176131 (Fig. 4a–b). To examine the functions of DEGs-NKs, we analyzed the active pathways in each gene (Fig. 4c–d). According to the GO analysis, the DEGs-NKs were enriched in the apoptotic process, immune response, and regulation of the cell cycle. KEGG pathway analysis revealed that most KEGG components were involved in the IL-17 signaling pathway, apoptosis, and MAPK signaling pathway. The PPI network demonstrated 651 protein–protein pairs of 123 proteins (Fig. 4e).
Fig. 4
Identification and function analysis for DEGs-NKs. a A volcano plot of NK cell-associated genes that were differentially expressed between MM and Control samples. b Clustering heatmap of differential NK cell marker genes in MM and Control samples. c GO pathway enrichment analysis for DEGs-NKs. d The Sankey and Bubble plot of KEGG analysis including the top 10 KEGG enrichment pathways of DEGs-NKs. e Networking of DEGs-NKs based on protein–protein interactions (PPIs)
Potential candidate biomarkers related to DEGs-NKs were identified and validatedA total of 8 biomarkers (HIST1H1C, ISG15, JUND, MCL1, RPS16, S100A12, S100A9, and TNFAIP3) were selected using univariate Cox and LASSO regression analysis (Fig. 5a–b). A risk model was constructed with the 8 biomarkers in the GSE136324 training set. Kaplan–Meier survival analysis revealed that high-risk and low-risk patients had significantly different survival outcomes (P < 0.0001). (Fig. 5c). The AUC values all exceeded 0.6 at 1, 3, and 5 years, which suggested that these 8 biomarkers could valuably predict survival status (Fig. 5d). The gene expression in the two risk groups was charted based on risk scores (Fig. 5e). The risk model was validated using the GSE136337 dataset(Fig. 5f–h).
Fig. 5
Identification and validation of potential candidate biomarkers related to DEGs-NKs. a Analyses of univariate Cox regression in DEGs laid out in a forest plot. b Selection of the optimal tuning parameter (λ) by using 20-fold cross-validation with the LASSO regression model. c Kaplan–Meier survival analysis of different groups based on risk score. d ROC curve of the risk model. e Heatmap of 8 hub marker genes in high and low-risk groups. f K-M curves for the validation set. g ROC curves in the validation set. h Heatmap of 8 hub marker genes in high and low-risk groups in the validation set.
Correlation analysis of risk scores with clinical features and construction of an independent prognostic modelTo estimate the correlation between risk scores and clinical features, we extracted the clinical information (gender, age, albumin, ß2m, LDH, ISS stage, and OS) of 866 samples from the GSE136324 dataset. Correlation analyses demonstrated marked differences existed in the risk scores in subgroups of gender, albumin, ß2m, ISS stage, and OS(Fig. 6a), and in the survival status of the samples in all 6 clinical characteristics (Fig. 6b). An assessment of age, albumin, ß2m, LDH, ISS stage, and risk scores was made using univariate Cox, PH test, and multivariate Cox regression to create a nomogram (Fig. 6c). The calibration, ROC (AUC > 0.7), and K-M curves suggested that the nomogram had favorable prediction accuracy (Fig. 6d–e).
Fig. 6
Correlation analysis of risk models and clinical characters. a Correlation analyses of clinical characters, and OS with risk scores. b A comparison of K-M survival curves for the high- and low-risk groups stratified by clinicopathologic features. c univariate Cox regression, PH assumption test, and multivariate Cox regression. d Nomogram for predicting patients’ 1, 3, and 5-year survival rates in the training set. e The ROC curve for the nomogram. f K-M survival analysis of low and high-risk groups based on nomogram
(C) Nomogram for predicting patients’ 1, 3, and 5-year survival rates in the training set. (D) The ROC curve for the nomogram. (E) K-M survival analysis of low and high-risk groups based on nomogram.
Landscape of immune microenvironment in two risk teamsThe abundance of immune cell infiltration was calculated for all samples using ssGSEA (Fig. 7a), and 11 immune cells differed markedly between the two risk groups: activated B cells, activated CD4 T cells, central memory CD4 T cells, central memory CD8 T cells, effector memory CD4 T cells and effector memory CD8 T cells (Fig. 7b). A correlation between 11 differentiated immune cells was also performed (Fig. 7c.) A significant difference existed in TIDE scores between the two risk groups (Fig. 7d)0.32 immune checkpoint-related genes, 20 MHC molecules, 26 chemokines, and 12 receptor-associated genes were markedly different between risk groups (Fig. 7e–h).
Fig. 7
Landscape of immune microenvironment in two risk teams. a Infiltration of immune cells in all samples is plotted in box plots. b Comparative box plot of immune cell infiltration among high-risk and low-risk groups. c Heat map of correlations between 8 immune cell subsets. d Violin plot of the comparison of the TIDE scores between two groups. e Boxplot of expression level of 33 immune checkpoint-related genes in two risk groups. f Boxplot of 26 chemokines expression levels between two groups. g Boxplot of expression levels of 20 MHC molecules in two groups. h Boxplot of 12 receptor-associated gene expression levels between two groups
Differentiation trajectories, regulatory networks, chemo drug prediction, and survival analysis for NKsPseudotime analysis revealed the existence of 7 distinct differentiation states of NKs (Fig. 8a–d). The expression levels of biomarkers in different differentiation states of NKs were demonstrated (Fig. 8e). Correlations between biomarkers and TF were analyzed in the training set and showed a significantly stronger negative correlation between S100A9 and POU2F2 and a significantly stronger positive correlation between S100A12 and KLF5 (Fig. 8f). There were 123 chemical drugs with notable differences in sensitivity in the inter-risk groups. Notably, bortezomib was more sensitive in the high-risk group, and lenalidomide was less sensitive in the high-risk group (Fig. 8g–j).
Fig. 8
Differentiation trajectories, regulatory networks, chemo drug prediction, and survival analysis for NKs. a–d. Based on a single-cell trajectory, Monocle was able to reconstruct two main branches. Cells are colored based on state (a), cluster (b), sample (c), and group (d). (e) Differentially expression of biomarkers in NK cells from different branches. f Heatmap of hub gene and TF correlation. g The Comparison of IC50 of bortezomib, and lenalidomide between the high-risk and low-risk groups. h Scatter plots of correlation analysis of risk score and chemotherapeutic drugs
Verification of diagnostic markers in clinical samplesThe expression levels of eight biomarkers were assessed using qRT-PCR in a cohort of 18 bone marrow samples consisting of 6 control individuals, 6 newly diagnosed MM patients, and 6 refractory/relapsed MM patients. The results showed that MM patients exhibited elevated expression of HIST1H1C, ISG15, JUND, MCL1, and RPS16 compared to healthy controls (Fig. 9). This result suggests a potential association between the HIST1H1C, ISG15, JUND, MCL1, and RPS16 genes and disease progression and the evolution of high-risk clones.
Fig. 9
Relative expression of HIST1H1C, ISG15, JUND, MCL1, RPS16, and S100A12 in different stages of MM patients
留言 (0)