
記住我


Pain is defined as unpleasant sensory and emotional experience associated with, or resembling that associated with, actual or potential tissue damage (Raja et al., 2020).
It is the primary reason why individuals seek medical care and is a major contributor to disability worldwide. Chronic pain, which refers to persistent or recurring pain lasting over 3 months, is particularly burdensome, affecting more than 30% of the global population and causing significant personal and financial challenges. Chronic pain has also been associated with reduced life expectancy, even after accounting for factors such as higher rates of depression, suicide, and opioid use (Cohen et al., 2021). It is important to note that the molecular and cellular mechanisms underlying chronic pain are still not fully understood. Additionally, there remains a lack of safe, well-tolerated, and effective treatments for this condition (Eccleston et al., 2021).
As the most intricate and populous microecosystem in our body, the intestinal microbiota consists of bacteria, archaea, viruses, and fungi. Trillions of diverse bacterial species colonize the gastrointestinal tract in a spatially organized manner, containing over 200 times the number of genes found in the human genome (Backhed et al., 2005; Sender et al., 2016). Maintaining a good gut microbiota diversity is critical for normal life, and its changes (dysbiosis) affect the gut-brain axis, leading to a variety of neurological diseases, including Alzheimer’s disease (AD), Parkinson’s disease (PD), traumatic brain injury, depression, and chronic pain (Sharon et al., 2016; Cryan et al., 2020; Sorboni et al., 2022). Changes in the gut microbiota in patients suffer from different types and regions of chronic pain, including visceral pain, inflammatory pain, headache, neuropathic pain, and chronic generalized pain (Newlove-Delgado et al., 2019; Guida et al., 2020). Meanwhile, some studies also suggest that the gut microbiota may play a causal role in pain. Targeting the gut microbiota by dietary and pharmacologic abiotic intervention may represent a novel therapeutic strategy for treating chronic pain (Guo et al., 2019). In the correlation study showed that the change of intestinal microbiota is associated with human chronic pain and some postoperative results, may mediate the pathogenesis of chronic pain, the future is the urgent need to a more comprehensive understanding of the pathogenesis of individual bacterial taxa in pain, identification and isolation of chronic pain common bacterial taxa and specific diagnosis of cell taxa (Minerbi and Shen, 2022).
In conclusion, we believe that two possibilities should not be overlooked: chronic pain may lead to intestinal dysregulation, and the intestinal microbiota may serve as a potential modulator of chronic pain. However, the intestinal microbiota is a functionally complex entity within an ecosystem, and the causal relationship between the intestinal microbiota, microbial metabolites, and chronic pain remains to be established.
Current clinical studies are mostly observational, and their results are susceptible to confounding factors, eliminating some disadvantages such as limited sample size and prospective design. Hindered our study of the prevention and treatment of chronic pain attacks. Traditionally, well-designed randomized controlled trials have been the gold standard to infer causal relationships between the gut microbiota and chronic pain; however, they are difficult to implement due to ethical and legal limitations. Mendelian randomization as an emerging method is used to determine potential causal relationships between exposure factors and outcomes. Using genetic variants as an unconfounding proxy for exposure, specific single-nucleotide polymorphisms were used as instrumental variables (IVs) (Hemani et al., 2018). Lack of alleles, this design is unlikely to be confused or influenced by reverse causality due to the random distribution of alleles during gamete formation. Based on the strengths of the study design, MR can well reveal the causal effects of exposure and outcome. With the flourishing of publicly available large sample size GWAS data, obtaining higher statistical power is more effective.
Previously, a MR design has been used to explore the causal relationship of gut microbiota with many diseases, such as major depressive disorder (MDD) (Amin et al., 2023), AD (Zhuang et al., 2020), diabetes (Yuan et al., 2023), ischemic stroke (Meng et al., 2023), etc. However, there has not been a specific study investigating the impact of intestinal microbiota on chronic pain in different parts of the body. Therefore, this Mendelian analysis examines the potential causal relationship between individual bacterial taxa and chronic pain at specific sites, involving 212 bacterial taxa and 12 distinct sites of chronic pain. Metabolites play a crucial role in connecting the gut microbiota and the central nervous system. Hence, the analysis also explores potential associations between metabolites and chronic pain, aiming to provide novel insights into the gut-brain axis and interventions for chronic pain.
2 Materials and methods 2.1 Study designTo investigate the causal relationship between gut microbiota (specifically gut microbial metabolites) and chronic pain at 12 specific sites, a bidirectional two-sample MR approach was employed. Summary statistics from large GWAS were utilized, as depicted in Figure 1 and Supplementary Table S1. The ethical approval for each GWAS included in this study can be found in the original articles. The study followed a standard two-sample framework in accordance with Burgess’s guidelines and was reported following the STROBE-MR statement (Burgess et al., 2019). Ethical considerations were taken into account in this study. The analysis was conducted using summary-level data that had already been published and made publicly available. Therefore, no additional ethical approval or informed consent was required for this study. It is important to note that ethical approval had been obtained for all original studies included in the analysis.
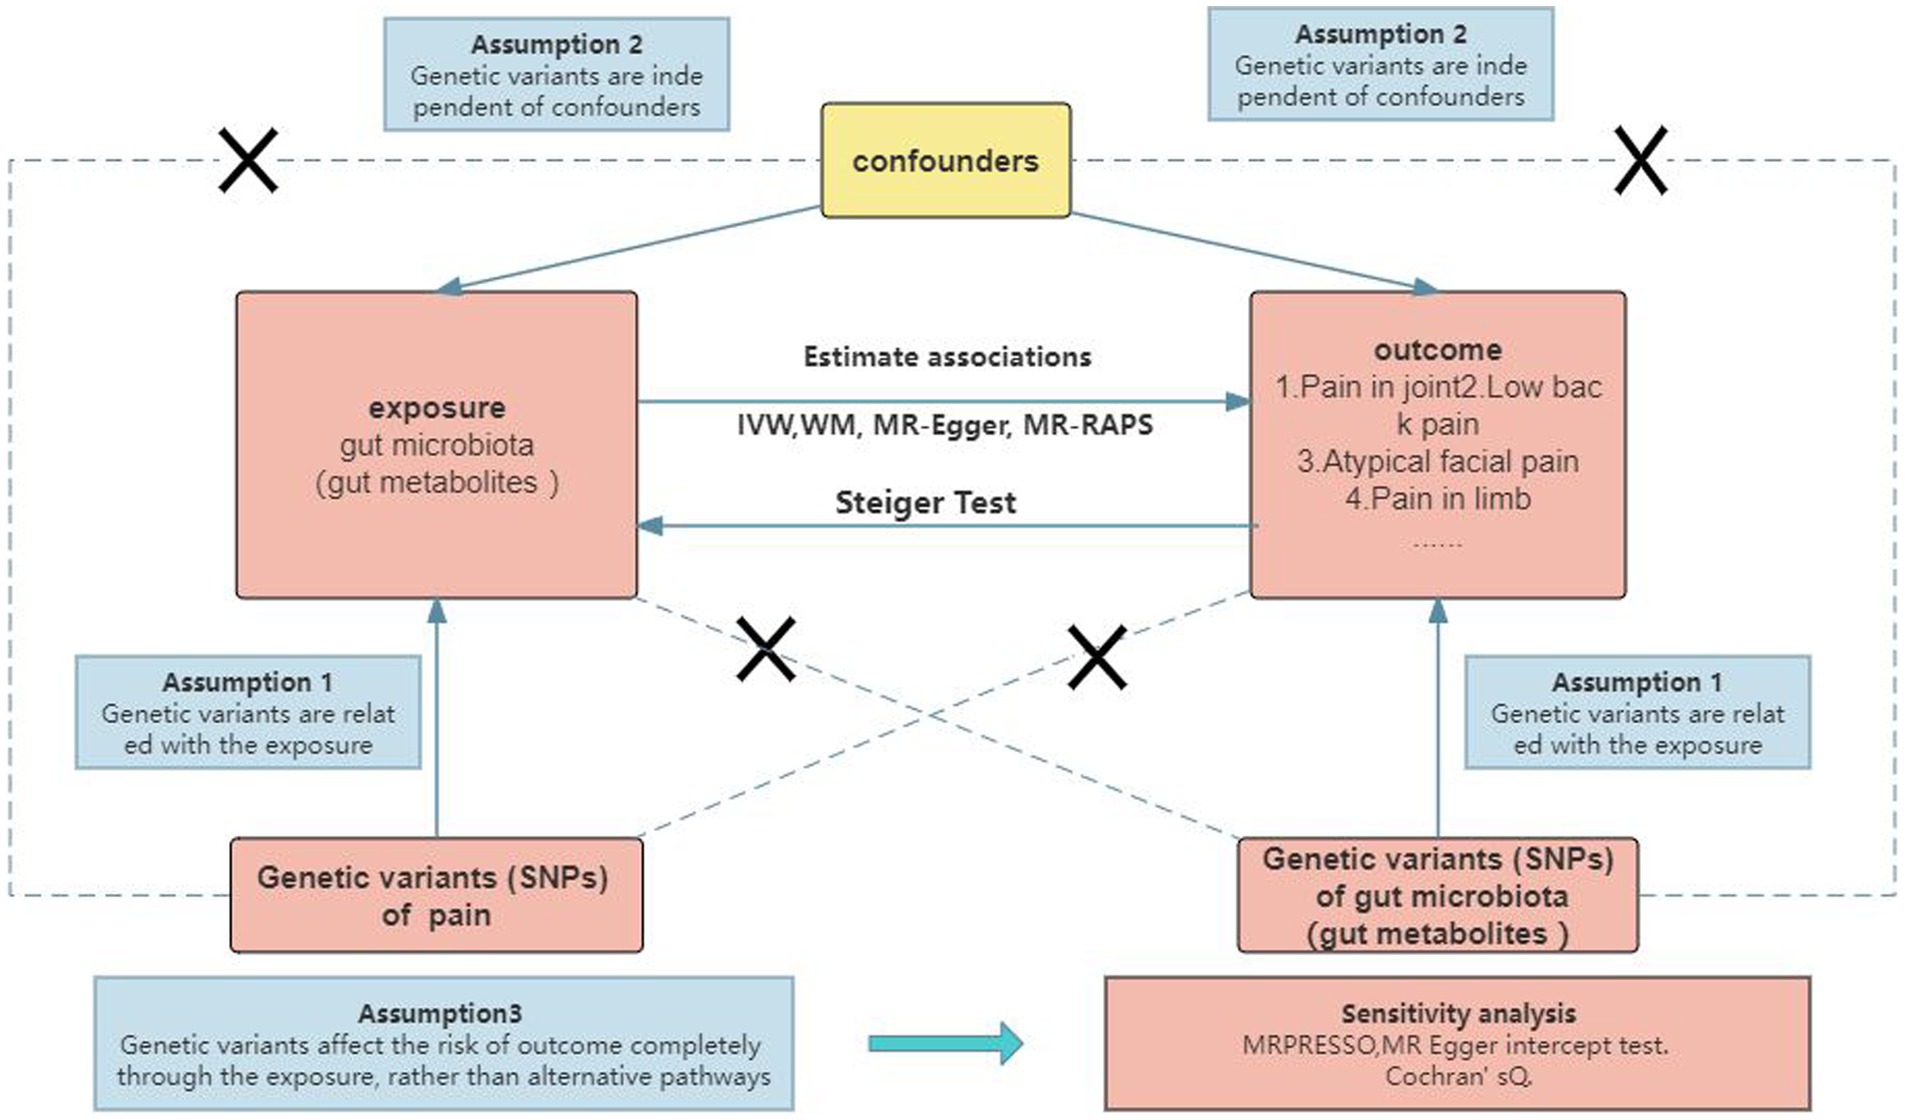
Figure 1. Study design.
2.2 Data sources and study population 2.2.1 Data sources of gut microbiota and gut microbial metabolitesA total of 211 gut microbiomes, spanning from the genus to phylum level, were identified in this study. To ensure reproducibility, all bacterial traits were analyzed using three 16S rRNA regions and rarefied to 10,000 reads. This rarefaction method allowed for consistent comparison across samples. The analysis resulted in the identification of 131 genera, 16 classes, 35 families, 20 orders, and 9 phyla within the gut microbiome. To account for potential confounding factors, such as sex and age, these covariates were adjusted for in all cohorts (Kurilshikov et al., 2021). For more detailed information regarding the composition and characteristics of the gut microbiome, refer to Supplementary Table S1.
2.2.2 Data sources of painThe genetic associations for pain at various body sites were obtained from the Large-scale GWAS meta-analysis, the United Kingdom Biobank, and the FinnGen consortium R9 (Kurki et al., 2023). Specifically, we extracted GWAS summary statistics for pain at 12 specific sites, namely headache, ocular pain, facial pain, neck or shoulder pain, back pain, knee pain, hip pain, limb pain, joint pain, fibromyalgia, pain in thoracic spine, and pain involving the limbs, back, neck, and abdomen. Supplementary Table S1 provides detailed information on the specific data sources for our study, the cohorts involved, genotypes, definitions of endpoints, and association tests.
2.3 Selection of IVsTo ensure the reliability and accuracy of our findings, we performed quality checks on the IVsto identify suitable IVs. The selection of IVs adhered to the following principles: (1) The genetic variants should be associated with the exposure of interest, (2) The genetic variants should be independent of any confounding factors, and (3) The genetic variants should exert their effects on the outcome solely through the exposure, rather than through alternative pathways (Burgess et al., 2019). Given the limited number of IVs that met the genome-wide statistical significance threshold (p < 5 × 10⁻⁸), we decided to employ a locus-wide significance threshold of p < 1 × 10⁻⁵ to obtain a more comprehensive set of IVs (Auton et al., 2015; Jia et al., 2019). To account for any potential effects of linkage disequilibrium (LD), we applied a clumping method with an r2 threshold of 0.001 and a distance threshold of 10,000 base pairs.
2.4 Statistical analysisTo explore the causal relationship between microbiome signatures and chronic pain across different body sites, we performed MR analyses. We employed five commonly used MR methods, namely inverse-variance weighted (IVW) (Burgess et al., 2013), weighted mode (Hartwig et al., 2017), MR-Egger3 (Bowden et al., 2015), weighted median (WME) (Bowden et al., 2016), and simple mode. Among these methods, IVW was considered slightly more powerful than the others under specific conditions, so the primary analysis relied on IVW, while the other methods were used as supplementary analyses (Bowden et al., 2016), To assess the robustness of the significant results, sensitivity analysis methods such as MR-Egger, weighted median, weighted mode, and simple mode were employed.
To detect potential heterogeneity and evaluate the validity of instruments, we conducted a heterogeneity test using Cochran’s Q-test and the two-sample MR package (Greco et al., 2015). A Q-value greater than the number of instruments minus one indicates evidence of heterogeneity and invalid instruments. Alternatively, when the Q-test yield a p-value less than 0.05, it suggests the presence of heterogeneity. To investigate the potential causal impact of pain on the identified significant bacterial genera, we performed a reverse MR analysis. This analysis utilized IVs associated with pain as IVs, with pain as the exposure and the identified causal bacterial genus as the outcome. For this analysis, we employed the MR Steiger directionality test (Hemani et al., 2017).
To determine the statistical significance of the MR effect estimates, we used a Benjamini-Hochberg false discovery rate (FDR) threshold of less than 5% to account for multiple comparisons. All analyses were conducted using “TwoSampleMR,” “jvenn (Bardou et al., 2014),” “MRPRESSO,” “frostplot,” and “ggplot2” in the R software (R version 4.3.02023-04-21 ucrt).
3 Results 3.1 IVs selectionInitially, we identified a total of 13,749 IVs associated with gut microbiota and 66 SNPs associated with gut microbial metabolites as potential IVs from large-scale genome-wide association studies (GWAS). After excluding palindromic SNPs, we further refined this set of IVs. Among them, there were 211 bacterial traits, which were classified into five biological categories: phylum (245 SNPs), class (42 SNPs), order (523 SNPs), family (803 SNPs), and genus (2,703 SNPs). Additionally, we identified 9 gut microbial metabolites, including 3-hydroxybutyrate (BHBA) (10 SNPs), Tryptophan (159 SNPs), Tyrosine (42 SNPs), Phenylalanine (40 SNPs), Glycine (100 SNPs), propionic acid (22 SNPs), 5-HT (15 SNPs), and Trimethylamino oxide (21 SNPs).
After performing clumping and harmonization procedures, a total of 5,078 SNPs with a significance level of p < 1 × 10⁻⁵ were selected as IVs. We systematically collected detailed information about the key features of these SNPs, including the effect allele, other allele, beta coefficient, standard error, and p-value, for further analysis. Detailed information on the instruments for gut metabolites can be found in Supplementary Table S7.
3.2 The causal associations between gut microbiota and pain 3.2.1 HeadacheThe results obtained from the IVW test revealed significant associations between genetically predicted relative abundance of certain bacterial taxa and the risk of headache. The estimated OR and 95% confidence intervals (CI) for these associations were as follows:
• Family.ClostridialesvadinBB60gr: OR = 0.718, 95% CI: 0.972 0.53, p = 0.032;
• Family.Alcaligenaceae: OR = 0.597, 95% CI: 0.903 0.394, p = 0.015;
• Family.Bifidobacteriaceae: OR = 0.823, 95% CI: 0.901 0.752, p = 0.000025;
• Order.Burkholderiales: OR = 0.56, 95% CI: 0.35 0.88, p = 0.012;
• Class.Betaproteobacteria: OR = 0.59, 95% CI: 0.38 0.91, p = 0.018;
• Genus.Coprococcus1: OR = 0.59, 95% CI: 0.39 0.89, p = 0.011;
• Order.Bifidobacteriales: OR = 0.823, 95% CI: 0.901 0.752, p = 0.000025;
• Genus.Eubacteriumcoprostanolig: OR = 0.852, 95% CI: 0.96 0.756, p = 0.009;
• Genus.Eubacteriumrectalegroup: OR = 0.877, 95% CI: 0.985 0.782, p = 0.026;
• Genus.Bifidobacterium: OR = 0.864, 95% CI: 0.97 0.769, p = 0.013.
These findings suggest a negative association between the genetically influenced abundance of these bacterial taxa and the risk of headache. Conversely, the genetic predisposition to headache was positively associated with the relative abundance of the following taxa:
• Phylum.Actinobacteria: OR = 1.643, 95% CI: 2.472 1.092, p = 0.017;
• Genus.Oxalobacter: OR = 1.069, 95% CI: 1.137 1.006, p = 0.032;
• Genus.Victivallis: OR = 1.06, 95% CI: 1.121 1.002, p = 0.041.
Furthermore, Figure 2 and Supplementary Table S8 provided evidence of the causal effects of 196 gut microbiomes on the occurrence of headache.
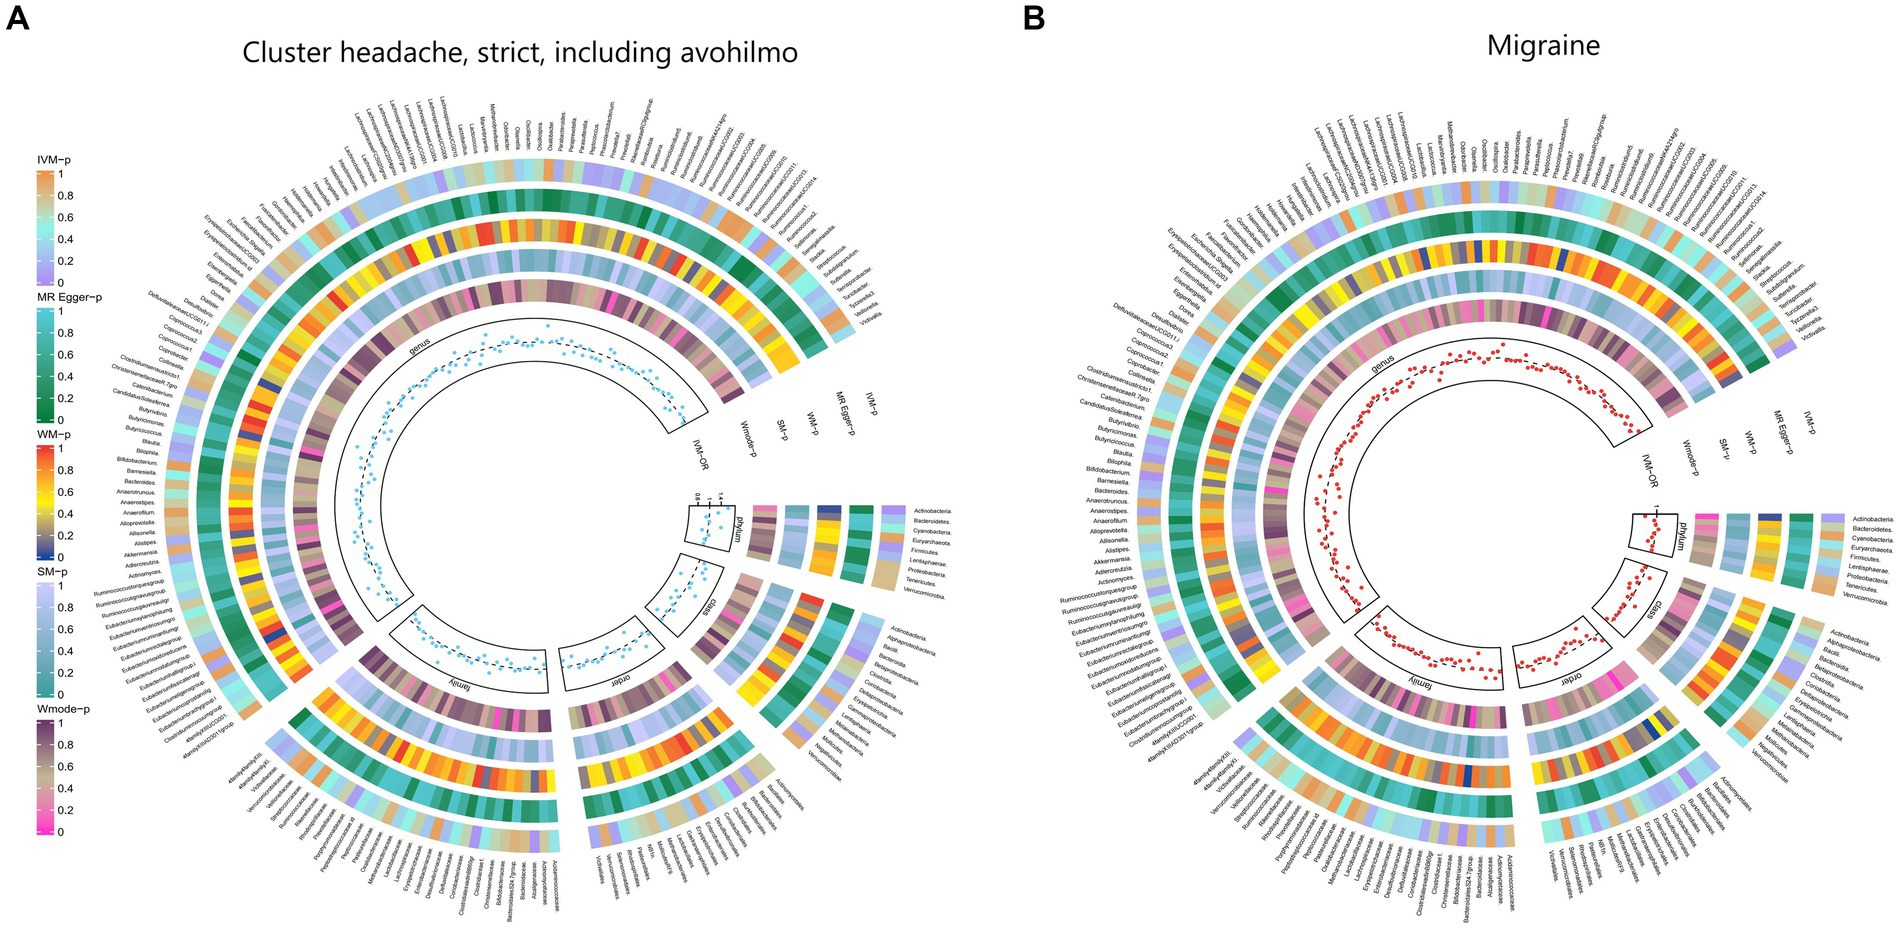
Figure 2. From outside to inside, the p-values of IVW, MR Egger, WM, SM, and Wmode represented, respectively. IVW, inverse variance weighted; WM, weighted median; SM, simple mode; Wmode weighted mode. (A) Causal effect of the gut microbiome on headache. (B) Causal effect of the gut microbiome on migraine in FinnGen Biobank based on MR analyses.
3.2.2 Ocular painThe IVW test results indicated significant associations between genetically predicted relative abundance of certain bacterial taxa and the risk of ocular pain. The estimated OR and 95%CI for these associations were as follows:
• Genus.Oxalobacter: OR = 0.815, 95% CI: 0.967 0.687, p = 0.019;
• Order.Clostridiales: OR = 0.701, 95% CI: 0.997 0.493, p = 0.048;
• Class.Clostridia: OR = 0.702, 95% CI: 0.998 0.494, p = 0.049.
These findings suggest a negative association between the genetically influenced abundance of these bacterial taxa and the risk of ocular pain. On the other hand, the genetic predisposition to ocular pain was positively associated with the relative abundance of the following taxa:
• Genus.Intestinimonas: OR = 1.333, 95% CI: 1.675 1.06, p = 0.014;
• Genus.RuminococcaceaeUCG014: OR = 1.355, 95% CI: 1.733 1.059, p = 0.016;
• Order.Bacillales: OR = 1.218, 95% CI: 1.446 1.026, p = 0.024;
• Genus.Catenibacterium: OR = 1.358, 95% CI: 1.776 1.038, p = 0.025.
Furthermore, Figure 3 and Supplementary Table S9 provided evidence of the causal effects of 196 gut microbiomes on the occurrence of ocular pain.
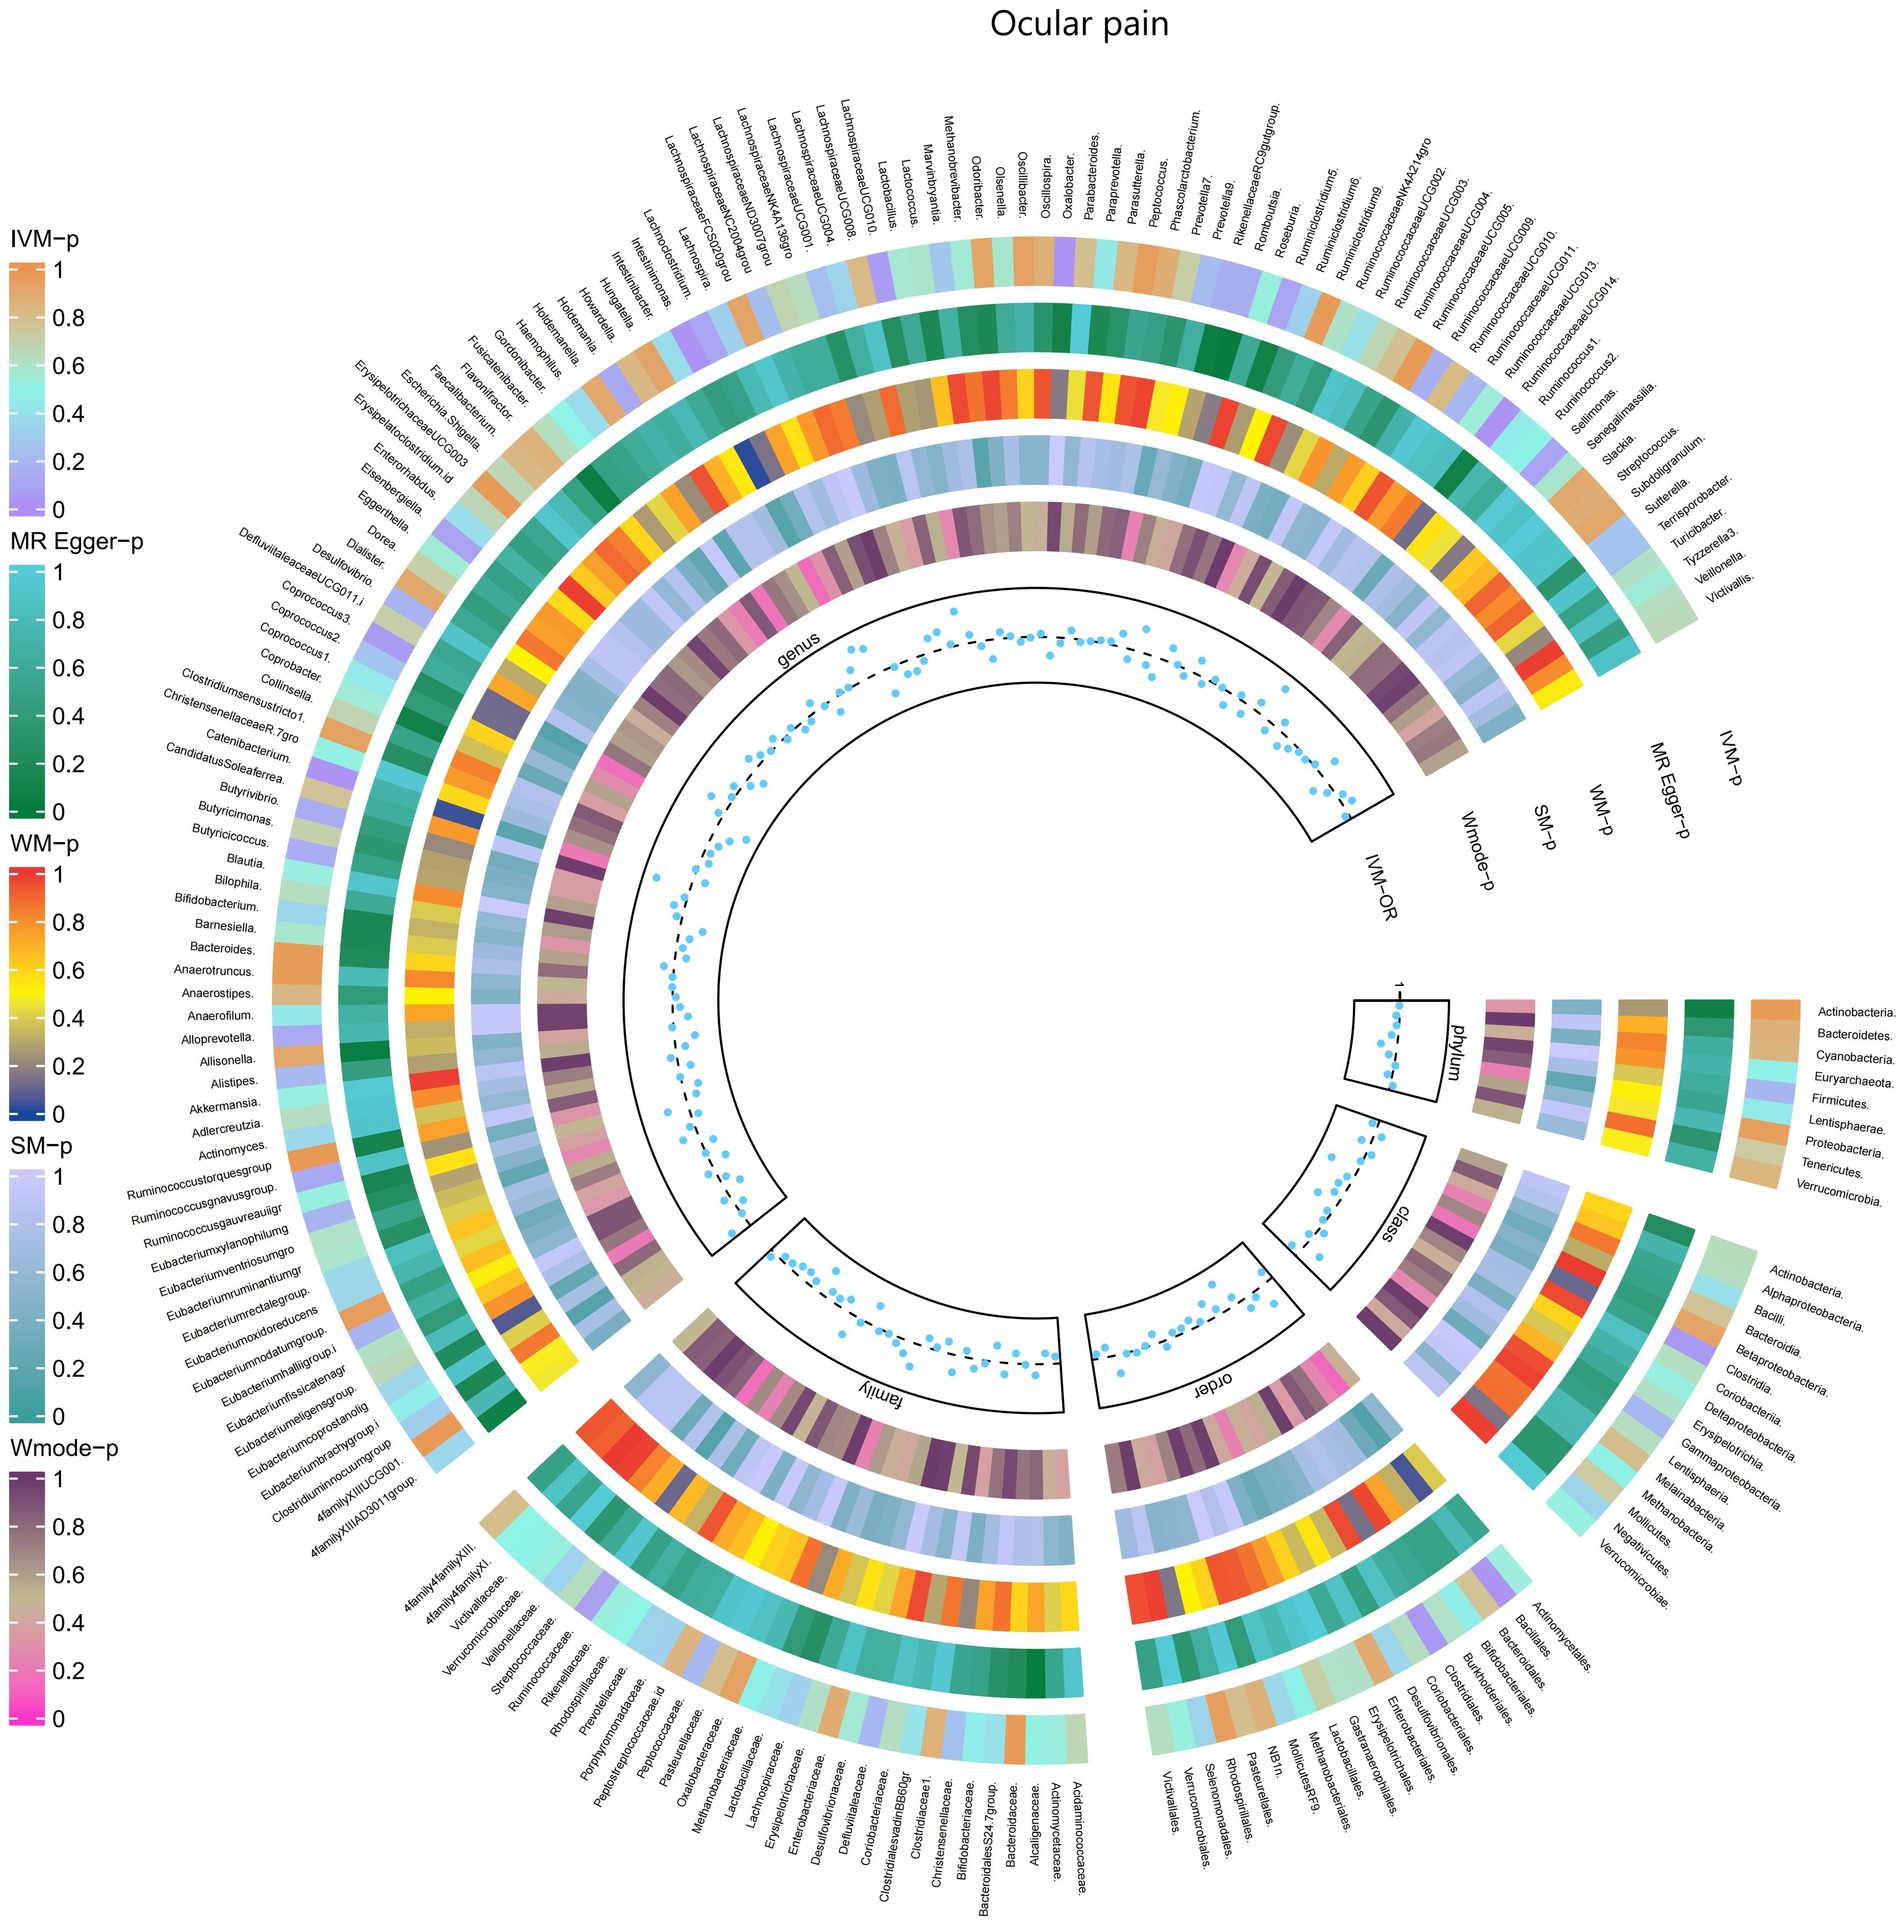
Figure 3. Causal effect of the gut microbiome on Ocular pain in FinnGen Biobank based on MR analyses. From outside to inside, the p-values of IVW, MR Egger, WM, SM, and Wmode represented, respectively. IVW, inverse variance weighted; WM, weighted median; SM, simple mode; Wmode weighted mode.
3.2.3 Facial painThe IVW test results demonstrated significant associations between genetically predicted relative abundance of certain bacterial taxa and the risk of facial pain. The estimates, expressed as OR with corresponding 95%CI, were as follows:
• Genus.Phascolarctobacterium: OR = 0.59, 95% CI: 0.861 0.405, p = 0.006;
• Order.NB1n: OR = 0.779, 95% CI: 0.957 0.634, p = 0.018;
• Genus.Alloprevotella: OR = 0.711, 95% CI: 0.923 0.547, p = 0.011.
These findings indicate a negative association between genetically influenced abundance of these bacterial taxa and the risk of facial pain. Conversely, the genetic predisposition to facial pain was positively associated with the relative abundance of the following taxa:
• Genus.RuminococcaceaeUCG005: OR = 1.435, 95% CI: 1.966 1.047, p = 0.025;
• Phylum.Bacteroidetes: OR = 1.606, 95% CI: 2.457 1.049, p = 0.029;
• Genus.Anaerofilum: OR = 1.29, 95% CI: 1.646 1.011, p = 0.041.
Additionally, Figure 4 and Supplementary Table S10 provided evidence of the causal effects of 196 gut microbiomes on the occurrence of facial pain.
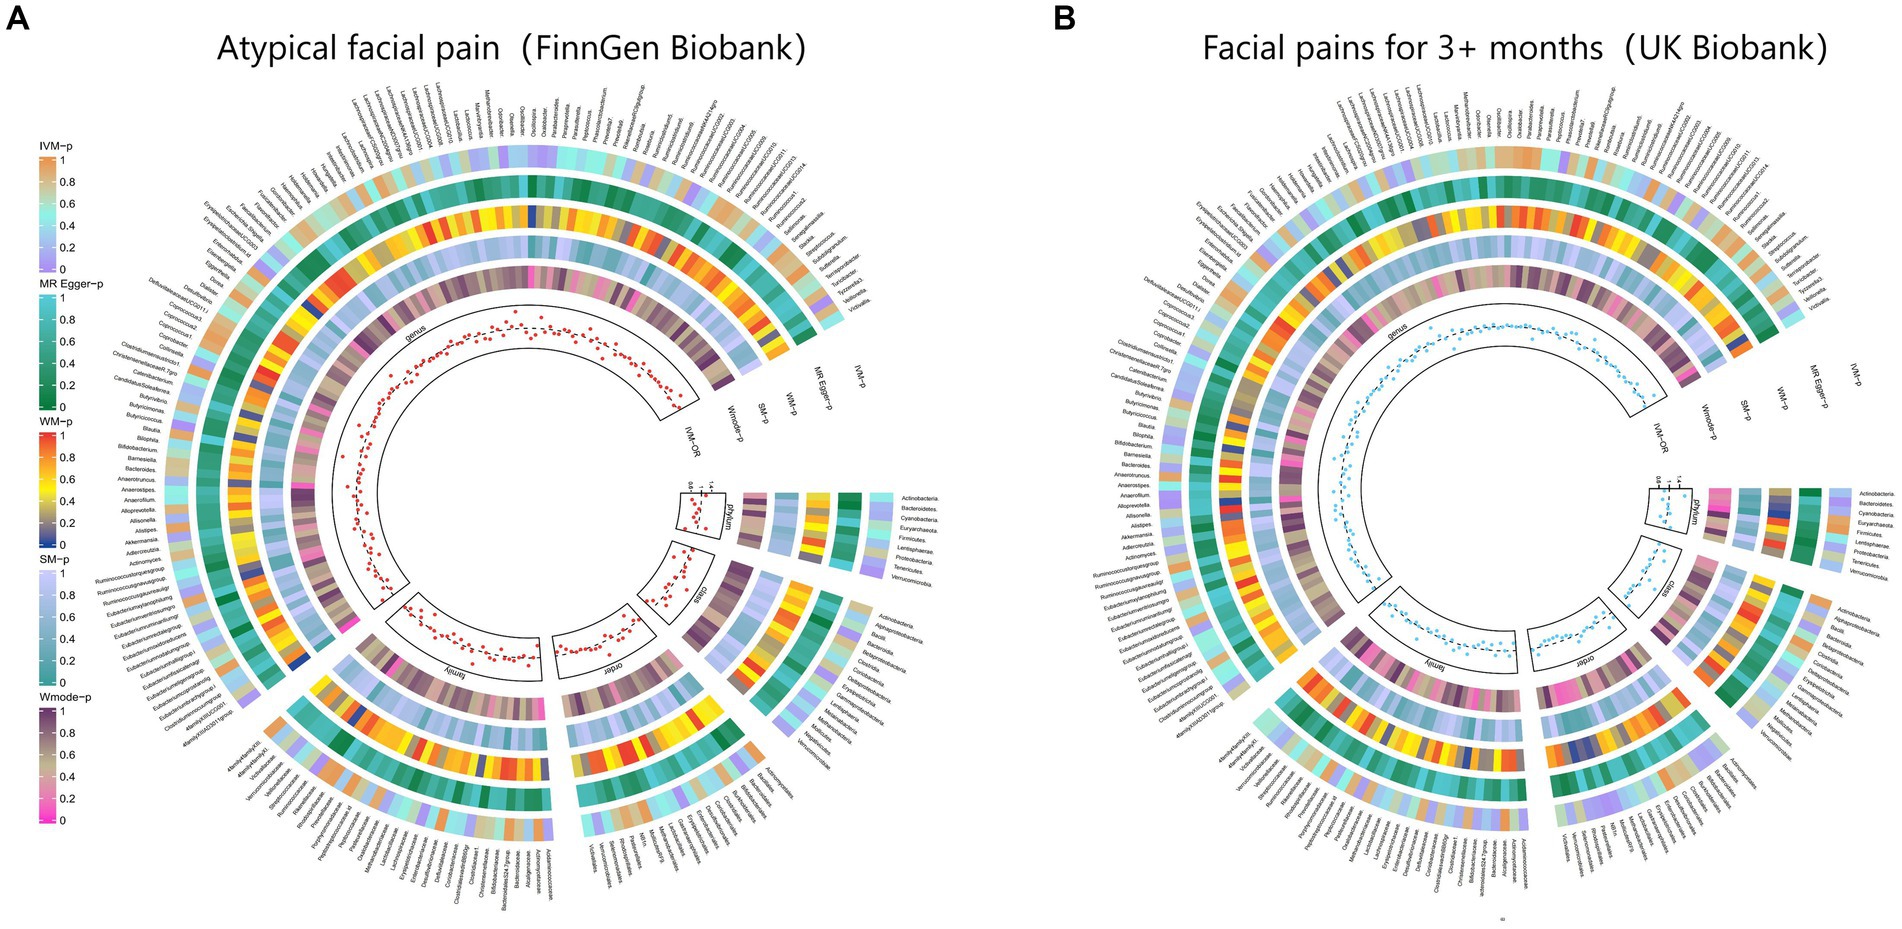
Figure 4. From outside to inside, the p-values of IVW, MR Egger, WM, SM, and Wmode represented, respectively. IVW, inverse variance weighted; WM, weighted median; SM, simple mode; Wmode weighted mode. (A) Causal effect of the gut microbiome on Atypical facial pain (FinnGen Biobank). (B) Causal effect of the gut microbiome on Facial pains (UK Biobank) based on MR analyses.
3.2.4 Neck or shoulder painThe IVW test results revealed significant associations between genetically predicted relative abundance of certain bacterial taxa and the risk of neck or shoulder pain. The estimates, expressed as OR with corresponding 95%CI, were as follows:
• Family.Actinomycetaceae: OR = 0.976, 95% CI: 0.997 0.955, p = 0.027;
• Order.Actinomycetales: OR = 0.976, 95% CI: 0.997 0.955, p = 0.027;
• Genus.LachnospiraceaeUCG010: OR = 0.976, 95% CI: 0.995 0.959, p = 0.012;
• Genus.Escherichia.Shigella: OR = 0.977, 95% CI: 0.995 0.96, p = 0.012;
• Genus.Faecalibacterium: OR = 0.98, 95% CI: 0.998 0.962, p = 0.031.
These findings indicate a negative association between genetically influenced abundance of these bacterial taxa and the risk of neck or shoulder pain. Conversely, the genetic predisposition to neck or shoulder pain was positively associated with the relative abundance of the following taxa:
• Family.Rhodospirillaceae: OR = 1.017, 95% CI: 1.033 1.001, p = 0.041;
• Order.Gastranaerophilales: OR = 1.016, 95% CI: 1.029 1.003, p = 0.015;
• Genus.Methanobrevibacter: OR = 1.016, 95% CI: 1.029 1.002, p = 0.023;
• Genus.Eubacteriumnodatumgroup: OR = 1.012, 95% CI: 1.022 1.001, p = 0.026.
Additionally, Figure 5 and Supplementary Table S11 provided evidence of the causal effects of 196 gut microbiomes on the occurrence of neck or shoulder pain.
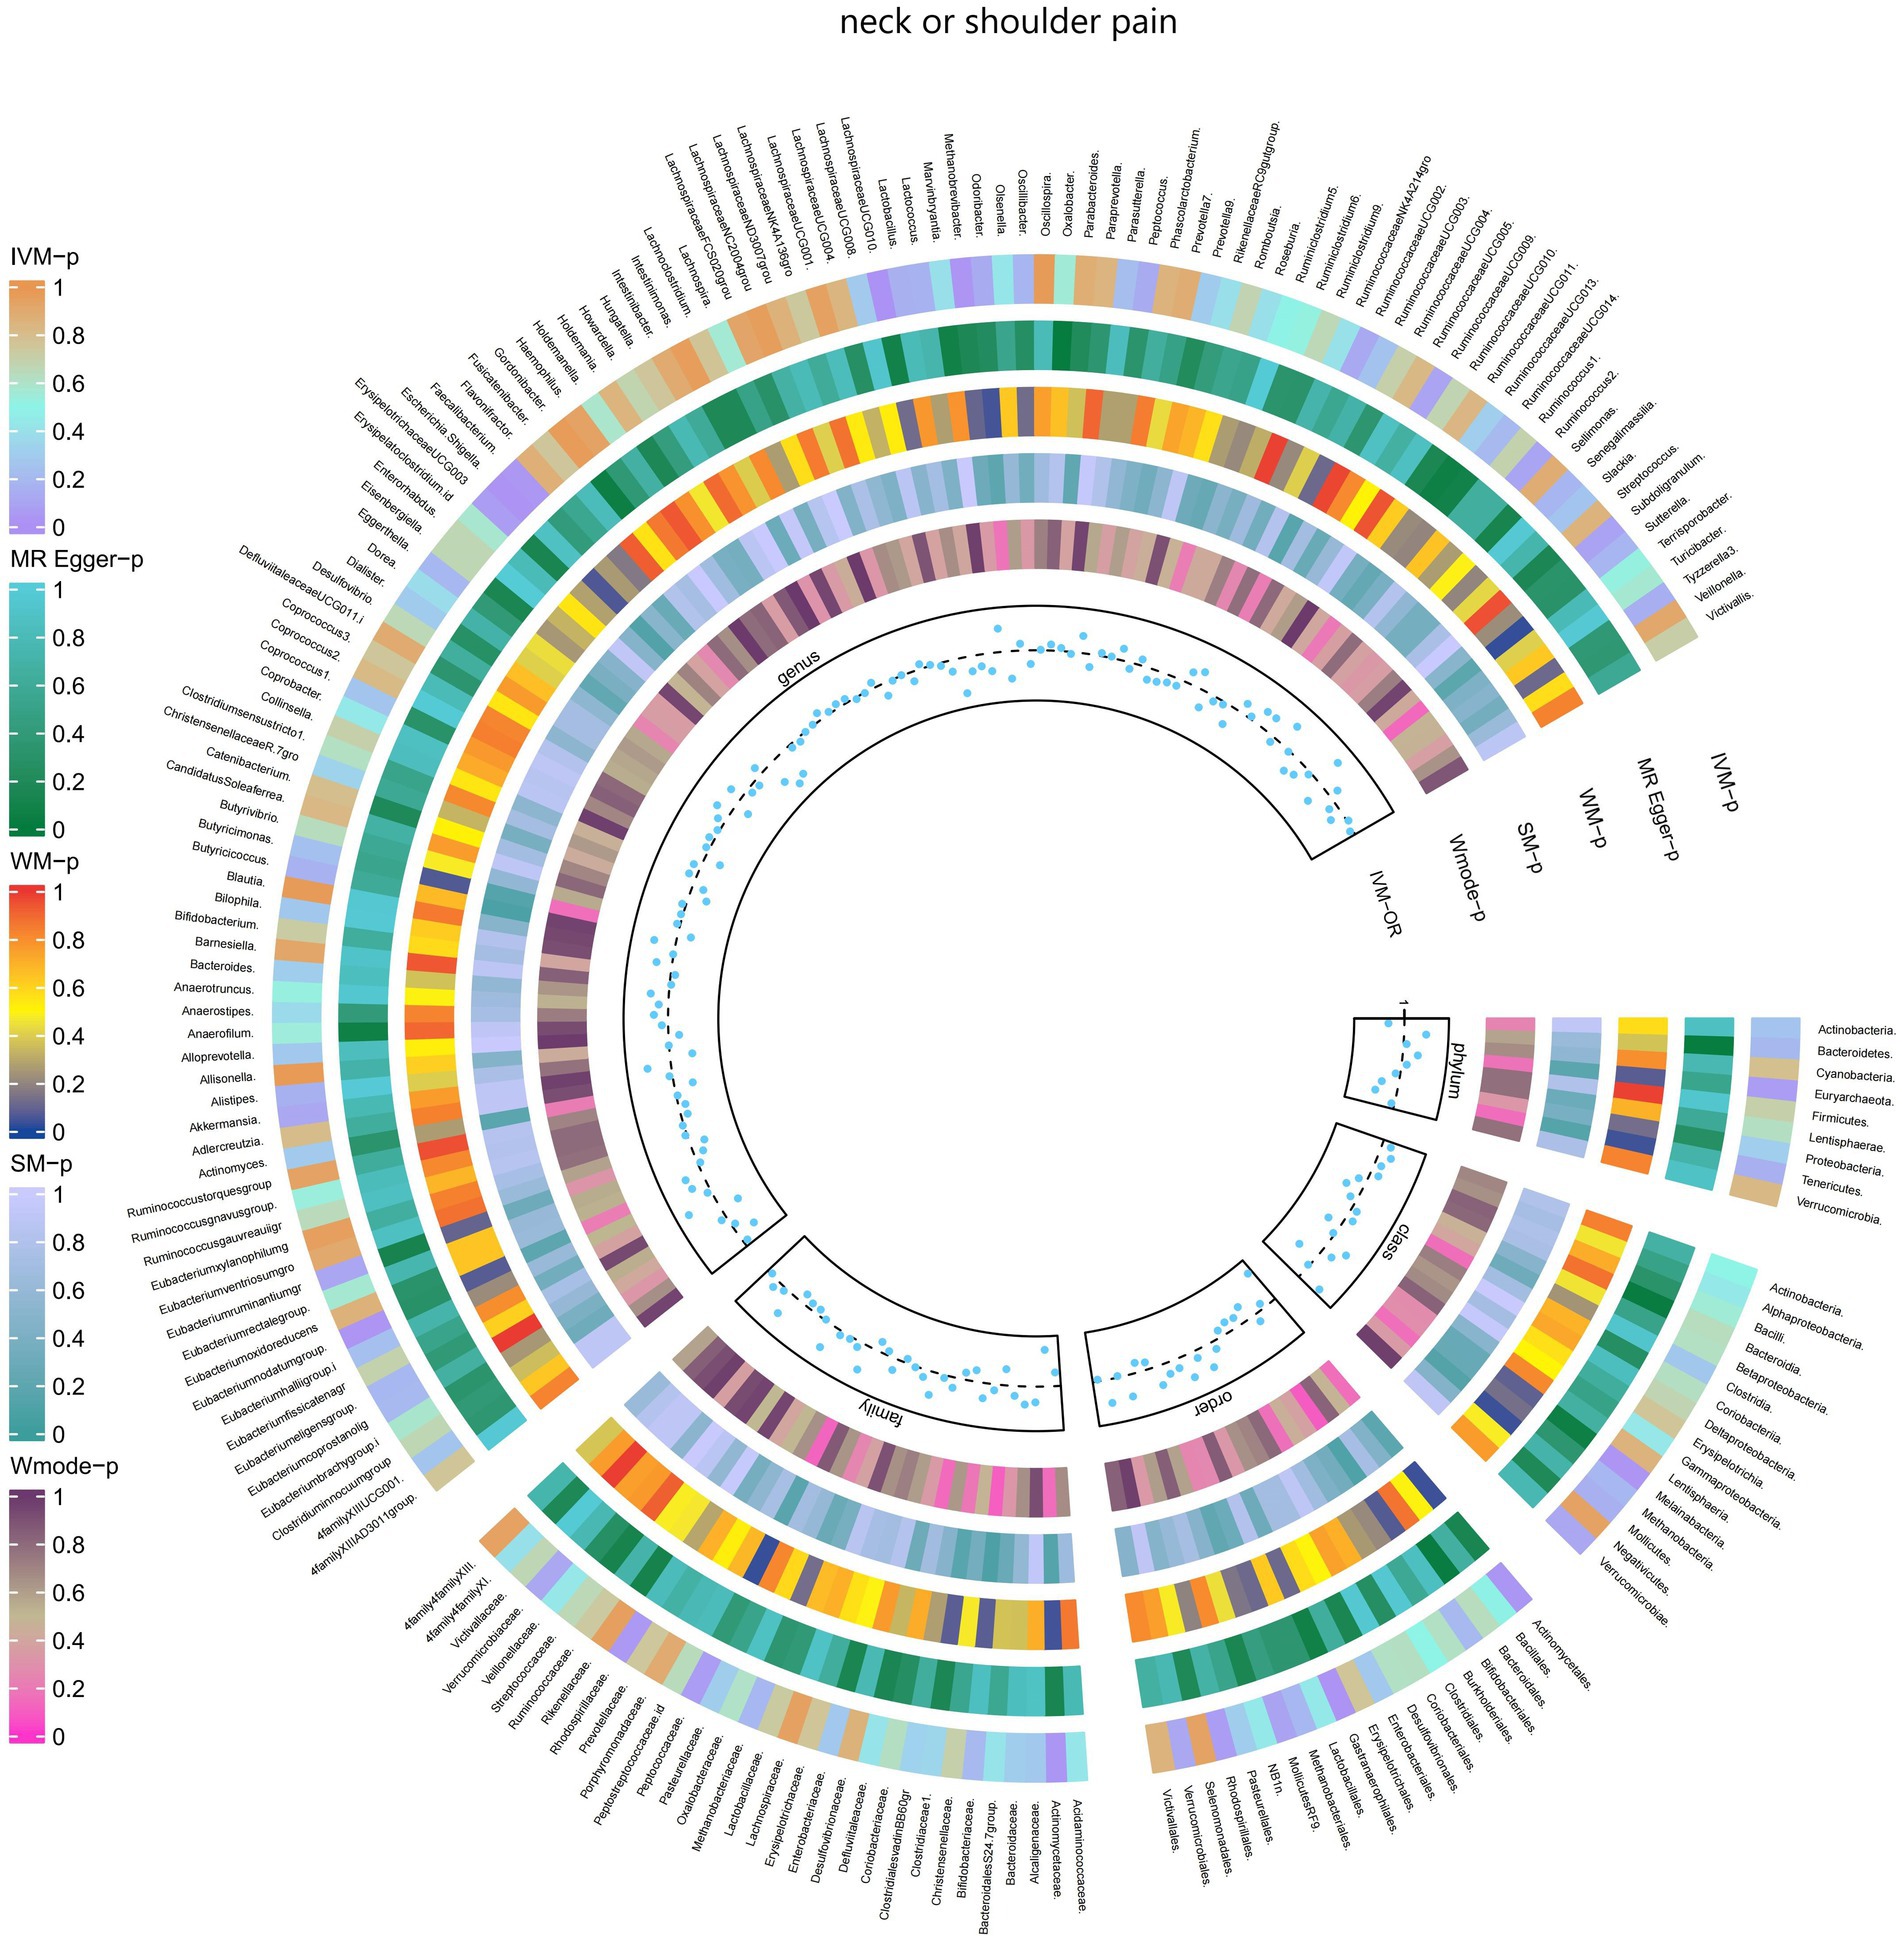
Figure 5. Causal effect of the gut microbiome on neck or shoulder pain (UK Biobank) on MR analyses. From outside to inside, the p-values of IVW, MR Egger, WM, SM, and Wmode represented, respectively. IVW, inverse variance weighted; WM, weighted median; SM, simple mode; Wmode weighted mode.
3.2.5 Back painThe IVW test results revealed significant associations between genetically predicted relative abundance of certain bacterial taxa and the risk of back pain. The estimates, expressed as OR with corresponding 95%CI, were as follows:
• Phylum.Firmicutes: OR = 0.925, 95% CI: 0.987 0.866, p = 0.018;
• FamilyXIII: OR = 0.893, 95% CI: 0.995 0.802, p = 0.04;
• Family.Streptococcaceae: OR = 0.906, 95% CI: 0.99 0.83, p = 0.029;
• Genus.Lactobacillus: OR = 0.941, 95% CI: 0.999 0.885, p = 0.047;
• Genus.Roseburia: OR = 0.9, 95% CI: 0.977 0.829, p = 0.012;
• Genus.Olsenella: OR = 0.932, 95% CI: 0.978 0.889, p = 0.004;
• Genus.RuminococcaceaeUCG011: OR = 0.949, 95% CI: 0.992 0.907, p = 0.021;
• Genus.Eubacteriumrectalegroup: OR = 0.897, 95% CI: 0.97 0.83, p = 0.006;
• Genus.Collinsella: OR = 0.889, 95% CI: 0.965 0.819, p = 0.005;
• Genus.Eisenbergiella: OR = 0.937, 95% CI: 0.997 0.881, p = 0.038;
• Genus.Streptococcus: OR = 0.915, 95% CI: 0.996 0.84, p = 0.04.
These findings suggest a negative association between genetically influenced abundance of these bacterial taxa and the risk of back pain. On the other hand, the genetic predisposition to back pain was positively associated with the relative abundance of the following taxa:
• Family.Prevotellaceae: OR = 1.085, 95% CI: 1.174 1.003, p = 0.042;
• Genus.Oxalobacter: OR = 1.066, 95% CI: 1.11 1.023, p = 0.002;
• Genus.Ruminiclostridium6: OR = 1.073, 95% CI: 1.144 1.007, p = 0.029;
• Genus.RuminococcaceaeUCG005: OR = 1.063, 95% CI: 1.129 1, p = 0.049;
• Genus.Tyzzerella3: OR = 1.047, 95% CI: 1.095 1.002, p = 0.04;
• Genus.Eubacteriumfissicatenagr: OR = 1.066, 95% CI: 1.126 1.01, p = 0.022;
• Genus.Allisonella: OR = 1.06, 95% CI: 1.103 1.018, p = 0.005.
Moreover, Figure 6 and Supplementary Table S12 demonstrated the causal effects of 196 gut microbiomes on the occurrence of back pain.
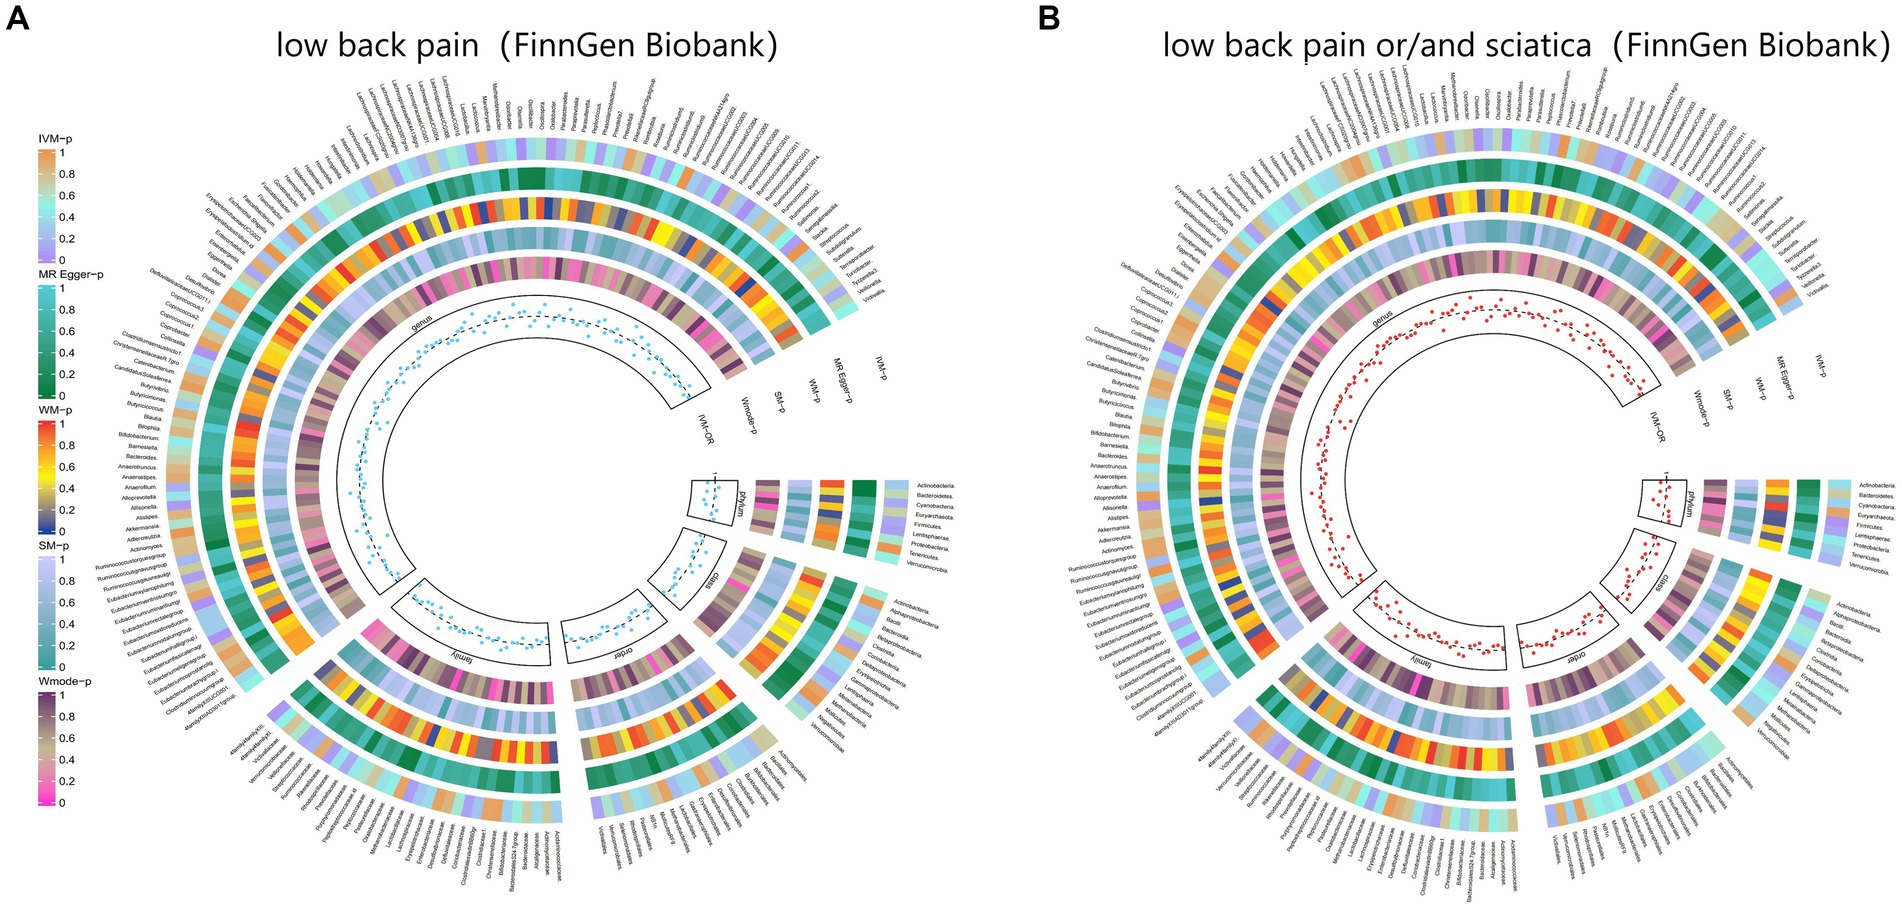
Figure 6. From outside to inside, the p-values of IVW, MR Egger, WM, SM, and Wmode represented, respectively. IVW, inverse variance weighted; WM, weighted median; SM, simple mode; Wmode weighted mode. (A) Causal effect of the gut microbiome on low back pain (FinnGen Biobank). (B) Causal effect of the gut microbiome on sciatica (FinnGen Biobank) based on MR analyses.
3.2.6 Knee painThe IVW test results revealed significant associations between genetically predicted relative abundance of certain bacterial taxa and the risk of knee pain. The estimates, expressed as OR with corresponding 95%CI, were as follows:
• Genus.Parabacteroides: OR = 0.972, 95% CI: 0.993 0.952, p = 0.01;
• Genus.Blautia: OR = 0.971, 95% CI: 0.991 0.952, p = 0.004.
These findings suggest a negative association between genetically influenced abundance of these bacterial taxa and the risk of knee pain. On the other hand, the genetic predisposition to knee pain was positively associated with the relative abundance of the following taxa:
• Phylum.Proteobacteria: OR = 1.02, 95% CI: 1.04 1, p = 0.046;
• Family.Christensenellaceae: OR = 1.023, 95% CI: 1.042 1.004, p = 0.017;
• Family.Rhodospirillaceae: OR = 1.013, 95% CI: 1.026 1.001, p = 0.039;
• Order.Rhodospirillales: OR = 1.018, 95% CI: 1.032 1.005, p = 0.007;
• Order.Selenomonadales: OR = 1.025, 95% CI: 1.045 1.004, p = 0.016;
• Class.Negativicutes: OR = 1.025, 95% CI: 1.045 1.004, p = 0.016;
• Genus.Anaerofilum: OR = 1.013, 95% CI: 1.024 1.002, p = 0.024.
Moreover, Figure 7 and Supplementary Table S13 demonstrated the causal effects of 196 gut microbiomes on the occurrence of knee pain.
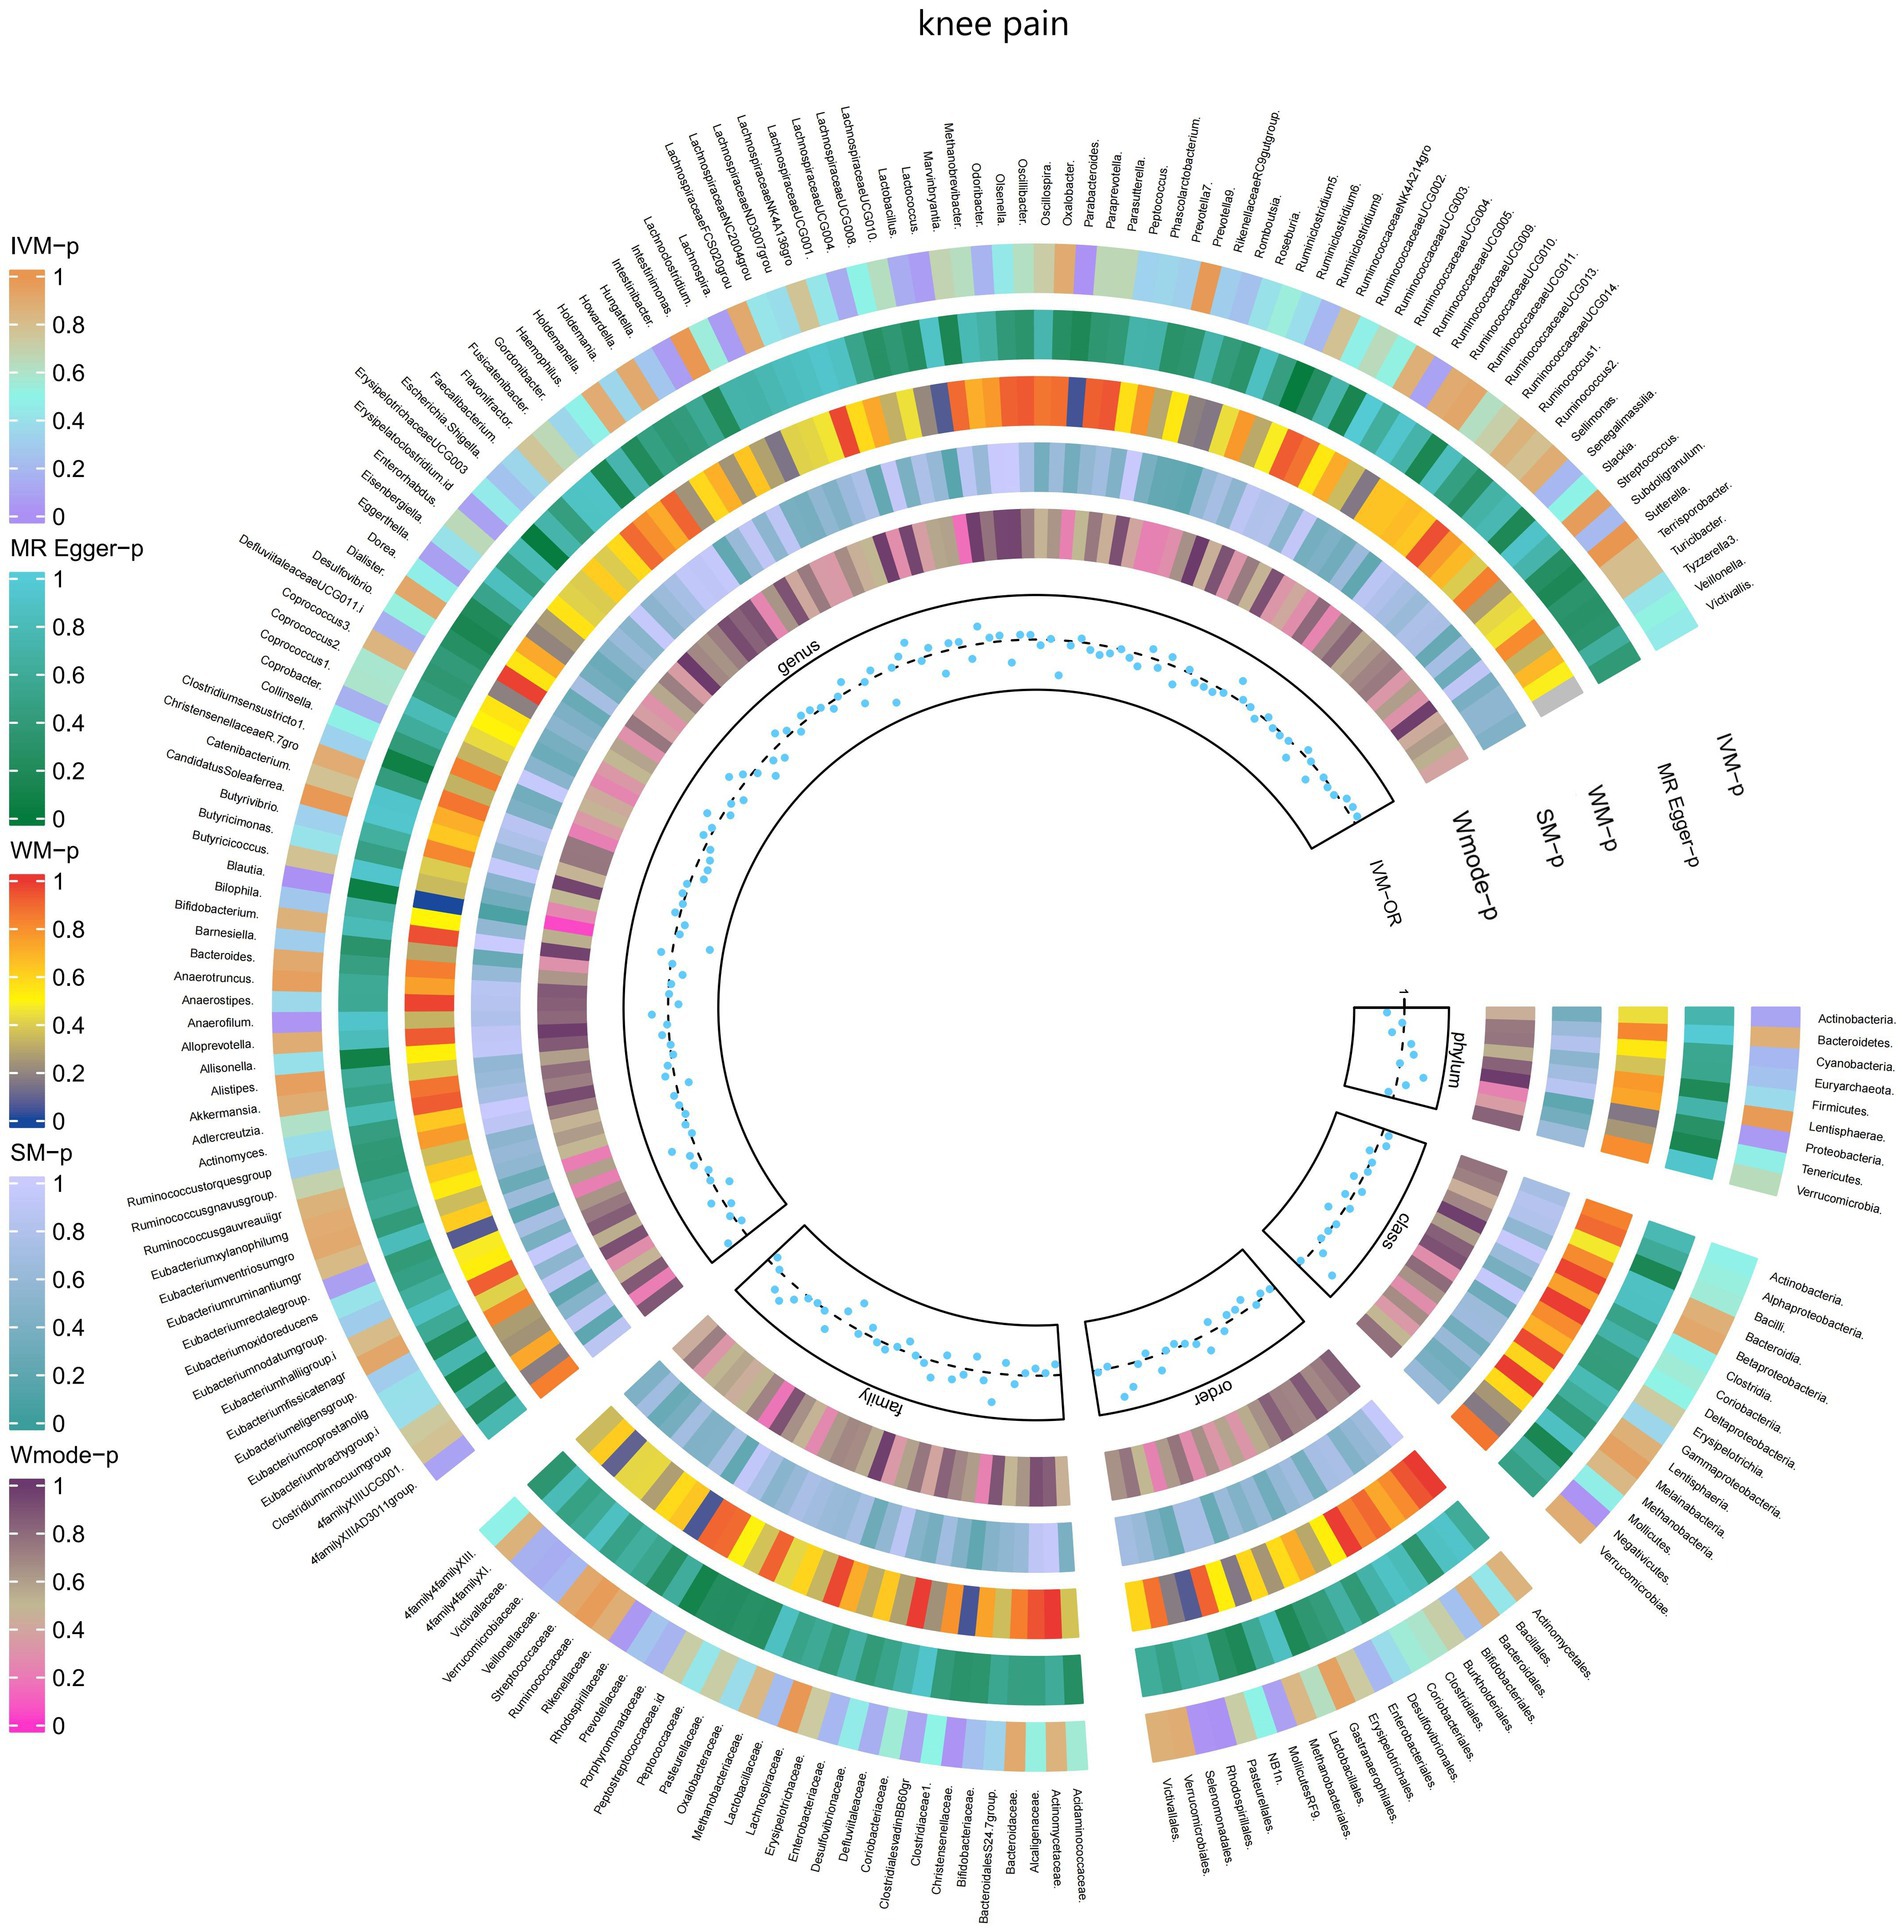
Figure 7. Causal effect of the gut microbiome on knee pain (UK Biobank) on MR analyses. From outside to inside, the p-values of IVW, MR Egger, WM, SM, and Wmode represented, respectively. IVW, inverse variance weighted; WM, weighted median; SM, simple mode; Wmode weighted mode.
3.2.7 Hip painThe IVW test results demonstrated significant associations between genetically predicted relative abundance of certain bacterial taxa and the risk of hip pain. The estimates, represented as OR with corresponding 95%CI, were as follows:
• Phylum.Tenericutes: OR = 0.976, 95% CI: 0.999 0.954, p = 0.042;
• Order.Bacteroidales: OR = 0.972, 95% CI: 0.996 0.948, p = 0.021;
• Class.Bacteroidia: OR = 0.972, 95% CI: 0.996 0.948, p = 0.021;
• Class.Mollicutes: OR = 0.976, 95% CI: 0.999 0.954, p = 0.042;
• Genus.Eisenbergiella: OR = 0.983, 95% CI: 1 0.967, p = 0.049.
These findings suggest a negative association between genetically influenced abundance of these bacterial taxa and the risk of hip pain. Conversely, the genetic predisposition to hip pain was positively associated with the relative abundance of the following taxa:
• Family.Porphyromonadaceae: OR = 1.036, 95% CI: 1.068 1.004, p = 0.027;
• Genus.Roseburia: OR = 1.033, 95% CI: 1.058 1.01, p = 0.005;
• Genus.Adlercreutzia: OR = 1.029, 95% CI: 1.05 1.008, p = 0.007.
Additionally, Figure 8 and Supplementary Table S14 provided evidence of the causal effects of 196 gut microbiomes on the occurrence of hip pain.
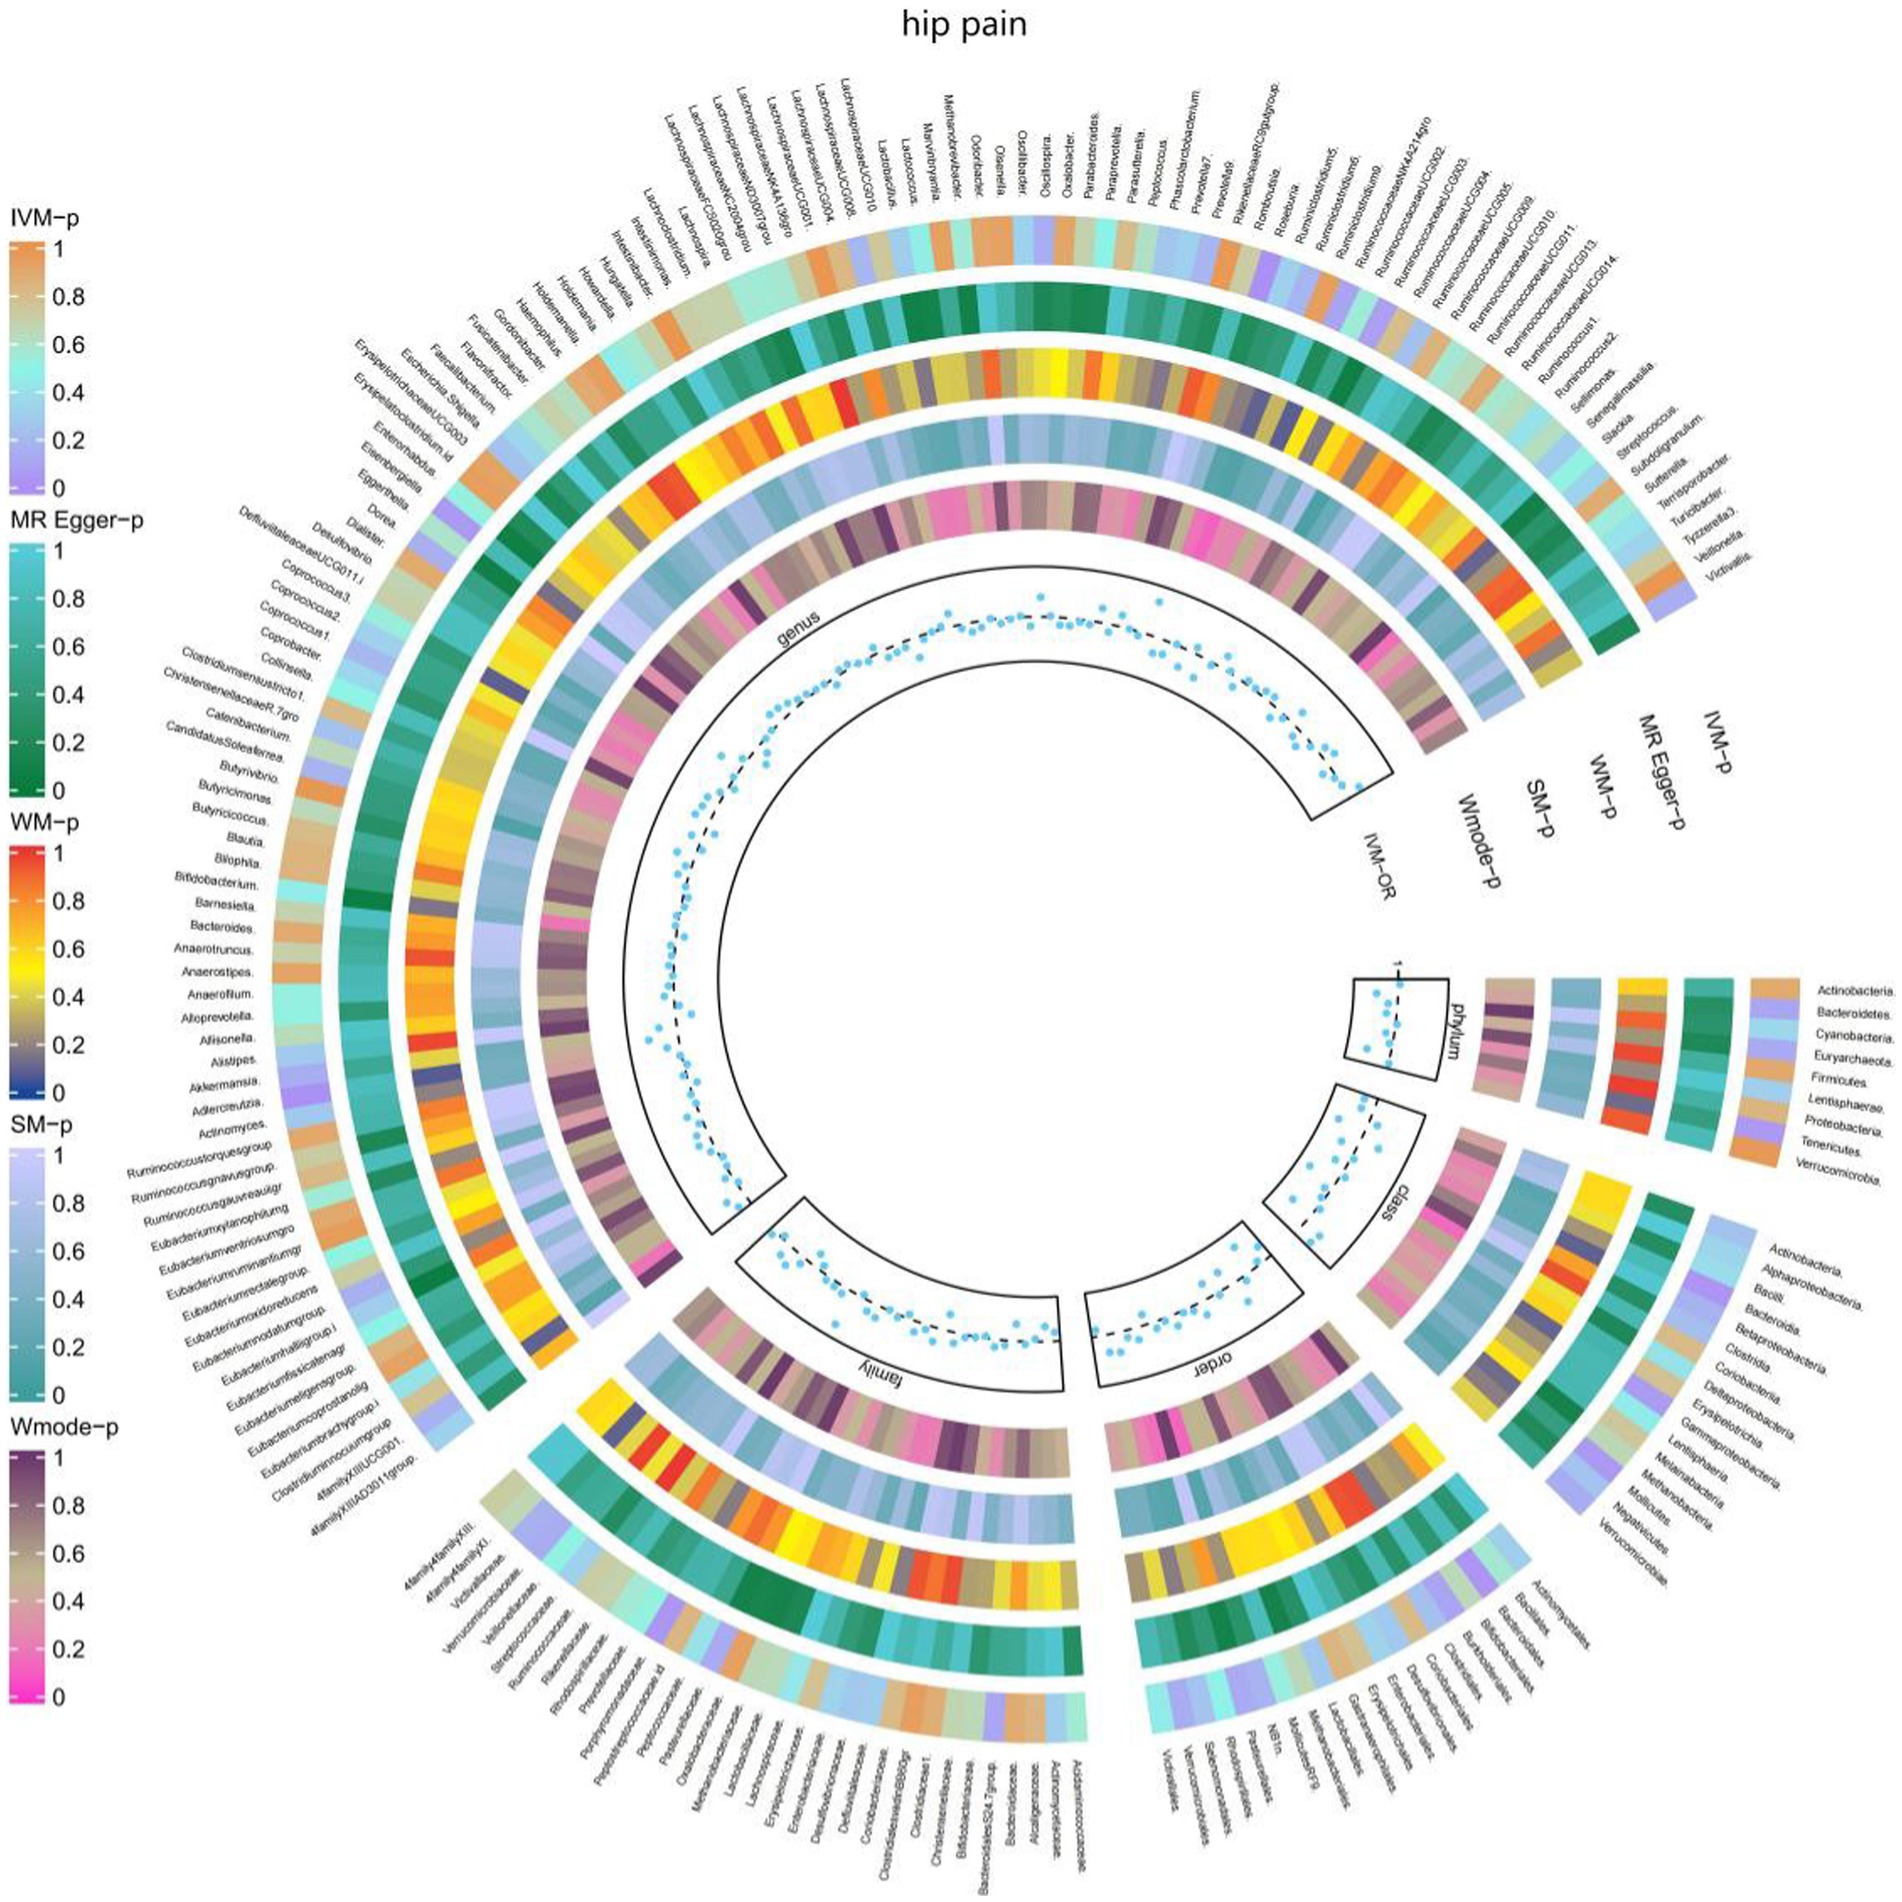
Figure 8. Causal effect of the gut microbiome on hip pain (UK Biobank) on MR analyses. From outside to inside, the p-values of IVW, MR Egger, WM, SM, and Wmode represented, respectively. IVW, inverse variance weighted; WM, weighted median; SM, simple mode; Wmode weighted mode.
3.2.8 Limb painThe IVW test results revealed significant associations between genetically predicted relative abundance of specific bacterial taxa and the risk of limb pain. The estimates, presented as OR with corresponding 95%CI, were as follows:
• Genus.LachnospiraceaeNK4A136gro: OR = 0.919, 95% CI: 0.986 0.857, p = 0.019;
• Genus.RuminococcaceaeUCG003: OR = 0.919, 95% CI: 0.993 0.85, p = 0.032;
• Genus.Butyricicoccus: OR = 0.849, 95% CI: 0.939 0.767, p = 0.001;
• Genus.CandidatusSoleaferrea: OR = 0.925, 95% CI: 0.974 0.878, p = 0.003.
These findings indicate a negative association between genetically influenced abundance of these bacterial taxa and the risk of limb pain. On the other hand, the genetic predisposition to limb pain was positively associated with the relative abundance of the following taxa:
• Genus.LachnospiraceaeND3007grou: OR = 1.232, 95% CI: 1.49 1.018, p = 0.032;
• Genus.Marvinbryantia: OR = 1.116, 95% CI: 1.216 1.023, p = 0.013;
• Genus.Anaerotruncus: OR = 1.091, 95% CI: 1.187 1.003, p = 0.042.
Furthermore, Figure 9 and Supplementary Table S15 provided evidence of the causal effects of 196 gut microbiomes on the occurrence of limb pain.
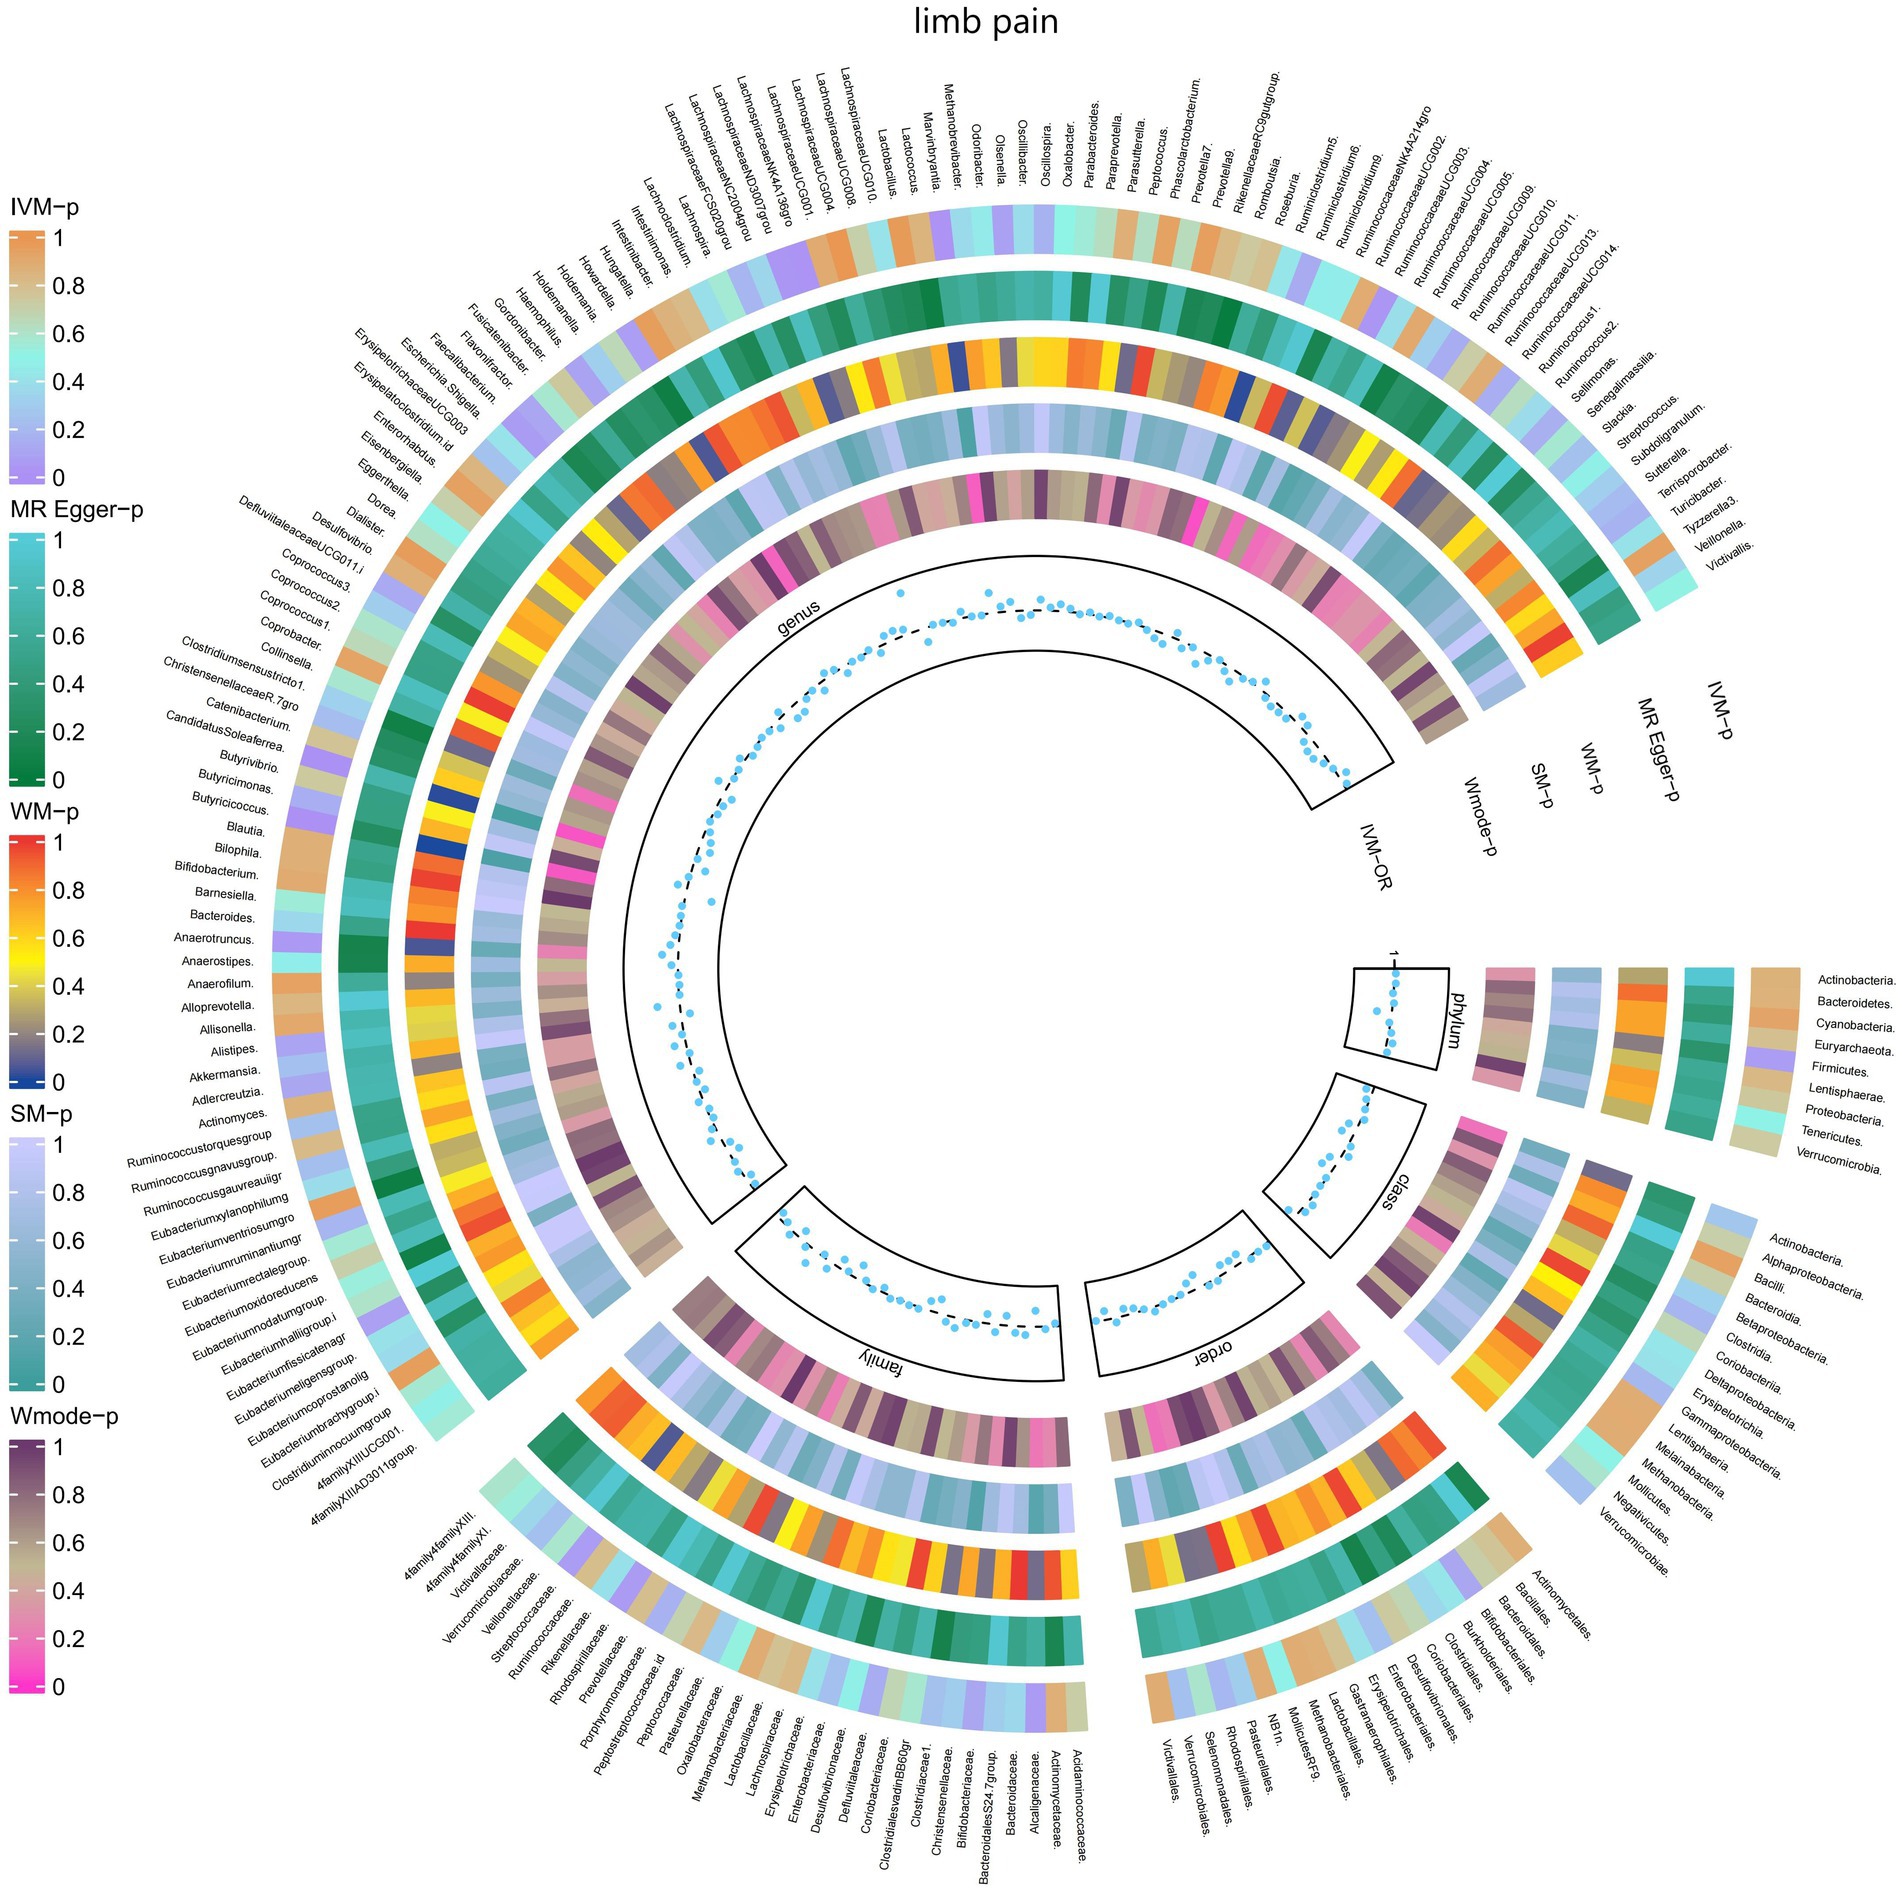
Figure 9. Causal effect of the gut microbiome on limb pain (FinnGen Biobank) on MR analyses. From outside to inside, the p-values of IVW, MR Egger, WM, SM, and Wmode represented, respectively. IVW, inverse variance weighted; WM, weighted median; SM, simple mode; Wmode weighted mode.
3.2.9 Joint painThe IVW test results demonstrated significant associations between genetically predicted relative abundance of certain bacterial taxa and the risk of joint pain. The estimates, presented as OR with corresponding 95%CI, were as follows:
• Genus.Terrisporobacter: OR = 0.901, 95% CI: 0.99 0.819, p = 0.031;
• Genus.Eubacteriumoxidoreducens: OR = 0.906, 95% CI: 0.987 0.832, p = 0.024.
These findings suggest a negative association between genetically influenced abundance of these bacterial taxa and the risk of joint pain. Conversely, the genetic predisposition to joint pain was positively associated with the relative abundance of the following taxa:
• Order.Selenomonadales: OR = 1.112, 95% CI: 1.229 1.006, p = 0.038;
• Class.Negativicutes: OR = 1.112, 95% CI: 1.229 1.006, p = 0.038;
• Genus.Dialister: OR = 1.11, 95% CI: 1.211 1.017, p = 0.019.
Furthermore, Figure 10 and Supplementary Table S16 provided evidence of the causal effects of 196 gut microbiomes on the occurrence of joint pain.
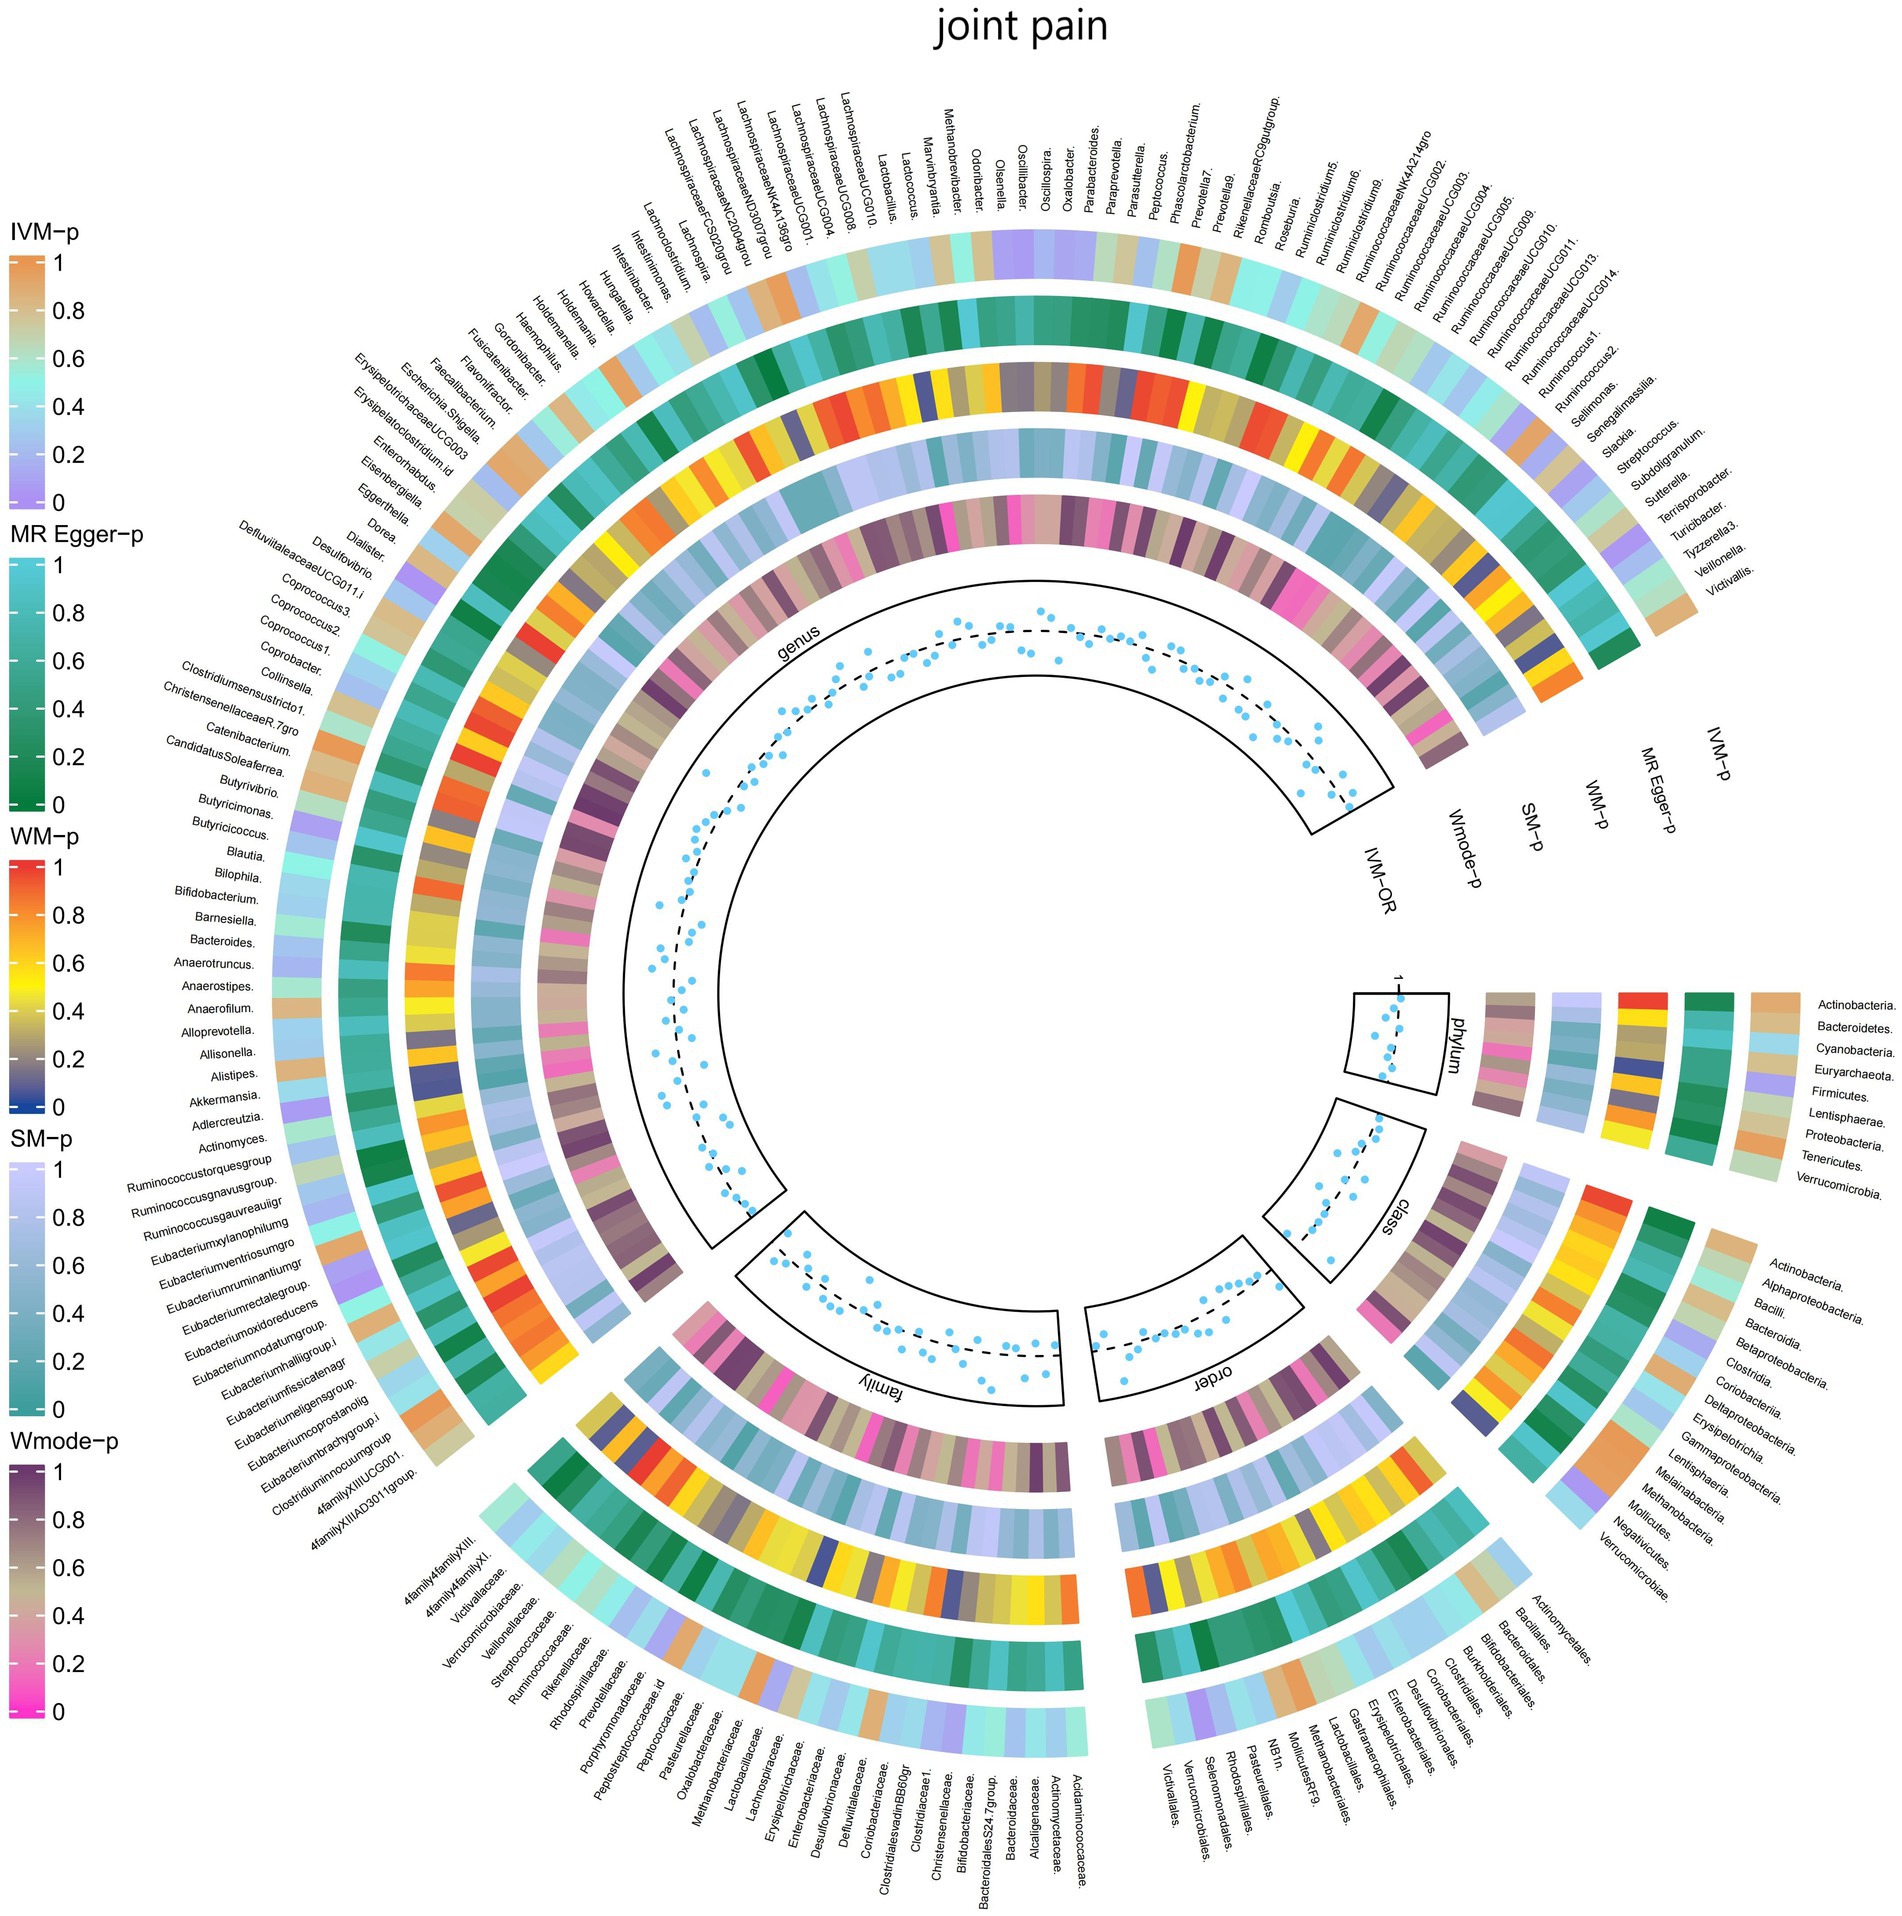
Figure 10. Causal effect of the gut microbiome on joint pain (FinnGen Biobank) on MR analyses. From outside to inside, the p-values of IVW, MR Egger, WM, SM, and Wmode represented, respectively. IVW, inverse variance weighted; WM, weighted median; SM, simple mode; Wmode weighted mode.
3.2.10 FibromyalgiaThe IVW test results revealed significant associations between genetically predicted relative abundance of certain bacterial taxa and the risk of Fibromyalgia. The estimates, presented as OR with corresponding 95%CI, were as follows:
• Genus.Butyricicoccus: OR = 0.637, 95% CI: 0.899 0.452, p = 0.01;
• Genus.Erysipelatoclostridium.id: OR = 0.735, 95% CI: 0.968 0.558, p = 0.029.
These findings suggest a negative association between genetically influenced abundance of these bacterial taxa and the risk of Fibromyalgia. On the other hand, the genetic predisposition to Fibromyalgia was positively associated with the relative abundance of the following taxa:
• Family.Rhodospirillaceae: OR = 1.248, 95% CI: 1.552 1.003, p = 0.047;
• Class.Alphaproteobacteria: OR = 1.451, 95% CI: 1.943 1.084, p = 0.012;
• Genus.RuminococcaceaeUCG005: OR = 1.396, 95% CI: 1.781 1.095, p = 0.007;
• Genus.Eggerthella: OR = 1.337, 95% CI: 1.653 1.081, p = 0.007.
Furthermore, Figure 11 and Supplementary Table S17 provided evidence of the causal effects of 196 gut microbiomes on the occurrence of Fibromyalgia.
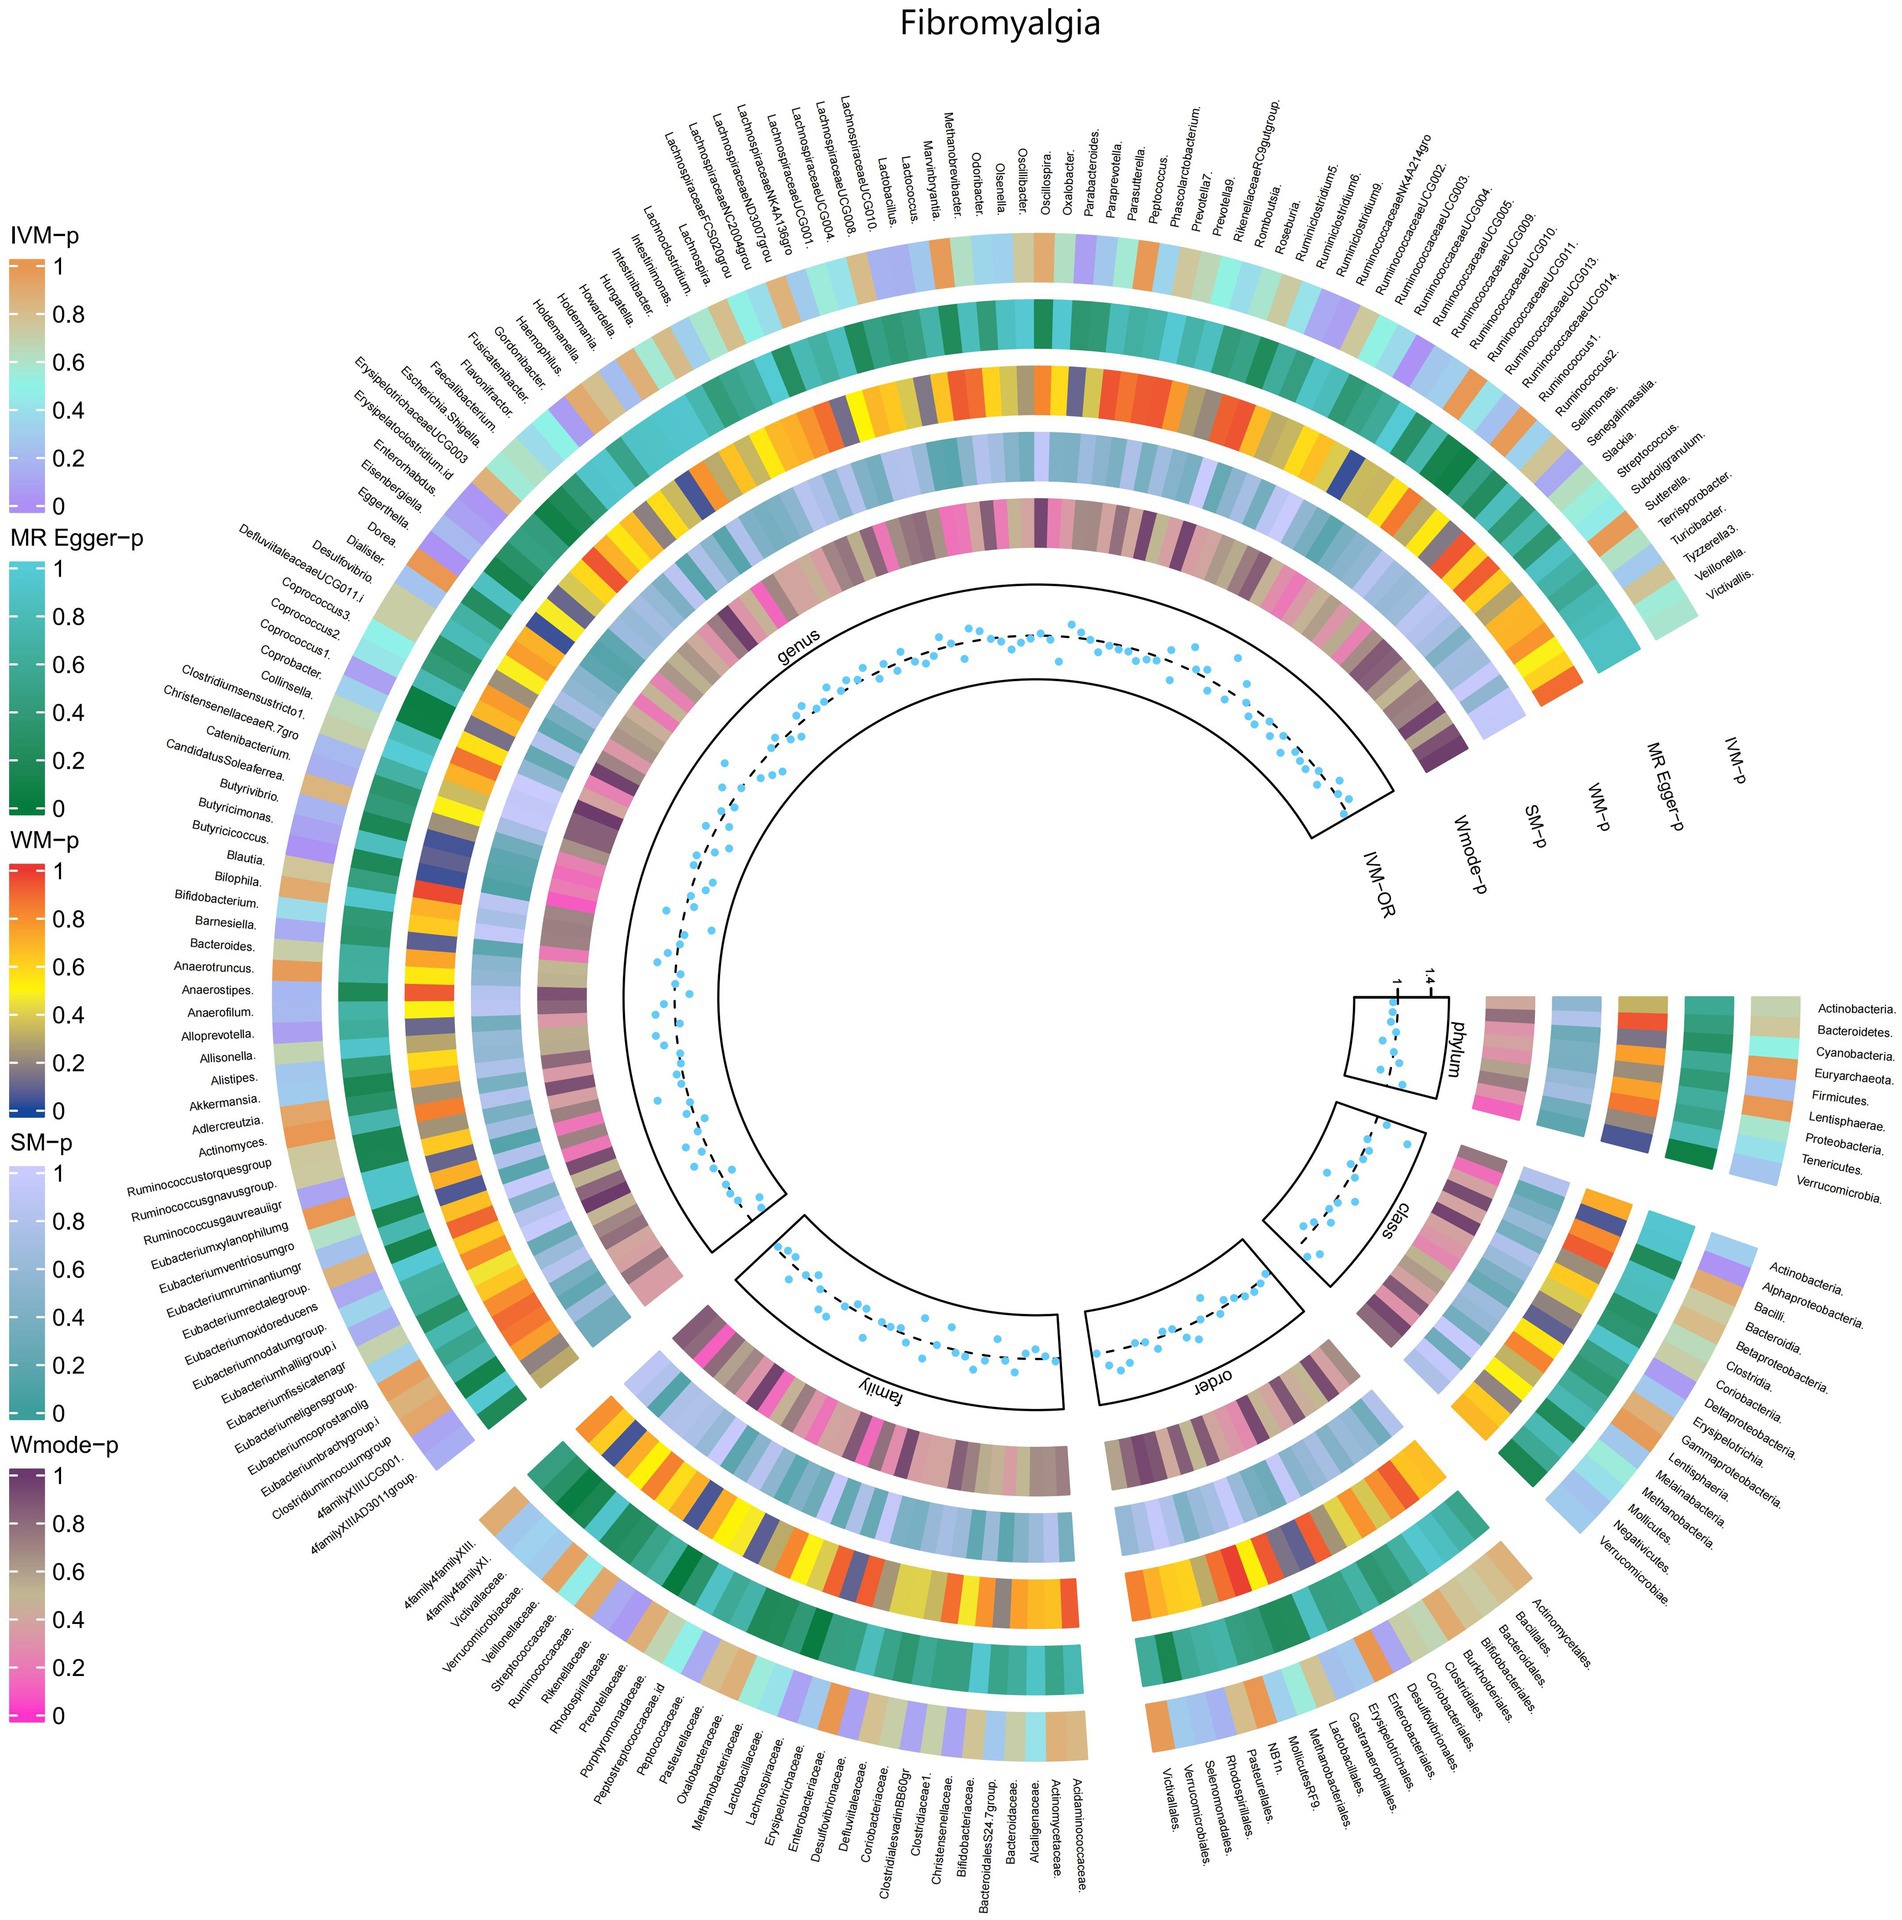
Figure 11. Causal efect of the gut microbiome on Fibromyalgia (FinnGen Biobank) on MR analyses. From outside to inside, the p-values of IVW, MR Egger, WM, SM, and Wmode represented, respectively. IVW, inverse variance weighted; WM, weighted median; SM, simple mode; Wmode weighted mode.
3.2.11 Pain in thoracic spineThe results of the IVW test revealed significant associations between genetically predicted relative abundance of specific bacterial taxa and the risk of Pain in thoracic spine. The estimates, presented as OR with corresponding 95%CI, were as follows:
• Genus.Lachnospira: OR = 0.698, 95% CI: 0.952 0.511, p = 0.023;
• Genus.Eubacteriumbrachygroup: OR = 0.873, 95% CI: 0.989 0.771, p = 0.032.
These findings suggest a negative association between genetically influenced abundance of these bacterial taxa and the risk of Pain in thoracic spine. Conversely, the genetic predisposition to Pain in thoracic spine was positively associated with the relative abundance of the following taxa:
• Family.ClostridialesvadinBB60gr: OR = 1.279, 95% CI: 1.495 1.095, p = 0.002;
• Order.Bacteroidales: OR = 1.412, 95% CI: 1.761 1.132, p = 0.002;
• Phylum.Bacteroidetes: OR = 1.309, 95% CI: 1.712 1.001, p = 0.049;
• Class.Bacteroidia: OR = 1.412, 95% CI: 1.761 1.132, p = 0.002;
• Genus.Alistipes: OR = 1.292, 95% CI: 1.657 1.008, p = 0.043;
• Genus.Butyricimonas: OR = 1.193, 95% CI: 1.404 1.013, p = 0.034.
Moreover, Figure 12 and Supplementary Table S18 provided evidence of the causal effects of 196 gut microbiomes on the occurrence of Pain in thoracic spine.
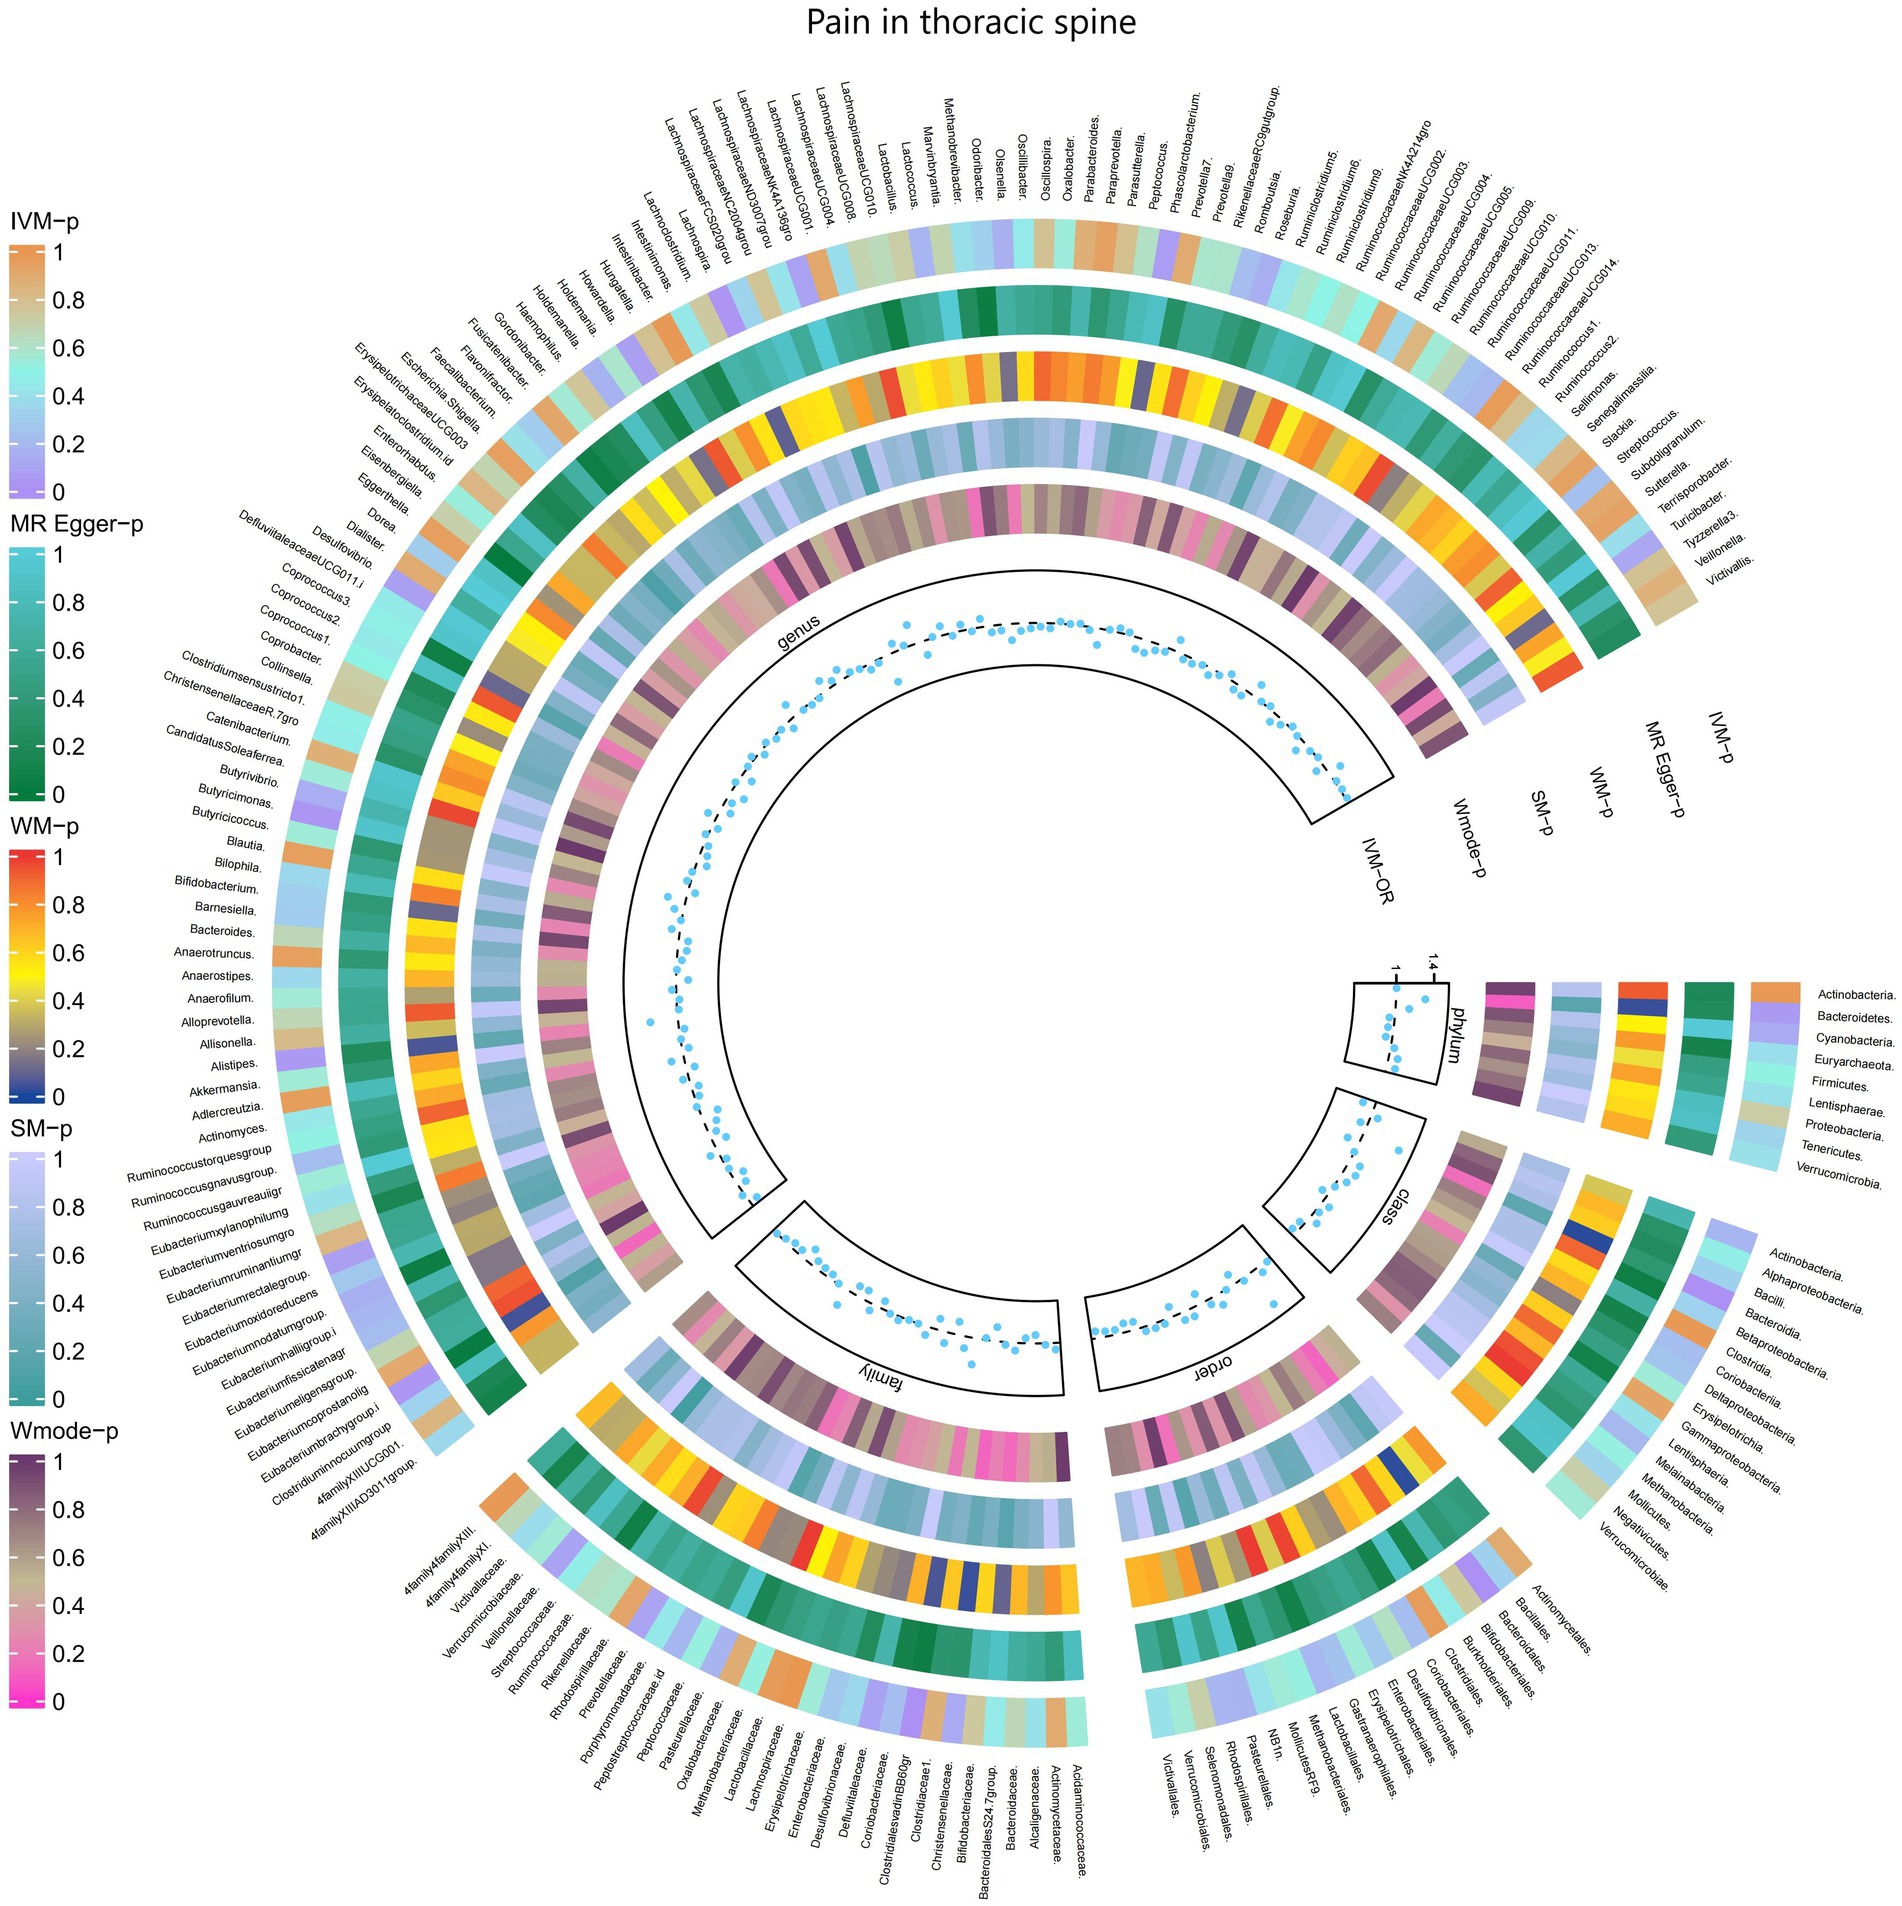
Figure 12. Causal effect of the gut microbiome on Pain in thoracic spine (FinnGen Biobank) on MR analyses. From outside to inside, the p-values of IVW, MR Egger, WM, SM, and Wmode represented, respectively. IVW, inverse variance weighted; WM, weighted median; SM, simple mode; Wmode weighted mode.
3.2.12 Pain (limb, back, neck, head abdominally)The results obtained from the IVW test demonstrated significant associations between genetically predicted relative abundance of specific bacterial taxa and the risk of Pain (limb, back, neck, head abdominally). The estimates, expressed as OR with corresponding 95%CI, were as follows:
• Phylum.Firmicutes: OR = 0.936, 95% CI: 0.984 0.89, p = 0.01;
• Class.Clostridia: OR = 0.925, 95% CI: 0.97 0.881, p = 0.001;
• Class.Gammaproteobacteria: OR = 0.935, 95% CI: 0.994 0.88, p = 0.031;
• Class.Verrucomicrobiae: OR = 0.947, 95% CI: 1 0.897, p = 0.048;
• Family.Bifidobacteriaceae: OR = 0.949, 95% CI: 0.99 0.91, p = 0.014;
• Family.Porphyromonadaceae: OR = 0.915, 95% CI: 0.982 0.853, p = 0.013;
• Family.Verrucomicrobiaceae: OR = 0.947, 95% CI: 1 0.897, p = 0.048;
• Order.Bifidobacteriales: OR = 0.949, 95% CI: 0.99 0.91, p = 0.014;
• Order.Clostridiales: OR = 0.922, 95% CI: 0.968 0.877, p = 0.001;
• Order.Verrucomicrobiales: OR = 0.947, 95% CI: 1 0.897, p = 0.048;
• Genus.LachnospiraceaeNK4A136gro: OR = 0.947, 95% CI: 0.993 0.903, p = 0.026;
• Genus.Olsenella: OR = 0.965, 95% CI: 0.996 0.936, p = 0.026;
• Genus.Oscillibacter: OR = 0.962, 95% CI: 0.997 0.929, p = 0.032;
• Genus.RuminococcaceaeUCG011: OR = 0.955, 95% CI: 0.995 0.917, p = 0.027;
• Genus.Ruminococcus1: OR = 0.953, 95% CI: 0.995 0.913, p = 0.027;
• Genus.Akkermansia: OR = 0.947, 95% CI: 0.999 0.897, p = 0.047.
These findings suggest a negative association between genetically influenced abundance of these bacterial taxa and the risk of Pain (limb, back, neck, head abdominally). Conversely, the genetic predisposition to Pain (limb, back, neck, head abdominally) was positively associated with the relative abundance of the following taxa:
• Family.ClostridialesvadinBB60gr: OR = 1.279, 95% CI: 1.495 1.095, p = 0.002;
• Order.Selenomonadales: OR = 1.082, 95% CI: 1.149 1.018, p = 0.012;
• Family.Prevotellaceae: OR = 1.046, 95% CI: 1.087 1.007, p = 0.021;
• Class.Negativicutes: OR = 1.082, 95% CI: 1.149 1.018, p = 0.012;
• Genus.Eubacteriumfissicatenagr: OR = 1.036, 95% CI: 1.072 1.001, p = 0.041.
Moreover, Figure 13 and Supplementary Table S19 provided evidence of the causal effects of 196 gut microbiomes on the occurrence of Pain (limb, back, neck, head abdominally).
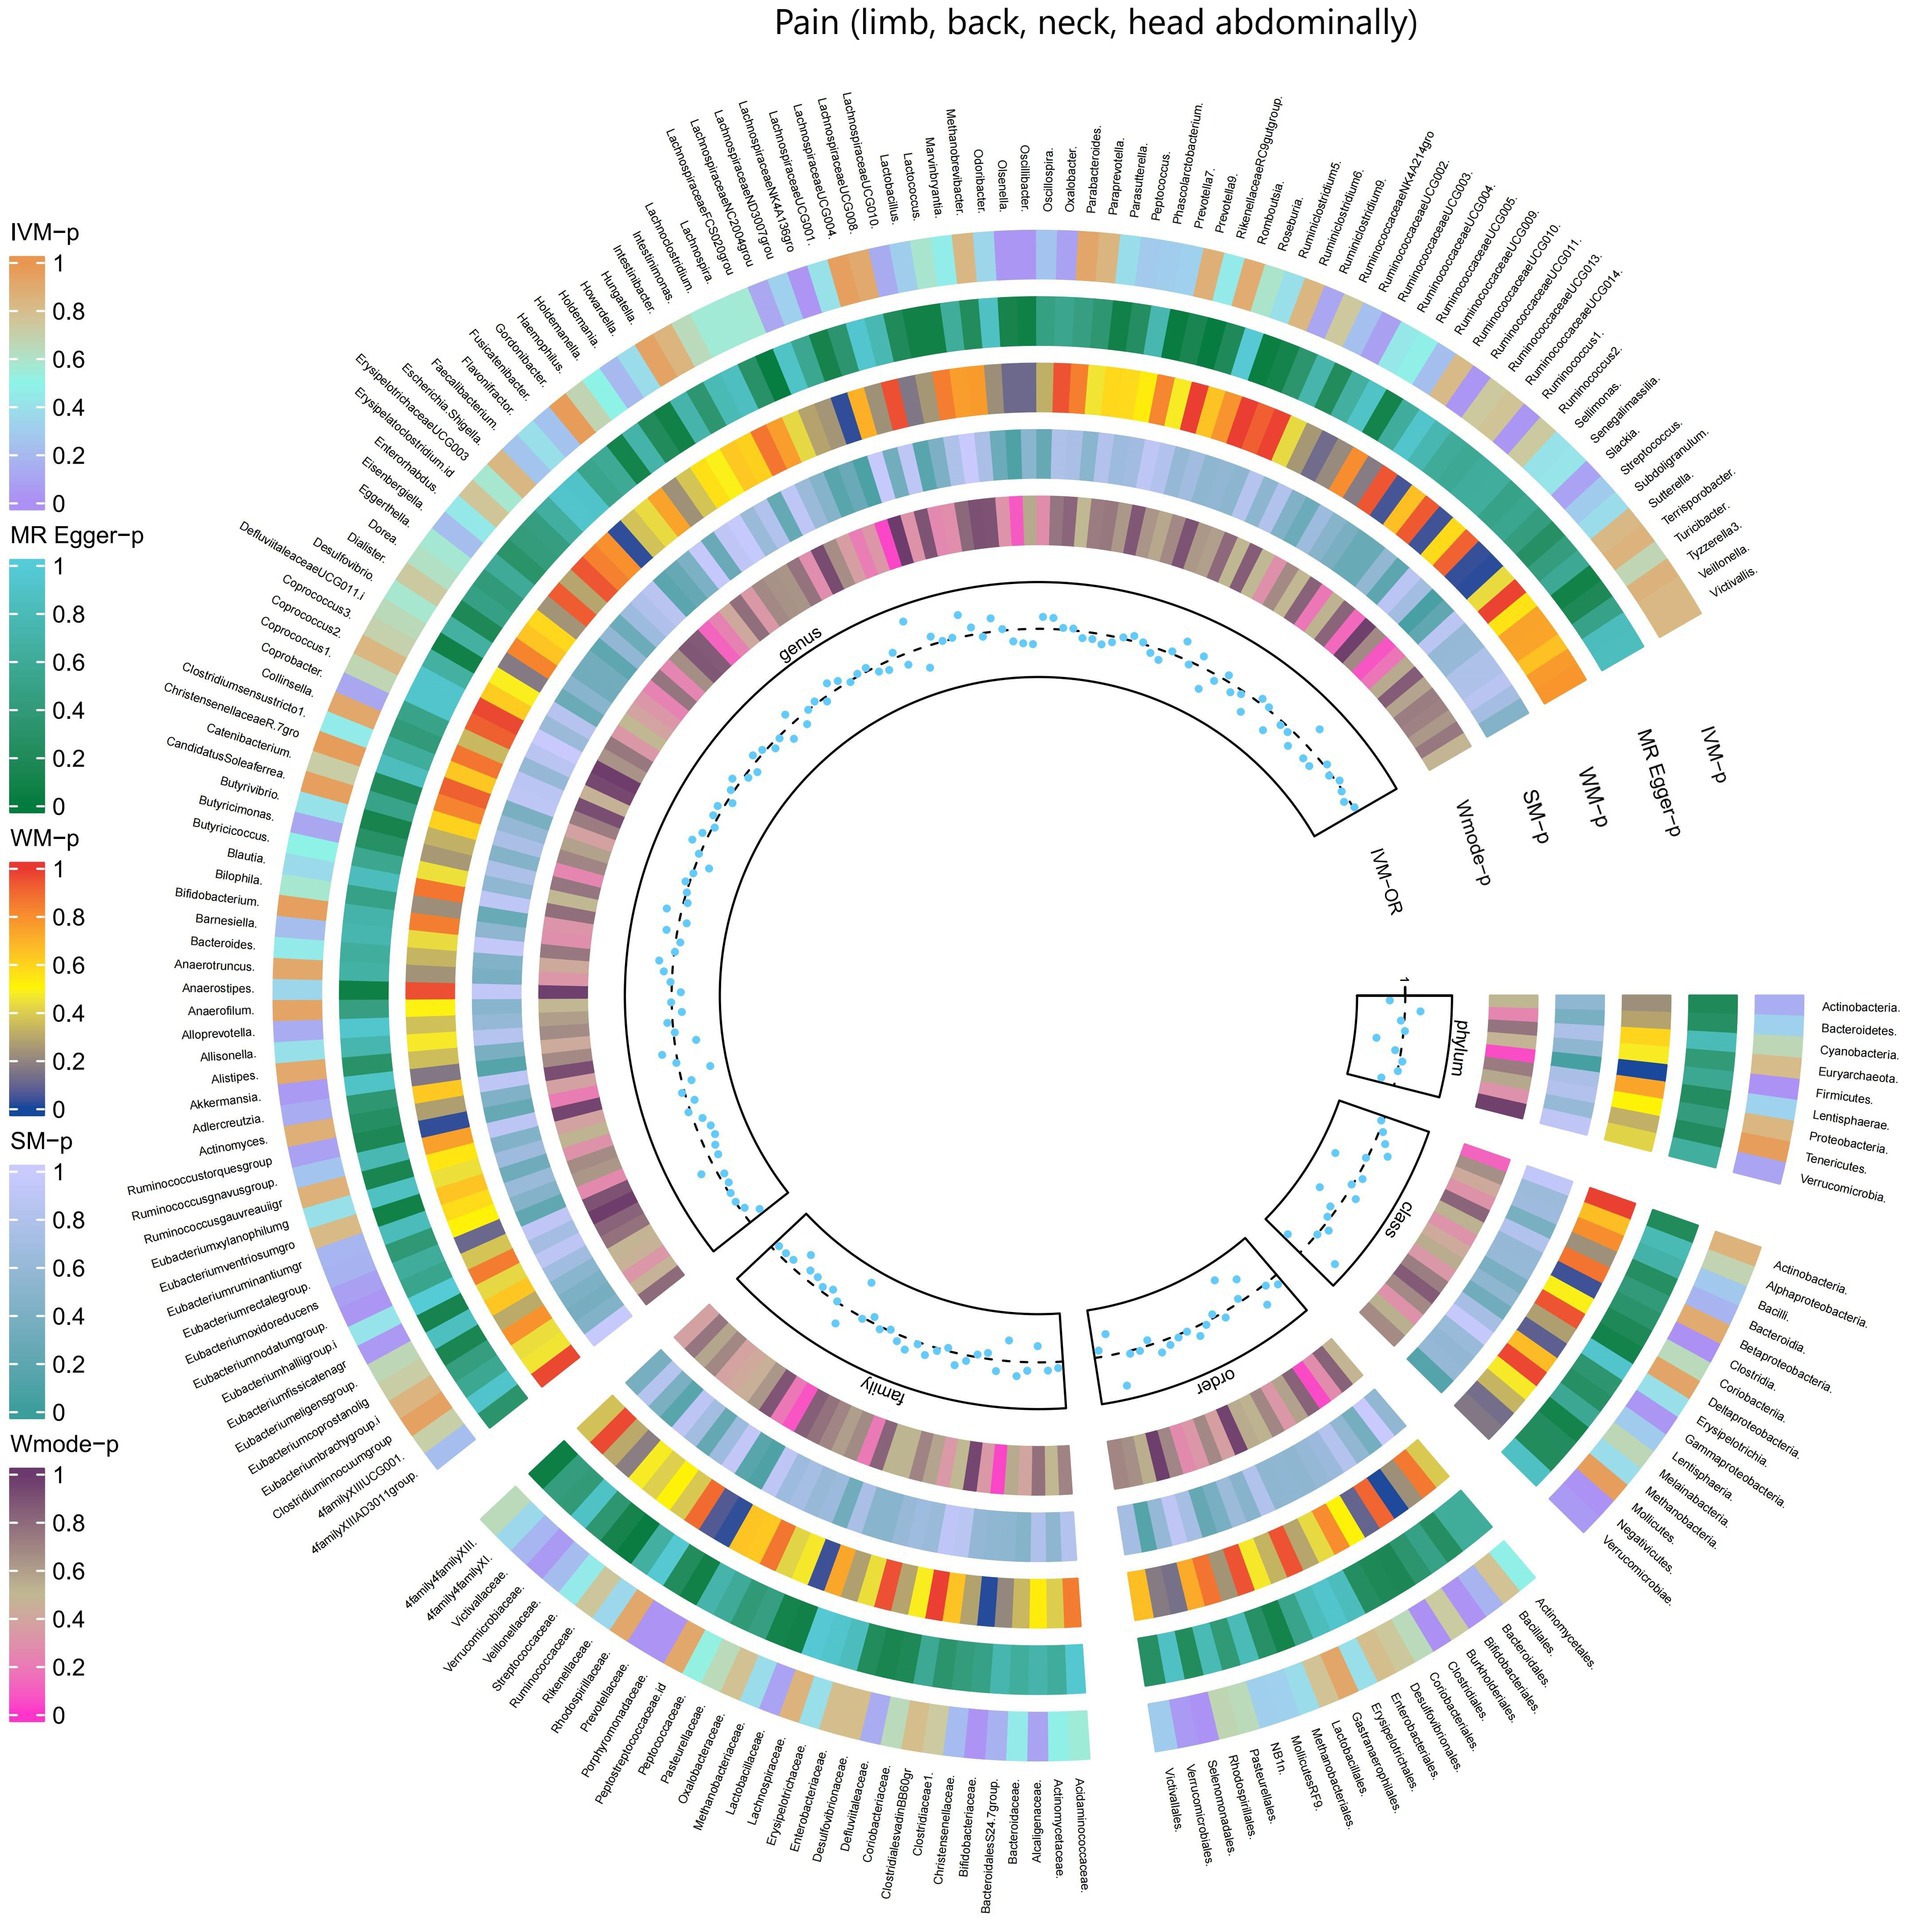
Figure 13. Causal effect of the gut microbiome on Pain (limb, back, neck, head abdominally) (FinnGen Biobank) on MR analyses. From outside to inside, the p-values of IVW, MR Egger, WM, SM, and Wmode represented, respectively. IVW, inverse variance weighted; WM, weighted median; SM, simple mode; Wmode weighted mode.
3.3 The causal associations between gut microbial metabolites and painThe results obtained from the IVW test revealed significant associations between genetically predicted relative abundance of certain gut microbial metabolites and the risk of different types of pain. The estimates, expressed as OR with corresponding 95%CI, were as follows:5-HT: Higher genetically predicted abundance of serotonin was associated with an increased risk of limb pain (OR: 1.293, 95% CI: 1.046 1.135, p = 0.017). Trimethylamino oxide (TMAO): Genetically predicted higher levels of TMAO were found to be a protective factor against atypical facial pain (OR: 0.89, 95% CI: 0.804 0.975, p = 0.013). Glycine: Higher genetically predicted abundance of glycine was associated with an increased risk of limb pain (OR: 1.034, 95% CI: 1.004 1.066, p = 0.027).
However, no significant causal relationship was observed between the remaining six gut microbial metabolites and pain (as indicated in Supplementary Table S5). These findings suggest that serotonin, TMAO, and glycine play distinct roles in pain susceptibility, with serotonin and glycine being positively associated with limb pain risk, and TMAO acting as a protective factor against atypical facial pain.
3.4 Sensitivity analysis, Benjamini–Hochberg corrected test, Steigher test (reverse analysis)No evidence of pleiotropic effects among the selected IVs was found in the MR-Egger analysis (p > 0.05) (Supplementary Table S3). Additionally, Q test from the IVW test indicated no significant heterogeneity in most causal relationships (p > 0.05, Supplementary Tables S4). However, when applying the Benjamini-Hochberg correction test, almost all bacterial traits did not meet the significance threshold, except for the family Bifidobacteriaceae (BH < 0.05) and the order Bifidobacteriales (BH < 0.05), which were validated in the finngen_R9_G6_MIGRAINE dataset. Furthermore, the genus Oxalobacter was found to be associated with an increased risk of low back pain, and this association remained significant even after the Benjamini-Hochberg correction was applied.
4 DiscussionTo our knowledge, this is the first study to investigate whether the gut microbiota is causally associated with chronic pain and we found evidence supporting an association between pain in specific body sites and gut microbiota, such as head, face, neck/shoulder, back, hip, knees, and limbs, and comprehensive chronic pain including Fibromyalgia, joint pain, or generalized chronic pain. We also identified metabolites of gut microbiota that could be potential risk factors for chronic pain (Figure 14). These findings may have important implications for exploring the link between gut microbiota composition and other pain conditions, identifying and isolating bacterial taxa common in general chronic pain and bacterial taxa with specific diagnoses.
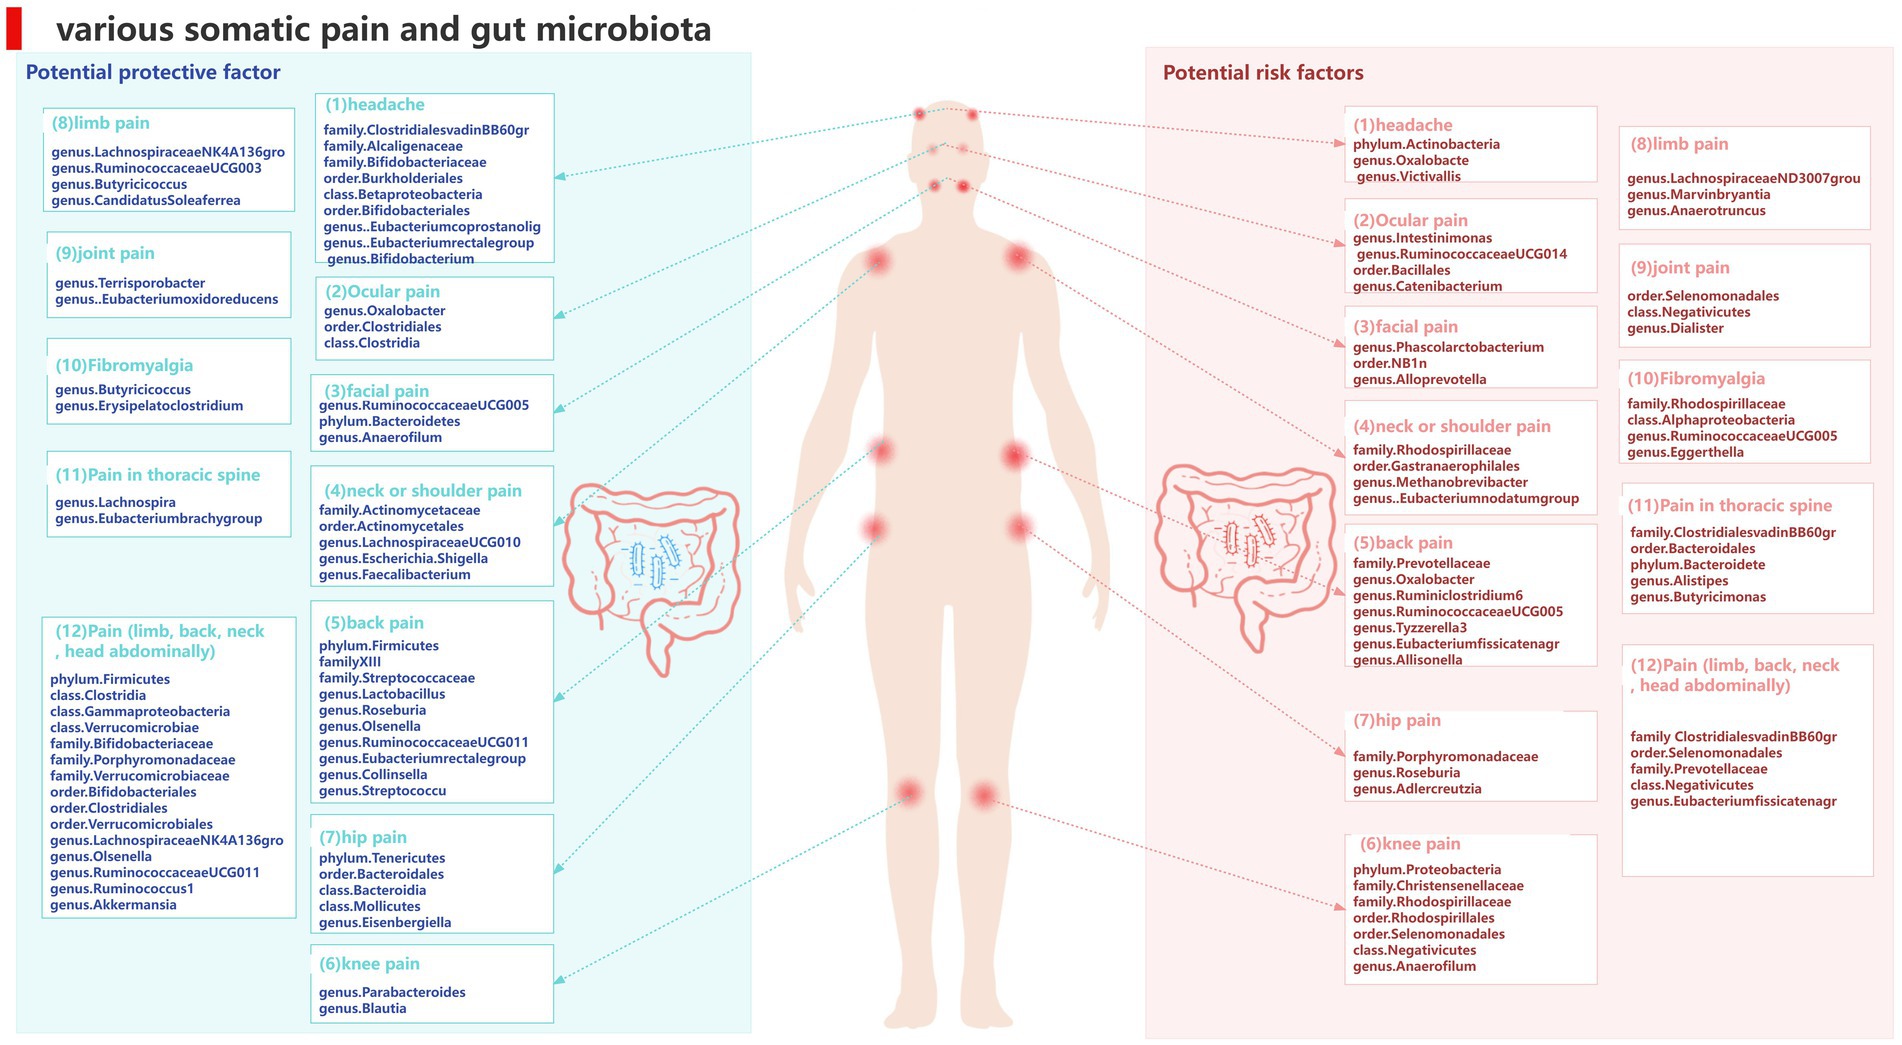
Figure 14. Causal links between gut microbiota and pain at 12 specific sites.
More and more research findings have provided possible biological explanations for the role of gut microbiota in chronic pain (Raja et al., 2020). Gut microbiota is involved in the production of spinal cord cytokines in inflammatory pain (Amaral et al., 2008; Cohen et al., 2021). Neuronal-immune interactions (Liu et al., 2012; Shahi et al., 2017; Eccleston et al., 2021). Regulation of microglial cell activity (Erny et al., 2015, 2017; Erny and Prinz, 2020). In various mechanistic studies, bacterial metabolic end products secreted into the circulation, such as short-chain fatty acids (SCFAs) (Zhou et al., 2021) and Trimethylamino oxide (TMAO) (Koeth et al., 2013), have been shown to play a role in the generation and transmission of pain by significantly inducing oxidative stress and reducing anti-inflammatory factor levels. Interestingly, vitamin D has been found to maintain intestinal barrier integrity, suggesting a potential synergistic effect with butyrates (Murdaca et al., 2021). Additionally, SCFAs and vitamin D together enhance the synthesis of host defense peptides (HDPs), which are crucial components of the innate immune system with antimicrobial and immune-regulatory functions. This discovery opens new directions for research into the possible synergistic effects of SCFAs and vitamin D in pain mechanisms (Robinson et al., 2018).
Gut microbiota can also regulate the levels of some neurotransmitters or neuromodulators, such as GABA (Patti et al., 2012; Du et al., 2017) and serotonin (5-HT) (Yano et al., 2015), to affect neuronal function. Therefore, we not only consider the causal relationship between gut microbiota and chronic pain but also take into account the involvement of gut microbiota metabolites. We selected 9 metabolites available in the database, including 3-hydroxybutyrate (BHBA), tryptophan, tyrosine, phenylalanine, glutamate, glycine, propionic acid, TMAO, and 5-HT. In our study, 5-HT and glycine were associated with a higher risk of limb pain, while TMAO was found to be a protective factor for atypical facial pain. This is inconsistent with current research directions. In peripheral tissues, 5-HT functions as a mediator of pain and may have specific effects in various types of headaches (Cortes-Altamirano et al., 2018). However, our causal inference analysis did not provide strong evidence for a causal relationship between 5-HT and headaches, and this mechanism of pathogenesis requires further validation. At the same time, our research findings strengthen and expand existing observational evidence, indicating that gut microbiota can influence the outcomes of chronic pain (Figure 15).
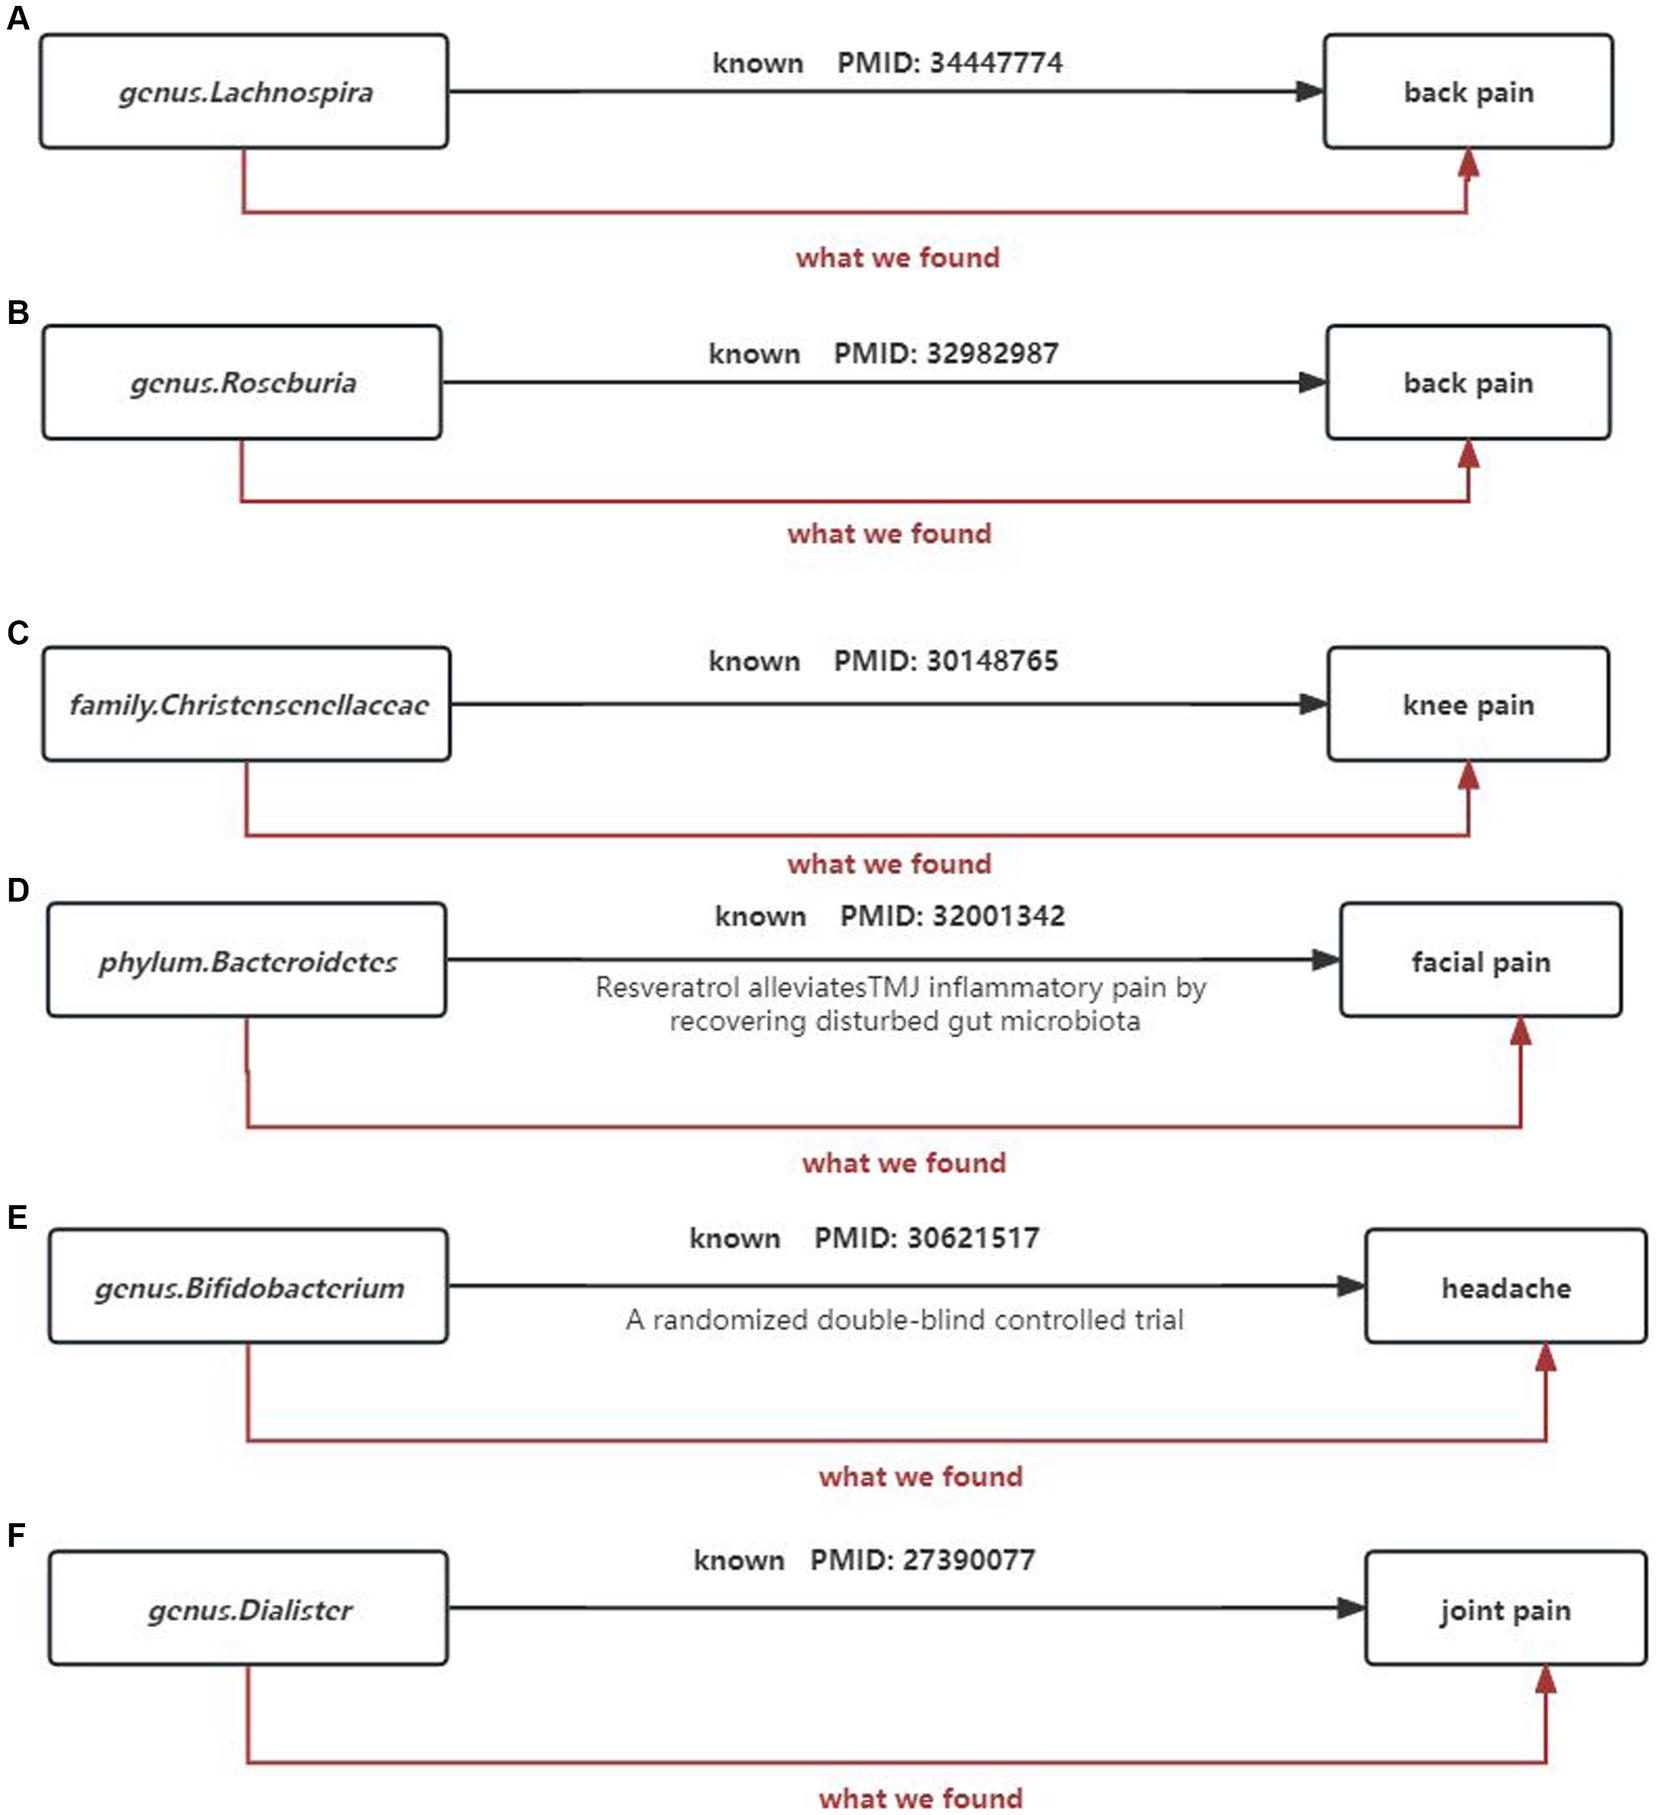
Figure 15. Summary of the main findings in the univariate MR Study. Combined with the available evidence, we consistently found causal eff
留言 (0)