
記住我


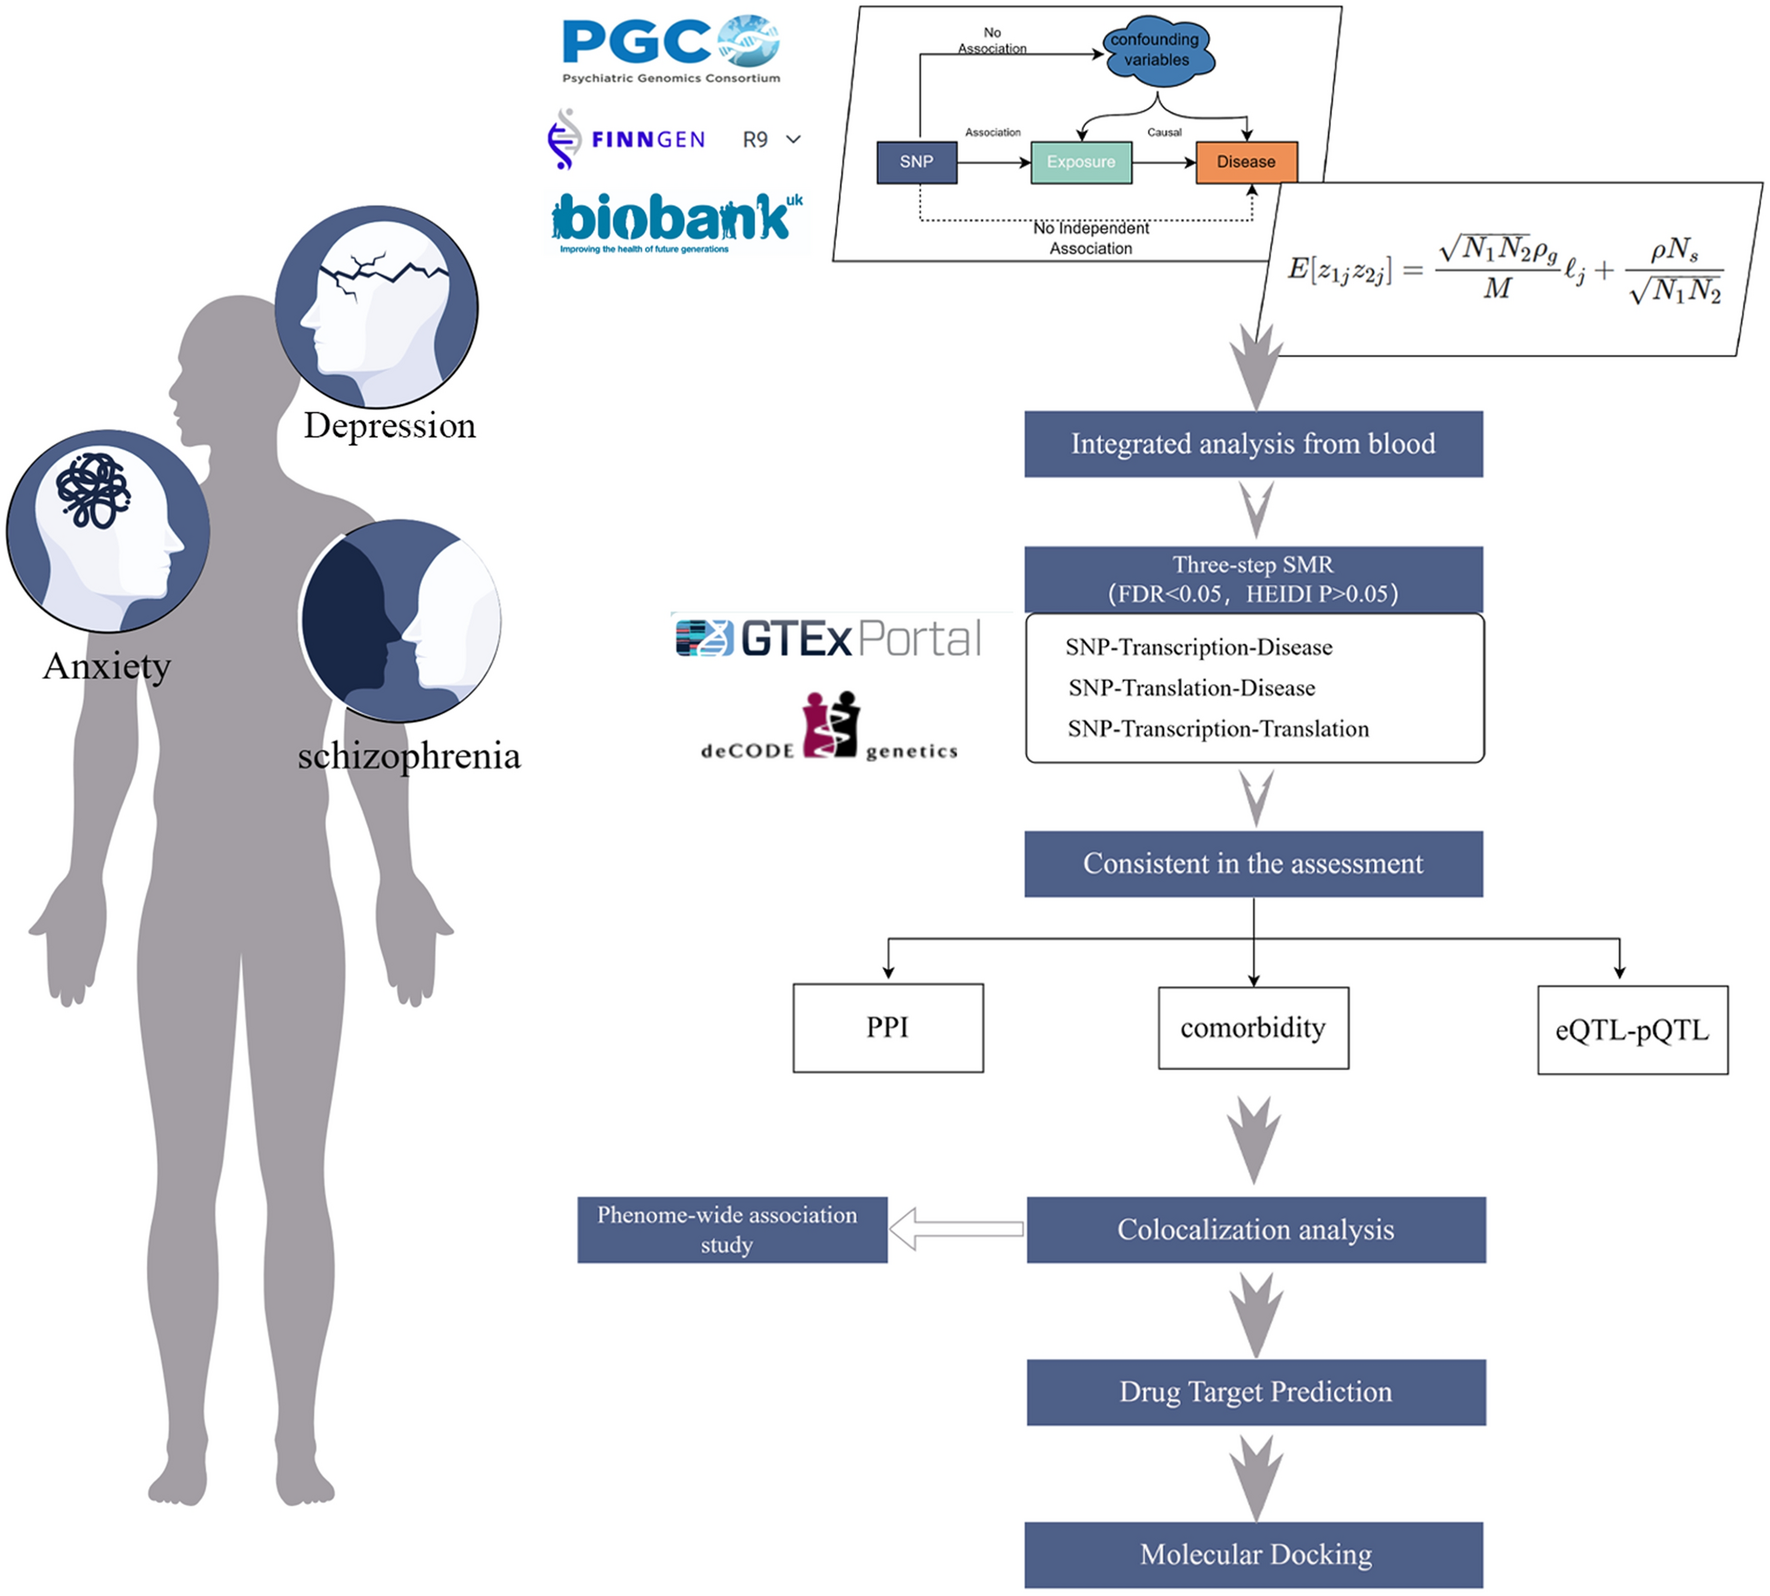
The study process involved a sequential flow, as depicted in Fig. 1. It encompassed the formulation of clinical concerns, screening of clinical data, acquisition of medical images, segmentation of regions of interest (ROI), feature engineering, model building, and evaluation [23].
Fig. 1
Flow chart of the study design
Some of the elements in Fig. 1 (eyes, syringes, crowd) are from Servier Medical Art (http://smart.servier.com/), licensed under a Creative Common Attribution 3.0 Generic License.
A total of 113 eyes from 82 patients were included. Participant characteristics are summarised in Table 1. Among the 82 participants, 26 (31.71%) were women, 31 (37.80%) had both eyes included, mean age was 54 years (SD = 10), and mean glycated hemoglobin (HbA1c) level was 7.60% (SD = 1.28). Of the 113 eyes, 58 (51.33%) were right eyes. Mean initial CST was 478 μm (SD = 172), and mean interval between first and third treatments was 98.17 days (SD = 44.57). Table S1 illustrates the distribution of the initial three medication types (three individual drugs or a combination) among the total of 113 eyes, notably, no significant differences were observed, either between the training and test sets (P = 0.56) or within the NPDME and PDME subgroups (P = 0.64).
Table 1 Baseline demographic and clinical characteristics of the sample includedDevelopment of an OCT-based radiomics classification model and its clinical implicationsAmong the 113 eyes, 75 had NPDME, and 38 had PDME. Figure 2 shows typical cases and OCT data from eyes with each type. 79 eyes were in the training set, and 34 in the test set.
Fig. 2
Images and ROI segmentation schematics of representative NPDME and PDME cases. (a) Representative NPDME case: 48-year-old woman with left eye involvement, initial CST of 842 μm, and baseline BCVA of counting fingers. After the receipt of three anti-VEGF treatments over 71 days, the CST substantially decreased to 141 μm and BCVA improved to 20/200. (b) Representative PDME case: 57-year-old man with right eye involvement, initial CST of 347 μm, and baseline BCVA of 20/40 (comparatively better than representative NPDME case). However, after the receipt of three anti-VEGF treatments over 90 days, the CST substantially increased to 639 μm and the BCVA decreased to 20/80. (c, d). Schematics illustrating the ROI segmentation procedure based on initial pretreatment OCT images for the two cases described above (a and b); the ROI comprises the region from the inner limiting membrane to the external limiting membrane
In total 837 OCT-omics features were extracted from each eye. Within the training set, a screening process was conducted to refine the feature set. Initially, 775 features were screened according to ICC. Subsequently, 173 features were screened using the Mann-Whitney U test. From this combined set of selected features, along with the incorporation of 4 dummy variables representing drug types, a logistic regression model was constructed using the recursive feature elimination method (Table S2). The model included 11 key features, with the following equation: Y = 1.659 + 3.214 * original_glszm_ZoneEntropy – 1.313 * wavelet-LHL_glcm_ClusterShade + 2.542 * wavelet-LHL_glrlm_RunEntropy – 2.92 * wavelet-LHH_glcm_MaximumProbability + 1.146 * wavelet-LHH_gldm_DependenceVariance + 2.239 * wavelet-LHH_gldm_LargeDependenceHighGreyLevelEmphasis + 4.135 * wavelet-HLL_glrlm_RunLengthNonUniformityNormalised – 1.645 * wavelet-HLH_firstorder_Maximum + 2.751 * wavelet-HLH_firstorder_Uniformity – 1.806 * wavelet-HHL_gldm_LargeDependenceLowGreyLevelEmphasis + 1.677 * wavelet-LLL_glrlm_LongRunHighGreyLevelEmphasis (Fig. 3a). OCT-omics scores were significantly higher in the NPDME group than in the PDME group in both the training and test sets (p < 0.001) (Fig. 3b). OCT-omics scores positively correlated with CST reduction after treatment (R = 0.44, p < 0.001) (Fig. 3c). In both the training and test sets, DCA showed consistently superior net benefit compared with the “Treat none” strategy across all threshold probabilities and outperformed the “Treat all” strategy across a substantial portion of the threshold range, indicating that the OCT-omics score can provide a superior net benefit while minimising unnecessary treatment (Fig. 3d), indicating OCT-omics scores’ value in predicting treatment response in DME patients.
Fig. 3
OCT-omics model evaluation and correlation analysis. (a) Coefficient distribution of the 11 features included in the logistic regression model. (b), Violin plots comparing OCT-omics scores between NPDME and PDME groups in the training and test sets. (c) Scatterplot showing the correlation between OCT-omics score and rate of CST reduction after treatment in the training set. (d) Decision curve analysis curves of the OCT-omics model in the training and test sets
Evaluation of overall performance in multiple modelsThe OCT-omics classification models (logistic, SVM, and BPNN) demonstrated strong discriminative abilities in both the training and test sets. In the training set, the logistic classifier achieved a sensitivity of 0.904 and a specificity of 0.741; the F1 score was 0.887, and the AUC was 0.910. The SVM classifier showed a sensitivity of 0.923 and a specificity of 0.667; the F1 score was 0.881 and the AUC was 0.897. The BPNN classifier exhibited a sensitivity of 0.962 and a specificity of 0.926; the F1 score was 0.962 and the AUC was 0.982. In the test set, the classifiers maintained their discriminative capabilities. The logistic classifier achieved a sensitivity of 0.783 and a specificity of 0.727, with an F1 score of 0.818 and an AUC of 0.905. The SVM classifier showed a sensitivity of 0.826 and a specificity of 0.636, with an F1 score of 0.826 and an AUC of 0.885. The BPNN classifier exhibited a sensitivity of 0.913 and a specificity of 0.636, with an F1 score of 0.875 and an AUC of 0.929.
Table 2 summarises the results, highlighting the robustness and generalisability of the developed OCT-omics classification models. High sensitivity values indicate efficacy in identifying positive cases (NPDME), whereas high specificity values indicate efficacy in identifying negative cases (PDME). F1 scores provide an overall assessment of model performance in terms of balancing specificity and sensitivity. The AUC values highlight discriminative power in distinguishing between PDME and NPDME subgroups according to OCT-omics features. Figure 4 visually represents the model performance through confusion matrices and ROC plots, providing an intuitive understanding of classifier performance and further supporting their discriminative ability.
In summary, the OCT-omics classification models exhibit robust performance and hold potential clinical implications. These findings establish OCT-omics as a non-invasive tool for predicting individualised treatment responses and assessing retinal pathologies, laying the foundation for future research in this area.
Table 2 Performances of predictive models in terms of treatment responses in patients with DMEFig. 4
Classification performances of logistic, SVM, and BPNN models in training and test sets. (a). Confusion matrices for logistic, SVM, and BPNN models in the training set. (b) ROC curves for logistic, SVM, and BPNN models in the training set. (c) Confusion matrices for logistic, SVM, and BPNN models in the test set. (d) ROC curves for logistic, SVM, and BPNN models in the test set
Clinical implications of the pretreatment OCT-omics prediction modelFigure 5 illustrates the typical case with long-term anti-VEGF intravitreal treatment outcomes and predictions based on the OCT-omics model. The patient, a 55-year-old woman, underwent evaluation using the OCT-omics prediction model developed in this study.
Figure 5a shows the long-term status of the patient’s right eye. The initial CST was 697 μm, and the OCT-omics score assigned by the prediction model was − 1.27. The SVM model predicted a 41% probability for NPDME, while the BPNN model predicted a 21% probability for NPDME. Subsequent treatments did not lead to significant improvement in DME, as indicated by persistently high CST values: 731 μm after three treatments, 557 μm after six treatments, and 599 μm after 14 treatments. Figure 5b shows the long-term status of the patient’s left eye. The initial CST was 755 μm, and the OCT-omics score assigned by the prediction model was 1.79. The SVM model predicted a 69% probability for NPDME, while the BPNN model predicted an 88% probability for NPDME. This eye displayed a more favourable response to subsequent treatments; CST gradually decreased to 339 μm after three treatments, 274 μm after six treatments, and 317 μm after 14 treatments.
These retrospective findings highlight the predictive power of the pretreatment OCT-omics model in assessing the long-term prognosis of DME. The OCT-omics model provides valuable insights into potential treatment responses and disease progression in individual patients. It holds promise as a valuable tool for clinicians to make informed decisions and tailor treatment strategies for patients with DME.
Fig. 5
Retrospective follow-up of a patient with DME in both eyes after anti-VEGF treatment. (a) Long-term status of DME in the right eye. (b) Long-term status of DME in the left eye
DiscussionIn this study, we introduced the concept of OCT-omics, which combines OCT with radiomics analysis to improve the overall understanding of inner retinal layers in DME. By exploring the predictive capabilities of the OCT-omics classification model in assessing the response to anti-VEGF treatment in DME patients, it provides a comprehensive and quantitative evaluation of retinal pathology, offering a promising paradigm for precise and personalized management strategies.
The advent of anti-VEGF therapy significantly transformed the treatment landscape for DME. However, challenges such as safety concerns related to repeated injections, high costs, and variable treatment responses remain [8]. PDME rates ranging from 23% to 40% in various studies [24, 25]. In our study, PDME eyes constituted 33.63% of all cases, which is in line with previous reports. Due to the lack of a consensus on the definition and optimal management of PDME [14, 15], treatment strategies such as monthly or three loading doses, pro re nata (PRN), and treat and extend (T&E) are widely used [26, 27]. In our research, we explored PDME based on the completion of three anti-VEGF injections, consistent with current clinical practice. Additionally, we used the dynamic thresholds for PDME assessment based on the initial CST, providing a novel objective metric for evaluation of treatment response. These exploratory approaches will advance DME management and lay the foundation for further investigations. Previous studies have indicated that early initiation of anti-VEGF therapy and favorable treatment response are associated with better long-term outcomes [28]. Although our cross-sectional study did not include long-term follow-up data, we observed consistent treatment outcomes in some patients with long-term PDME who received anti-VEGF therapy. Further studies with larger sample sizes and longer follow-up periods will provide valuable insights into the long-term outcomes of patients with DME and the potential applications of our proposed method in clinical practice.
OCT has revolutionised DME management and research by providing a high-resolution, non-invasive, and rapid imaging modality [29]. Various OCT-based DME classification approaches, such as the “SAVE” classification [30] and “TCED-HFV” grading protocol [31] have been developed to quantitatively analyse changes in retinal structure, providing valuable insights for clinical decision-making. However, there remains a substantial gap in establishing consensus and guidelines for reliably predicting treatment outcomes using OCT parameters [32] Previous studies have explored various quantitative parameters, such as DRIL and ellipsoid zone/external limiting membrane integrity, as potential predictors of DME treatment response [14, 33]. However, most studies of DRIL have been qualitative (presence or absence) or semi-quantitative (measuring absolute length or proportion), limiting their predictive power [12]. In the present study, OCT-omics as a novel quantitative analysis approach that utilises deeper features from OCT images of the retina, facilitating the transition from visual interpretation to data-driven analysis. There is a need to establish standardised image processing and feature screening protocols, as well as more interpretable and clinically applicable OCT-omics models, to further advance the field of DME research and management.
Machine learning proves to be an effective tool in addressing complex classification problems encountered in the screening, diagnosis, and categorization of patients with DME [34]. Previous studies have predominantly focused on demographic indicators, laboratory tests, and established OCT parameters to predict DME treatment efficacy [35]. In contrast, the present study combines OCT-omics with machine learning, enabling the integration of comprehensive quantitative predictive indicators. The robustness of this approach is demonstrated by its performance evaluation metrics. Future research may involve further expansion of the training dataset, exploration of techniques such as automatic segmentation based on deep learning to improve feature extraction, and utilisation of other emerging technologies to enhance the precision and individualisation of DME management.
It is crucial to acknowledge the limitations of this study, particularly its retrospective nature and reliance on single-center data. The inherent biases such as selection bias, incomplete data, and potential confounding variables, can affect the generalizability of results to broader populations or diverse healthcare settings. However, despite these limitations, the study’s strengths, notably as the inaugural exploration of OCT-omics in assessing DME, offer significant insights into pioneering a novel research methodology for clinical decision-making. Moving forward, prospective studies encompassing larger cohorts and a comprehensive exploration of various ROI layers (outer retinal layer, whole retinal layer, choroidal layer) are imperative to validate and build upon these initial findings. On the basis of our proposed OCT-omics methodology, there is a pressing need for multicenter, large-sample, prospective studies with nuanced subgroup analyses at diverse levels, encompassing different demographics, medications, and other variables. These efforts are pivotal for steering towards a more evidence-based approach in understanding and managing DME.
ConclusionsIn conclusion, this study introduces a pioneering methodology, OCT-omics, which integrates OCT imaging with radiomics analysis to comprehensively assess DME. The developed radiomics model demonstrates promising predictive capabilities in evaluating treatment responses and propels future research paradigm for individualized DME management.
留言 (0)