
記住我


KEY POINTS
Question: We aimed to analyze the effects of albumin on plasma volume in critically ill patients by assessing their hemoglobin before and after albumin administration.
Findings: This retrospective study included over 20,000 patients and showed a significant decrease in hemoglobin levels of over 8 g/L upon administration of 25 g albumin in 500 mL. This effect lasted for at least 12 hours and was also observable in patients with septic shock.
Meaning: Albumin is given more liberally in intensive care and has a significant and long-lasting effect on volume management.
The administration of albumin in critically ill patients has been a controversial topic for many decades (1–5). Although this abundant protein and key player in microvascular fluid exchange may have gained popularity in recent years, a lot of reservations concerning its use remain (6–11). This may partially be due to a lack of full therapeutic understanding about when to use albumin (12,13).
In the early 2000s, albumin was regarded as a potentially harmful blood product (14). The Saline Versus Albumin Fluid Evaluation trial of 2004, which compared the effect of 4% albumin and normal saline, concluded that albumin is not more harmful than normal saline (15). A revised clinical standard of equivalence between albumin and saline for volume resuscitation in critically ill patients was subsequently established (16,17). In the 2014 Albumin Italian Outcome Sepsis (ALBIOS) trial (18), which was the first randomized controlled trial investigating albumin in septic shock, no harm was observed compared to using crystalloid solutions alone. In fact, the albumin group showed small hemodynamic advantages. A post hoc analysis revealed a significant reduction in 90-day mortality for the most severe patients (19). According to a meta-analysis in patients with severe sepsis and septic shock the use of albumin demonstrated a significant reduction in 90-day mortality (20). Hydroxyethyl starch (HES), a synthetic colloid, was found to be more harmful than crystalloids in several studies (21–24), particularly in the 6S trial published in 2012 (25). Thanks to its oncotic properties, albumin causes hemodilution as shown by Hahn and Zdolsek (26). In their study, the administration of 20%-albumin solution in healthy subjects caused a volume expansion of up to 3.4 mL (± 1.2 mL) per infused mL of 20%-albumin solution. Similar effects have been seen in septic, postburn, and in postoperative patients (27–29). This dilution causes a decrease in hemoglobin (Hb) concentration, and the drop can be used to assess the degree of volume expansion caused by albumin administration.
The purpose of this study was to evaluate which patient populations received albumin with other colloids gradually drifting out of the picture, how much they received, and to analyze how this has changed over the course of nine years in a Swiss tertiary ICU. In particular, we wanted to better understand the effect of albumin administration and investigate its role on hemodilution. Two main study objectives were established to test the hypothesis if volume resuscitation with albumin persistently expands plasma volume and potentially unmasks relative anemia, leading to increased RBC use, as compared to giving crystalloid solutions alone:
First, in determining the development of albumin administration from 2013 to 2021, we were interested in determining: 1) how much albumin was administered over the course of a year, and 2) how much of albumin was received by different patient populations based on patient characteristics, diseases, comorbidities, and laboratory values. We wanted to analyze 3) ICU mortality, 30-day mortality, and length of ICU stay between patient subgroups and compare these outcomes between the albumin and the control group from the total cohort of ICU patients in Basel. 4) Fluid resuscitation using HES and crystalloids over the years 2013–2021 was also compared.
The second objective of this study was to evaluate volume expansion in terms of hemoglobin decrease. In this, we attempted to capture volume expansion caused by albumin administration and assess the resulting hemodilution by evaluating the decrease of serum hemoglobin before and after albumin administration as well as the duration of observed hemodilution by using matched control groups with no albumin administration for comparison.
MATERIALS AND METHODS Data Source and CollectionIn this retrospective study, the electronic health records detailing routine clinical data of all admissions to the ICU at the University Hospital Basel, a Swiss tertiary care center, between January 1, 2013, and December 31, 2021, were analyzed. The 2013 start date marks the beginning of digital data recording and includes patient information about general consent to use clinical routine data for retrospective research. Patients who denied consent, spent less than 24 hours in the ICU, or were younger than 18 years of age were excluded from the analysis. A total of 20,927 patient admissions were included, of which 3748 received albumin at least once during their ICU stay.
Study SubjectsICU admissions were assigned either to an albumin or a nonalbumin group depending on whether or not albumin was administered at least once during the ICU stay. A patient could have multiple admissions within the observation period but not within the same hospital stay. Within the albumin group, admissions were further distinguished according to whether hyperoncotic (20 g in 100 mL, 20% albumin) or isooncotic albumin (12.5 g in 250 mL or 25 g in 500 mL, 5% albumin) was given. Therefore, groups receiving albumin were divided into two isooncotic groups, with doses of 12.5 and 25 g, respectively, and a hyperoncotic group (with a dose of 20 g). In the few cases where both solutions were administered, the admission was assigned to the group with the higher number of administrations.
Statistical AnalysisTo address the primary objective, the number of admissions by patient characteristics and year of admission for the albumin and nonalbumin groups were compared using descriptive analysis. To obtain an estimate of the increase in albumin administrations over time, we set up a linear regression model with the number of admissions aggregated by patient characteristics and admission year as outcome and covariate patient characteristics and admission year.
For the volume expansion analysis, data were first visualized graphically to determine the shape of the volume expansion curve. For the analysis, a truncated mean hemoglobin value was calculated at an interval of 10 minutes over all hemoglobin values within a time window of ± 60 minutes. A total of 5% of the lowest and highest percentile hemoglobin measurements were discarded to calculate said truncated mean.
Thereafter, a linear mixed model was performed to assess how hemoglobin values changed after albumin administration. The outcome was defined as the hemoglobin change at follow-up compared to baseline with the covariates follow-up time, time since albumin administration, and a random factor admission identifier to account for multiple measurements of the same admission. Based on the graphical visualization of the volume expansion curve, no transformation of covariates was indicated and the hemoglobin drop was almost constant over time. CIs were obtained by profile-likelihood method. Further information on the methods can be found in the supplement (Detailed methods, https://links.lww.com/CCM/H497).
EthicsThis study was approved by the Ethics Committee of Northwest and Central Switzerland (EKNZ) (BASEC-ID 2022-00181) on February 16, 2021, and was conducted in accordance with the ethical principles stated by the Declaration of Helsinki and consistent with good clinical practice.
RESULTS PatientsFrom January 1, 2013, to December 31, 2021, 22,199 admissions of greater than or equal to 24 hour were assessed by this study. Research consent was denied by 1272 patients, resulting in the inclusion of 20,927 admissions. During the patients’ stay in the ICU, hyperoncotic albumin (albumin 20% solution) was administered at least once to 1342 admissions, whereas isooncotic albumin (albumin 5% solution) was administered to 2406 admissions, resulting in a total of 3478 albumin (17.9%) infusions. Median patient age was 68 years, 64.8% were men, and median length of ICU stay was 49 hours (Table 1).
TABLE 1. - Characteristics and Interventions of Patients Admitted in 2013, 2017, and 2021 With and Without Albumin Administrationa (n = 20,927 cases) Year of Admission 2013 2017 2021 ICU admission Cases, n (%) Albumin 132 (5.1) 408 (16.8) 629 (32.5) No albumin 2476 (94.9) 2027 (83.2) 1306 (67.5) Patients, n (%) Albumin 130 (5.2) 404 (17.4) 620 (33.3) No albumin 2386 (94.8) 1951 (82.6) 1273 (66.7) Length of ICU stay (median [hr], IQR)b Albumin 121 (44–322) 91 (46–234) 97 (48–235) No albumin 47 (37–85) 46 (36–77) 46 (35–80) All 48 (37–90) 49 (38–91) 52 (38–116) Demographicsc Sex, male, n (%) Albumin 68 (51.5) 273 (66.9) 432 (68.7) No albumin 1582 (63.9) 1304 (64.3) 887 (67.9) Age (IQR)b Albumin 67 (56–75) 68 (58–75) 67 (58–75) No albumin 69 (57–77) 68 (57–77) 66 (55–76) All 68 (57–77) 68 (57–77) 67 (56–76) Interventionsc, n (%) Surgical patients Albumin 44 (33.3) 210 (51.5) 339 (53.9) No albumin 896 (36.2) 547 (27.0) 379 (29.0) Transfusion patients Albumin 89 (67.4) 271 (66.4) 368 (58.5) No albumin 561 (22.7) 285 (14.1) 139 (10.6) Renal replacement therapy patients Albumin 29 (22.0) 76 (18.6) 88 (14.0) No albumin 85 (3.4) 49 (2.4) 28 (2.1)IQR = interquartile range.
bValue at admission, rounded to nearest integer; all other values rounded to one decimal place.
cPercentages are in relation to number of all patient admissions who received albumin in that year (respectively, of all admissions who did not receive albumin in that year).
The median Simplified Acute Physiology Score (SAPS)-II was 36 points, and both ICU- and 30-day mortality were higher for patients who received albumin (Table 2). Regarding diseases and comorbidities, the most common was kidney failure (32.1%). Of all included patients, 33.9% were surgical patients, most of whom underwent cardiac surgery. Albumin usage generally increased over the 9-year study period.
TABLE 2. - Mortality and Morbidity of Patients Admitted in 2013, 2017, and 2021 With and Without Albumin Administrationa Year of Admission 2013 2017 2021 Mortality ICU, n (%) Albumin 17 (12.9) 36 (8.8) 62 (9.9) No albumin 81 (3.3) 53 (2.6) 47 (3.6) All 98 (3.8) 89 (3.7) 109 (5.6) 30-d, % (95% CI) Albumin 18.1 (11.3–24.5) 18.6 (14.8–22.3) 22.7 (19.4–25.9) No albumin 9.5 (8.3–10.6) 9.9 (8.6–11.1) 11.5 (9.7–13.2) All 9.9 (8.7–11.0) 11.3 (10.1–12.6) 15.1 (13.5–16.7) Admission scores Simplified Acute Physiology Score II (IQR)b Albumin 41 (22–58) 45 (31–62) 43 (32–57) No albumin 34 (25–46) 34 (26–48) 34 (25–46) All 35 (25–47) 36 (26–51) 37 (27–50) Diseasesc Septic shock, n (%) Albumin 18 (13.6) 67 (16.4) 95 (15.1) No albumin 70 (2.8) 36 (1.8) 20 (1.5) Acute bleeding, n (%) Albumin 21 (15.9) 86 (21.1) 153 (24.3) No albumin 334 (13.5) 292 (14.4) 203 (15.5) Comorbiditiesc Diabetes, n (%) Albumin 40 (30.3) 114 (27.9) 189 (30.1) No albumin 573 (23.1) 535 (26.4) 371 (28.4) Liver cirrhosis, n (%) Albumin 18 (13.6) 23 (5.6) 50 (8.0) No albumin 25 (1.0) 38 (1.9) 38 (2.9) Kidney disease, n (%) Albumin 90 (68.2) 248 (60.8) 303 (48.2) No albumin 601 (24.3) 626 (30.9) 344 (26.3) Hypoalbuminemiad, n (%) Albumin 97 (73.5) 317 (77.7) 464 (73.8) No albumin 1382 (55.8) 1120 (55.3) 667 (51.1) Anemiae, n (%) Albumin 69 (52.3) 235 (57.6) 209 (33.2) No albumin 647 (26.1) 465 (22.9) 197 (15.1) Laboratory values Hemoglobin (median [g/L], IQR)b Albumin 98 (85–110) 97 (86–109) 109 (95–125) No albumin 116 (98–133) 118 (101–134) 128 (111–142)IQR = interquartile range.
bValue at admission, rounded to nearest integer; all other values rounded to one decimal place.
cPercentages are in relation to number of all patient admissions who received albumin in that year (respectively of all admissions who did not receive albumin in that year).
dHypoalbuminemia defined as serum < 30 g/L at admission to ICU.
eAnemia defined as serum hemoglobin < 100 g/L at admission to ICU.
The median age in both the control and albumin groups was 68 years. The median SAPS-II for patients who received albumin was 44 and for the control patients, 36 points. ICU- and 30-day mortality were 10.4% and 21.0% (95% CI, 19.7–22.3) in the albumin group and 2.9% and 9.9% (95% CI, 9.5–10.3) in the nonalbumin group, respectively.
Albumin was administered to 57.8% of all septic shock patients, 25.1% of all acute bleeding patients, and 45.7% of all RBC transfused patients. An overview of all baseline values, diseases, comorbidities, and interventions of every year can be found in the supplement (Additional table 1, https://links.lww.com/CCM/H497).
Yearly Development of Albumin AdministrationOverall, the total number of ICU cases that received albumin between 2013 and 2021 increased from 5.0% to 32.5% (Fig. 1). Similar developments could be observed in patients of the subgroups hypoalbuminemia, kidney failures, and diabetes. For patients with liver cirrhosis, the number of cases who received albumin over the course of 9 years remained around 40%.
 Figure 1.:
 Yearly development of albumin per subgroup. A, Surgical versus nonsurgical patients showing a trend in more albumin administration among surgical patients. B, Within the surgical fields fewer neurosurgical patients received albumin than their other surgical counterparts. C, More patients with comorbidities such as diabetes, hypoalbuminemia, and kidney failure received albumin; an increase of 20.5% in 2013 to 82.6% in 2021 can be observed in septic shock patients; patients with liver cirrhosis remain at around 40%. D, Patients undergoing RBC transfusion increased from 13.7% to 72.6% within the 9-year study period.
Administration in surgical patients increased from 4.7% to 47.2% and in nonsurgical patients from 5.3% to 23.8% only. Heart surgery showed the largest increase from 4% to 53%.
Patients with albumin infusion who received at least one RBC transfusion showed a staggering increase between 2013 to 2021 from 13.7% to 72.6%. The percentage plateaued at around 50% between 2016 and 2018.
The development of HES, crystalloids, and albumin is visualized in Figure 2. It shows the average amount of HES, crystalloids, and albumin administered for every case per year—that includes the patients who did not receive any of said products. The number of patients treated with HES dropped to 0 in 2020. There was nearly a five-fold increase in the number of patients treated with albumin (5.0–32.5% of all patients) (Fig. 1). However, the mean amount of albumin administered per case declined from 99 g to 79 g over the study period. Although the percentage of patients who received crystalloids at least once during their ICU stay increased from 85.5% (2231 of 2608 patients) to 93.8% (1873 of 1995 patients), the median dose of crystalloids administered per case more than halved from 5354 mL to 2206 mL over the study period.
 Figure 2.:
 Yearly development of hydroxyethyl starch (HES), albumin, and crystalloids. Average amount per case of all patients. Although HES has phased out in clinical use, albumin is used in more patients, and on average more albumin is administered per patient per year (5.0–25.8 g). The average amount of crystalloids administered has halved in the study period (6933–3298 mL).
Hemodilution Through Albumin AdministrationA total of 2006 cases (1953 patients) who received albumin were included in this analysis. Included as the nonalbumin controls were 1836 self-matched control cases (1791 patients) and 1886 matched control cases (1834 patients) (Table 3). Concerning SAPS-II, the matched controls had a lower score, and these patients were less likely to receive albumin (Table 2). Concerning sex and age, the groups were not significantly different.
TABLE 3. - Characteristics of Albumin-, Self-Matched Control-, and Matched Control Groups Group Cases (n) Patients (n) Age (Median, IQR) Simplified Acute Physiology Score II (Median, IQR) Length of ICU Stay (Median [hr], IQR) Albumin 2006 1953 67 (38–84) 44 (21–83) 100 (34–768) Self-matched control 1836 1791 68 (38–84) 45 (22–83) 130 (38–917) Matched control 1886 1834 66 (33–85) 39 (18–73) 90 (32–581)IQR = interquartile range.
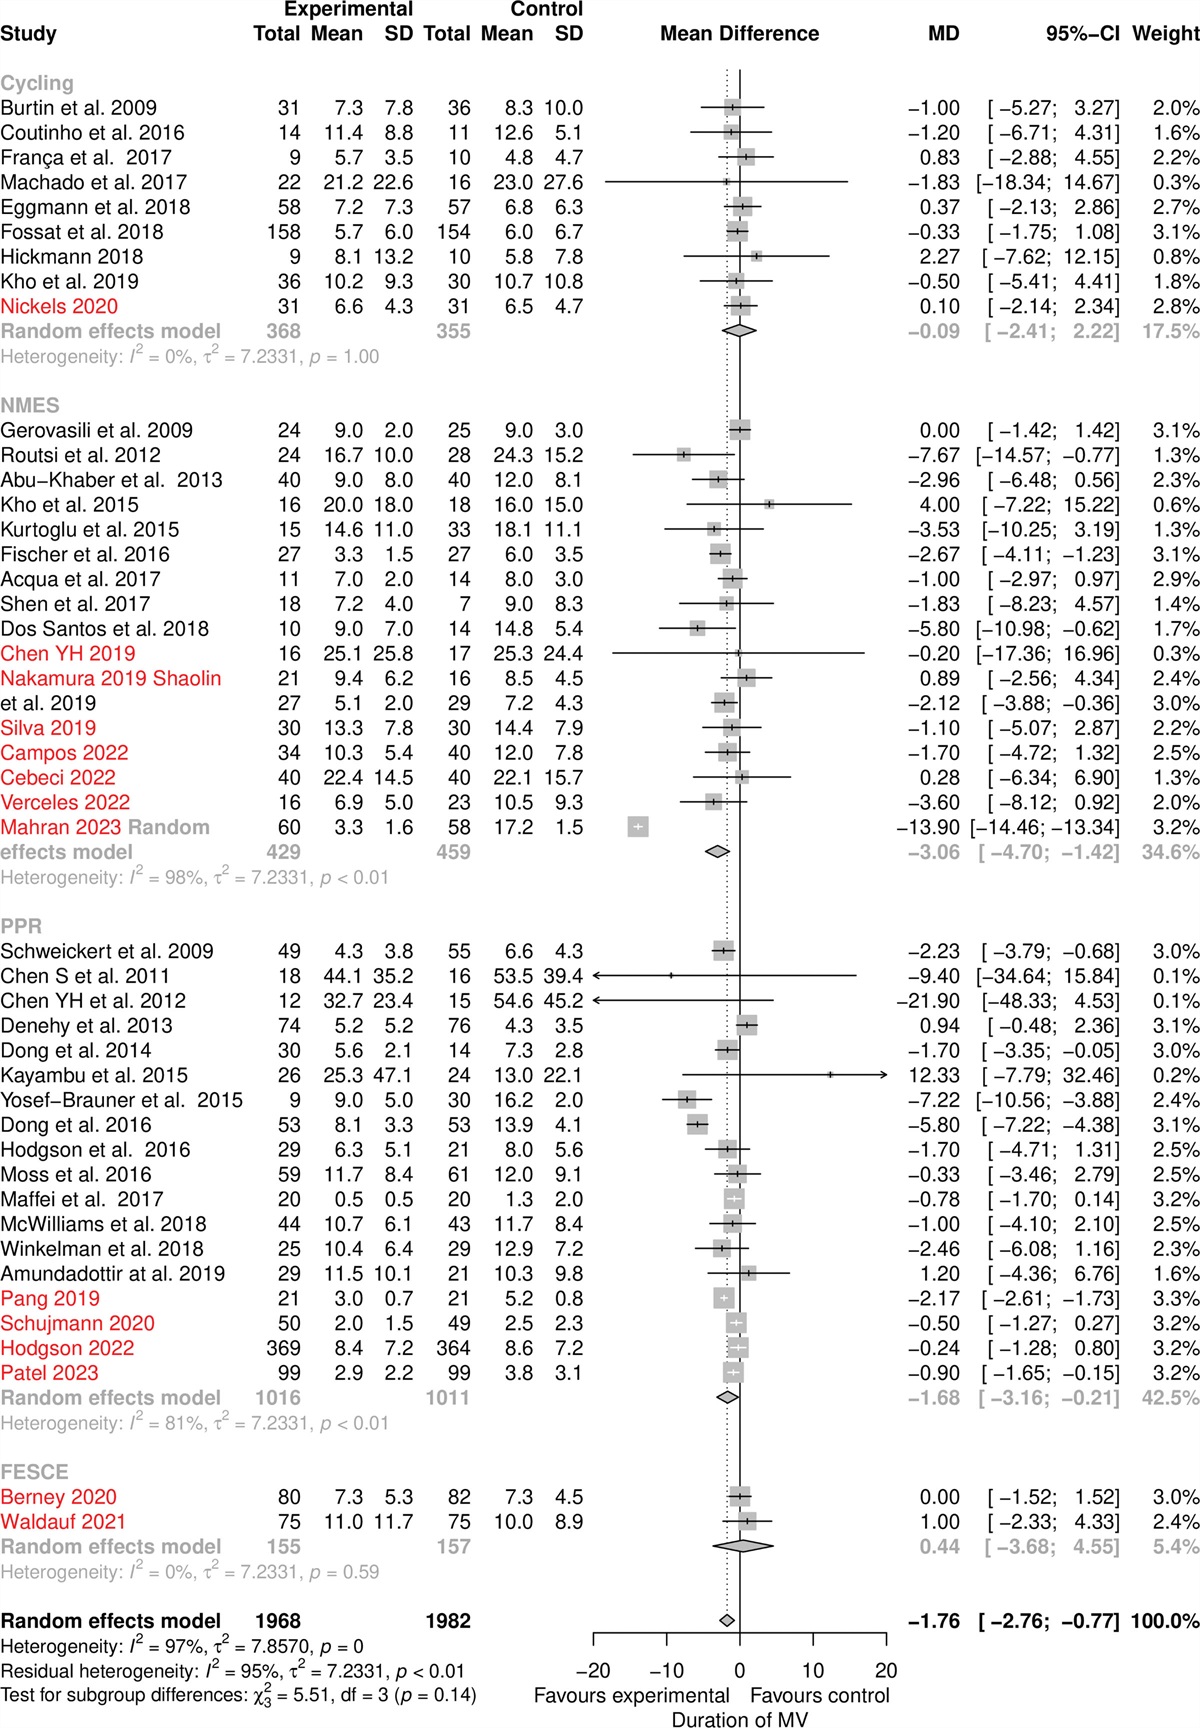
The difference in hemoglobin change between the control groups and the albumin group can be seen in Figure 3. For the control groups, the hemoglobin decreased steadily over the 12 hours. For the albumin group, however, there was a significant initial drop within the first 30 minutes after the albumin administration ended. Then the level remained relatively stable for at least 12 hours.
 Figure 3.:
 Hemoglobin (Hb) changes after albumin administration over the course of 12 hours. Isooncotic albumin (12.5 g in 250 mL and 25 g in 500 mL) causes a more significant decrease in hemoglobin compared to the control groups. Additionally, double the amount causes around double the change. Hyperoncotic albumin (20 g in 100 mL) leads to a less significant drop in hemoglobin. For all albumin cases, the hemoglobin decreased around 5 g/L and remained at this level for 12 hours.
The course of hemoglobin relative to the baseline hemoglobin during the observed 12-hour time span could be estimated using a linear mixed model (Additional table 2, https://links.lww.com/CCM/H497). Using this model, on average we could predict the decrease of hemoglobin 6–12 hours after albumin administration over all patients (Additional table 3, https://links.lww.com/CCM/H497).
For the 12.5 g albumin group, hemoglobin decreased by about 5.5 g/L after six and by 5.4 g/L after 12 hours, and for the 25 g group it was 8.5 g/L after six and 8.4 g/L after 12 hours. For the high-osmolality solution (20 g), the decrease after 6 hours measured 3.8 g/L and after 12 hours 3.7 g/L. The average decrease in hemoglobin concentrations among all patients receiving albumin was approximately 5.0 g/L after the initial decline. A higher dose of the isooncotic albumin solutions (12.5 g and 25 g) caused hemoglobin to decline to a lower concentration. A double amount of albumin nearly doubled the decrease in hemoglobin. However, the hyperoncotic albumin solution (20 g) did not cause the hemoglobin to fall as low. The decline in hemoglobin was observable only for about 12 hours before reaching the level of the control groups.
To examine whether albumin administration had a different effect in septic patients, we repeated the linear mixed model for the subgroup of septic patients. In these patients, a similar effect on hemoglobin was visible with significant decreases in all albumin groups, but the decreases were slightly smaller for all individuals with septic shock compared with the whole ICU population. Again, when predicting the hemoglobin decrease after 6 and 12 hours in this subgroup, a smaller decrease in hemoglobin among the subgroup of septic shock patients became evident. Specifically, a predicted mean difference of around 0.8 g/L could be observed in all albumin groups after both 6 and 12 hours (i.e., hemoglobin decrease of around 4.2 g/L for all albumin patients in the septic shock group). The linear mixed model and prediction can be found in the supplement (Additional tables 4 and 5, https://links.lww.com/CCM/H497).
DISCUSSIONNearly 21,000 ICU cases over 9-year period were examined in this study. Although crystalloids have slightly diminished, the use of albumin has increased at the University Hospital Basel. This increase is seen in most ICU patients and is particularly evident in patients undergoing surgery, transfusion, and in septic shock patients. However, the number of patients with liver cirrhosis treated with albumin has remained similar throughout the study period. This is most likely due to albumin substitution after paracentesis for ascites drain and the treatment of hepatorenal syndrome. Further, over the course of the 9-year study period albumin was given to less ill patients as can be seen by the decrease in SAPS-II among patients in the albumin group.
This study established a drop in hemoglobin approximately 20–30 minutes after albumin administration, which remained lower for at least 12 hours. The amount of albumin administered and the osmolality of the compound directly relate to the decrease in hemoglobin and, thus, the effect on plasma volume. The isooncotic solutions, in particular, showed a more considerable decrease in hemoglobin. It is unclear whether the administration of albumin, which lowered hemoglobin, played a role in the increase of transfused patients. However, it cannot be ruled out that in some cases the hemoglobin fell below the threshold to qualify for RBC transfusion. It is also possible that the administration of albumin may have unmasked an underlying anemia associated with reduced plasma volume, resulting in the need for RBC transfusions.
The trend toward more restrictive fluid therapy has continued in recent years (30). Volume resuscitation solely with crystalloids is a concept of the past. Vasoactive substances and albumin are still on the rise. Given its long half-life and ability to function even in severely ill patients, albumin has in part replaced artificial colloids in fluid resuscitation.
Most studies on the volume-expanding effect of albumin have only considered the effect over at most 5–6 hours (26,28,29,31,32). The effect on the hemoglobin concentrations over time agrees with other studies (28,32), but reveals that the effect lasts for longer than initially expected, even in patients with severe diseases such as septic shock. Though the effect is reduced in said subgroup. This is most likely due to a more rapid loss of fluids into the interstitial space because of increased capillary leakage (27). This can be further explained by the revised Starling equation and glycocalyx model that show up to four times the capillary leak in septic shock patients (33,34). The larger effect on hemoglobin change from the 5% albumin solutions has been previously studied (32,35) and can be explained by multiple factors. First, the isooncotic solutions are administered with more volume (five-fold more for the 500 mL solution). Second, the hyperoncotic formula probably increased the hydrostatic pressure, causing a reduction in the volume of fluid that moves between the capillaries and the interstitial space (32). Thus, rendering it a less suitable option for volume resuscitation.
Like any retrospective single-center study, this study has limitations. First, for our second objective, evaluating volume expansion in terms of hemoglobin decrease, we were not able to define a time zero for the control group and thus had to establish an arbitrary time zero. To limit bias, we used a control group that was hospitalized for a similar time and took the hemoglobin measurements on the same day of their ICU stay. Second, since we only measured hemoglobin at given times to establish the effect of volume expansion, these values must be regarded with caution since it is impossible to eliminate all factors contributing to a hemoglobin decrease. To limit bias, we ruled out any patients with hemolysis, undergoing dialysis, acute bleeding, or with blood detected in thoracic or pericardial drainage during the observation period.
In addition, we used a self-matched control where the same patient who served for the albumin group also functioned as a control during a time when they did not receive any albumin. Minor bleeds, undetected hemolysis, and other hemoglobin-changing events could not be ruled out with certainty. However, this is the case for the intervention as well as the control patients. Also, it is hard to evaluate the volume expansion solely by investigating the change in hemoglobin values. Nevertheless, we can assume that a bigger change in hemoglobin concentration correlates with a bigger effect on hemodilution. Given our large cohort, we assume that unknown confounders do not significantly affect the results, despite being unable to prove the opposite. It is worth noting that RBC transfusions were generally given following the recommended guidelines (hemoglobin threshold of 70 g/L and 80 g/L, respectively, in acute coronary syndrome) (36). However, the decision to administer transfusions also relied on the clinical judgment of the treating intensive care consultant.
Finally, there is a discrepancy in SAPS-II. Patients who were administered albumin tended to have a higher score than the remaining patients. This is most likely due to indication of albumin in hemodynamic instability and, hence, in more severely ill patients (11,37). Although we have corrected for this in the self-matched control, the same could not be done for the matched control.
CONCLUSIONSThe results of this study reveal that albumin was given more liberally to critical care patients over the last decade. We can also conclude that the drop in hemoglobin concentration and, thus, the volume expansion caused by albumin administration lasts for at least 12 hours regardless of the dosage. However, both the dose and especially the osmolality of the albumin product impact the degree of hemodilution. Further research is needed to fully measure the volume expansion and to assess clearer indications for albumin administration in different subgroups (septic shock or postcardiotomy) of critically ill patients.
ACKNOWLEDGMENTSWe thank the Gottfried and Julia Bangerter-Rhyner Foundation, Switzerland, for financially supporting this project.
REFERENCES 1. Flannery AH, Kane SP, Coz-Yataco AO: A word of caution regarding proposed benefits of albumin from ALBIOS: A dose of healthy skepticism. Crit Care. 2014; 18:509 2. Fan E, Stewart TE: Albumin in critical care: SAFE, but worth its salt? Crit Care. 2004; 8:297–299 3. Aguirre Puig P, Orallo Moran MA, Pereira Matalobos D, et al.: Current role of albumin in critical care. Rev Esp Anestesiol Reanim. 2014; 61:497–504 4. Hohertz B, Seupaul RA, Holmes TM: Are colloids better than crystalloids for fluid resuscitation in critically ill patients? Ann Emerg Med. 2015; 65:443–444 5. Joannidis M, Wiedermann CJ, Ostermann M: Ten myths about albumin. Intensive Care Med. 2022; 48:602–605 6. Caironi P, Langer T, Gattinoni L: Albumin in critically ill patients: The ideal colloid? Curr Opin Crit Care. 2015; 21:302–308 7. Vincent JL, De Backer D, Wiedermann CJ: Fluid management in sepsis: The potential beneficial effects of albumin. J Crit Care. 2016; 35:161–167 8. Orbegozo Cortes D, Santacruz C, Donadello K, et al.: Colloids for fluid resuscitation: What is their role in patients with shock? Minerva Anestesiol. 2014; 80:963–969 9. Hammond NE, Taylor C, Finfer S, et al.; Fluid-TRIPS and Fluidos Investigators: Patterns of intravenous fluid resuscitation use in adult intensive care patients between 2007 and 2014: An international cross-sectional study. PLoS One. 2017; 12:e0176292 10. Cooper DJ, Myburgh J, Heritier S, et al.; SAFE-TBI Investigators: Albumin resuscitation for traumatic brain injury: Is intracranial hypertension the cause of increased mortality? J Neurotrauma. 2013; 30:512–518 11. Martin GS, Bassett P: Crystalloids vs. colloids for fluid resuscitation in the intensive care unit: A systematic review and meta-analysis. J Crit Care. 2019; 50:144–154 12. Rozga J, Piatek T, Malkowski P: Human albumin: Old, new, and emerging applications. Ann Transplant. 2013; 18:205–217 13. Spinella R, Sawhney R, Jalan R: Albumin in chronic liver disease: Structure, functions and therapeutic implications. Hepatol Int. 2016; 10:124–132 14. Cochrane Injuries Group Albumin R: Human albumin administration in critically ill patients: Systematic review of randomised controlled trials. BMJ. 1998; 317:235–240 15. Finfer S, Bellomo R, Boyce N, et al.; SAFE Study Investigators: A comparison of albumin and saline for fluid resuscitation in the intensive care unit. N Engl J Med. 2004; 350:2247–2256 16. Myburgh JA, Finfer S: Albumin is a blood product too—is it safe for all patients? Crit Care Resusc. 2009; 11:67–70 17. Perel P, Roberts I: Colloids versus crystalloids for fluid resuscitation in critically ill patients. Cochrane Database Syst Rev. 2007; (4):CD000567 18. Caironi P, Tognoni G, Masson S, et al.; ALBIOS Study Investigators: Albumin replacement in patients with severe sepsis or septic shock. N Engl J Med. 2014; 370:1412–1421 19. Vasques F, Duscio E, Romitti F, et al.: Septic shock-3 vs 2: An analysis of the ALBIOS study. Crit Care. 2018; 22:237 20. Xu JY, Chen QH, Xie JF, et al.: Comparison of the effects of albumin and crystalloid on mortality in adult patients with severe sepsis and septic shock: A meta-analysis of randomized clinical trials. Crit Care. 2014; 18:702 21. Wiedermann CJ: Systematic review of randomized clinical trials on the use of hydroxyethyl starch for fluid management in sepsis. BMC Emerg Med. 2008; 8:1 22. Haase N, Perner A, Hennings LI, et al.: Hydroxyethyl starch 130/0.38-0.45 versus crystalloid or albumin in patients with sepsis: Systematic review with meta-analysis and trial sequential analysis. BMJ. 2013; 346:f839 23. Mutter TC, Ruth CA, Dart AB: Hydroxyethyl starch (HES) versus other fluid therapies: Effects on kidney function. Cochrane Database Syst Rev. 2013; (7)
留言 (0)