
記住我


Distress is defined as a condition that interferes with the well-being of an animal (Ihwan et al., 2016; Balasch and Tort, 2019). Fish in aquaculture and research facilities are often subjected to distress not only for short time periods (acute stress) but also for longer ones (chronic stress). However, rearing fish under conditions that respect the species-specific needs of the animals improves their well-being and performance in fish farms (Macaulay et al., 2022) and under experimental conditions (Grunow and Strauch, 2023). The main question of the present work is to identify which set of genes in which brain region is characteristic of specific stress situations and should therefore be focused on in future fish welfare assessments. Accordingly, brain gene expression studies have increasingly investigated the responses of the brain parts separately (Vindas et al., 2018; Huang et al., 2019; Martorell-Ribera et al., 2020). The functions of the telencephalon have long been regarded solely to be olfactory (Aronson, 1967), but more recent research has confirmed its important role in the expression of emotional and motivational behavior and in stress responses in teleosts (Lau et al., 2011; von Trotha et al., 2014; Pawlak et al., 2022). In addition, the hypothalamus plays an important role in energy homeostasis and appetite regulation, which may also be affected by stress (Pawlak et al., 2023). The optic tectum not only is essential for visually mediated behaviors in teleosts (Kramer et al., 2019) but also receives input from other brain areas, such as the hypothalamus and cerebellum (Heap et al., 2013; Filosa et al., 2016). The cerebellum of fish is responsible for the coordination of body movements (Moens and Prince, 2002) and has been linked to spatial navigation (Duràn et al., 2014), and also appears to play a role in social stress in fish (Guo et al., 2022).
The expression analysis of genes involved in stress responses in fish commonly includes genes of the hypothalamus–pituitary–interrenal (HPI) axis. The excitation of pro-opiomelanocortin (POMC)–expressing neurons in the hypothalamus results in the activation of corticotropin-releasing factor (CRF) neurons and the release of CRF (Cerdá-Reverter et al., 2003; Sanchez et al., 2009). The role of CRF in zebrafish exposed to stress, e.g., by confinement, has been investigated by Ghisleni et al. (2011). Urotensin 1 (URO1), which is structurally related to the tetrapod urocortin, is a paralogue of the CRF and has the ability to bind to the CRF receptors r1 and r2 (Suda et al., 2004). The binding protein for CRF (CRH-BP) rather co-occurs with CRH than with URO1 in the adult zebrafish brain, reducing its availability and thus limiting further release of the adrenocorticotropic hormone precursor POMC (McClennen et al., 1998; Alderman and Bernier, 2007). The downstream production of cortisol allows the activation of glucocorticoid receptors (GRs) and mineralocorticoid receptors (MRs), which further regulate other pathways in some cases in a ligand-specific way (Pippal et al., 2011; Cruz et al., 2013; Lee et al., 2019). However, cortisol also influences vasotocin and isotocin secretion in gilthead sea bream, Sparus aurata, and round goby, Neogobius melanostomus (Kalamarz-Kubiak, 2018). In the case of isotocin, it has been assumed that a non-genomic pathway mediates the effects of cortisol (Kalamarz-Kubiak, 2018). Furthermore, isotocin signaling in fish is involved in social behaviors, stress responses, and aggression (Semsar et al., 2001; Salek et al., 2002; Kulczykowska et al., 2009; Pawlak et al., 2023).
Besides measuring the activity of HPI axis–related genes, brain activity can also be assessed, for example, by using the activation of immediate early genes (IEGs) indicating neuronal activity. Several IEGs are known, with C-FOS being one of the most frequently analyzed IEGs. So far, light avoidance (Lau et al., 2011), sleep and waking behavior of zebrafish (Chatterjee et al., 2015), activation of the reward system (von Trotha et al., 2014), and caffeine have been shown to involve changes in c-fos expression in the zebrafish brain (Ashlin et al., 2018). Furthermore, IEGs also include factors for neuronal development (EGR-1 and ERK; Randlett et al., 2015) or neurogenesis (NeuroD; Alfonso et al., 2019) and for controlling the cytoskeleton, protein synthesis (e.g., CKAP5 or the eukaryotic initiation factor 2, EIFA), or metabolic enzymes, such as glyceraldehyde-3-phosphate dehydrogenase (GAPDH), pyruvate kinase (PYRKIN), citrate synthase (CITRSYN), or succinate dehydrogenase (SUCCDH; Pawlak et al., 2022). In addition, changes in the energy status can also lead to the regulation of the mechanistic target of rapamycin (mTOR). In cavefish brains, mTOR expression has been shown to increase with the application of the appetite-stimulating factor ghrelin (GHR) but not with injections of the anorexigenic factor cholecystokinin (CCK; Penney and Volkhoff, 2014).
Stress influences appetite regulation and feeding behavior in teleosts (Höglund et al., 2007; Leal et al., 2011; Pawlak et al., 2023); therefore, appetite-regulating genes have also been included in the present study. Furthermore, it has been shown that the administration of dopamine decreases gene expression of the agouti-related protein (agouti) but not of pomc and neuropeptide y (npy; He et al., 2018). The agouti-related protein family is known to centrally regulate food consumption in zebrafish (Shainer et al., 2019). In addition, two paralogs of the agouti signaling proteins have been identified in the zebrafish brain, which differ in their tissue distribution and function (Shainer et al., 2019).
The serotonergic system is widely distributed in the fish brain, and the functions of serotonin (5-HT) in the zebrafish brain have been described by Lillesaar (2011). Serotonin uptake variations influence anxiety and modulate the vocal–acoustic circuitry and behavior in teleosts (Simmons et al., 2017; Timothy and Forlano, 2020) and may also play a role in stress responses (Pawlak et al., 2023). Furthermore, the serotonin precursor tryptophan affects serotonin signaling and interferes with stress-induced anorexia in the rainbow trout, Oncorhynchus mykiss (Höglund et al., 2007; 2019). Interestingly, it has also been reported that darkness activates the majority of the tryptophan hydroxylase 2 (TPH2) serotonergic neurons within the raphe of zebrafish, thus further supporting the possibility that the release of serotonin is involved in aversive behaviors (Cheng et al., 2016). Being the rate-limiting step in serotonin formation, the activity of TPH in fish has been assumed to be a specific marker of 5 HT-producing neurons (Chivite et al., 2021). Interestingly, in vitro treatment of the telencephalon of tilapia (Oreochromis mossambicus) with noradrenaline and serotonin was found to stimulate the release of CRF (Pepels et al., 2004). Similarly, it has been shown that tyrosine hydroxylase (TH) is considered a marker for dopamine activity in tilapia and is related to the repeated exposure to aquaculture-relevant stressors such as handling, chasing, netting, and lowering of the water levels (Chabbi and Ganesh, 2015). In addition, the opioid system is known to be involved not only in nociception and analgesia in higher vertebrates but also in stress responses and reward processing (Le Merrer et al., 2009). Increasing evidence has shown that stress-induced analgesia also exists in zebrafish (Thomson et al., 2020). Furthermore, acute stress affecting appetite regulation is in parallel to the changes in the expression of opioid receptor delta in common carp (Pawlak et al., 2023).
Thus, the present study concentrates on the primary stress responses at the brain level to clarify which set of genes expressed in different brain regions is characteristic of specific stress situations. The investigations further reflect on whole-body steroid levels as the subsequent level of stress responses.
2 Materials and methods2.1 Rearing conditionsFour-liter rearing tanks (MC2B, dimensions: 332 × 150 × 130 mm, Zebcare by Fleuren & Nooijen BV, Nederweert, NL) for fish breeding were part of a recirculating aquarium system equipped with a biofilter. In these, the zebrafish (Danio rerio) of the wild-type × AB strain (ZIRC, Eugene, OR, United States) were 6–12 months old and fed twice daily with freshly hatched Artemia nauplii (Ocean Nutrition Europe, Essen, Belgium) in the morning between 8:00 and 8:30 a.m. and in the afternoon with commercial dry feeds (Zebrafeed, 0.2–0.4 mm size, from Sparos, Olhão, PT). From these fish, 24 individuals (male and female fish, separately) were transferred to individual rearing tanks with an effective volume of 2.7 L (MC.1 tanks, dimensions: 235 × 150 × 130 mm, Zebcare by Fleuren & Nooijen BV, Nederweert, NL) for 3 days in a smaller recirculating aquaria system (DC-96 benchtop system, Zebcare by Fleuren & Nooijen BV, Nederweert, NL) with continuous monitoring of the water temperature, pH, and conductivity levels (JUMO AQUIS touch S, JUMO AUTOMATION GmbH, Eupen, Belgium) and used for the stress experiment thereafter. Water temperature, dissolved oxygen, salinity, and pH in the experimental tanks were manually checked at each sampling day using a mobile device (HQ40D, Hach-Lange GmbH, Rheineck, Switzerland), which showed stable values averaging at 26.1°C, 7.40 mg/L, 571 μS, and 7.38, respectively. Ammonium, nitrite, and nitrate content in water were measured on each of the three sampling days, and mean values of 0.01 mg/L, 0.01 mg/L, and 13.5 mg/L have been noted. The light cycle in the facility was 14 h light:10 h dark. The experimental design of the study is presented in Figure 1. The six control fish reared for 3 days as mentioned above were taken directly from the rearing tank before the feeding time in the morning of the same day as the treated fish. The remaining fish were placed in individual tanks in groups of three fish in duplicate, reared for 3 days without disturbance, and remained unfed in the morning. For the “air exposure” treatment, the fish were exposed in a net to air for 1 min and euthanized 60 min after that. For the “feed” treatment, three fish were similarly housed together for 3 days in duplicate and fed the expected Artemia nauplii ration in the morning, whereas for the two “feed control” treatments, three fish were not fed at the expected time in the morning. Euthanasia was performed with an overdose of tricaine methanesulfonate (>150 mg/L MS-222, Sigma-Aldrich, Buchs, Switzerland) for less than 2 min. The weight of the fish (Mettler Toledo GmbH, Greifensee, Switzerland) and the total length and standard body length were noted, and Fulton`s condition factors were calculated by dividing the weight of the fish by the total length cubed × 100 (Fulton, 1902). In addition, the body mass index was calculated [weight (g)/standard length (mm)2] for each individual. The brains were excised and stored in RNAlater® (Sigma-Aldrich, Buchs, Switzerland) for at least 24 h and then cut into four parts (tel = telencephalon, hyp = hypothalamus, opt = optic tectum, and rhomb = rhombencephalon comprising the corpus cerebelli and medulla oblongata) using a microscope (VWR® VisiScope® STB150, Stereo Microscope, VWR International, Switzerland). All experiments/procedures were approved by the local animal care committee (license no. BE69/2020) and were in accordance with guidelines set by the Swiss Council on Animal Care.

Figure 1. Overview of the experimental design of the study.
2.2 PCR conditionsPrimer pairs used for the gene expression studies have been prepared with Primer3 (Untergasser et al., 2012), and the individual sequences are given in Supplementary Table S1. Prior to the analyses, all primers were validated, and the respective PCR products were confirmed by Sanger sequencing performed by Microsynth AG (Balgach, Switzerland) after the cleanup of the PCR products with suitable kits (NucleoSpin Gel and PCR Clean-up, Macherey-Nagel AG, Urdorf, Switzerland). The sequencing results have been compared to known sequences via the basic local alignment search tool (Blast-N) function from the National Center for Biotechnology Information (NCBI, https://www.ncbi.nlm.nih.gov/). The primer efficiencies were analyzed using LinRegPCR (version 2020.2; available at https://medischebiologie.nl/files/) and are reported in Supplementary Table S1. All amplicons had a size ranging from 110 bp to 200 bp. The total RNA from each of the four parts of each brain (tel, hyp, opt, and rhomb) was extracted using the RNeasy Micro Kits (QIAGEN AG, Hombrechtikon, Switzerland) with an on-column DNase I treatment. The RNA content was confirmed using a microplate for a plate reader (Tecan Infinite M200 Pro, Tecan Instruments, Crailsheim, Germany). Subsequently, total RNA was reverse transcribed into cDNA using the ProtoScript Reverse Transcription Kit (NEB, distributed by BioConcept AG, Allschwil, Switzerland) according to the manufacturer’s instructions. Thereafter, the cDNA content was adjusted to 75 ng per ul using nuclease-free water (Ambion®, distributed by Thermo Fisher Scientific, Switzerland) and used for pre-amplification with 18 cycles using the PreAmp Master Mix from Fluidigm Corporation (South San Francisco CA, United States) and a pre-mixed primer solution, followed by an exonuclease treatment (BioConcept AG, Allschwil, Switzerland) according to the manufacturer`s protocol. Subsequently, the pre-amplified cDNA was diluted fourfold, mixed with the SsoFast™ EvaGreen® Supermix with Low ROX master mix (Bio-Rad Laboratories AG, Cressier, Switzerland), and the Fluidigm sample reagent (Fluidigm Corporation, South San Francisco, CA, United States) according to the manufacturer’s protocol, loaded on BioMark™ IPC chips (192 × 24, Fluidigm Corporation, South San Francisco, CA, United States), and incubated in a Juno system for 33 min. Thereafter, real-time PCRs were run using a BioMark™ system (Fluidigm Corporation, South San Francisco, CA, United States). The initial results were calculated using the Fluidigm Real-Time PCR Analysis software (version 4.8.1, Fluidigm Corporation). The optimal reference genes were extracted from a set of 10–11 potential reference genes by using the RefFinder (http://blooge.cn/RefFinder/) separately for each brain part. The results from the reference gene evaluation can be found in Supplementary Table S2.
All gene expression values were calculated relative to the expression of the selected reference gene (dCt method) and were further calculated as fold changes compared with the respective controls. Only significant gene expression differences are shown in Figures 3, 4.
2.3 Analysis of body corticosteroid levelsPrior to the steroid analyses, diethyl ether extractions of whole-body homogenates (without the heads) were repeated twice; the extracts were purified on C18 columns (Sep-Pak Vac C18 1 cc 100/BX, Waters AG, Dättwil, Switzerland), and the cortisol and cortisone levels were analyzed using a UHPLC–MS/MS system, as previously described (Pawlak et al., 2022). The final values were calculated as nanograms of steroid per gram of body weight.
2.4 Calculations and statisticsThe body steroid levels (Pietsch, 2024) were log-transformed and used for two-sided ANOVA tests with subsequent Tukey HSD tests to compare the groups with each other. For the correlation analyses, the log-transformed cortisone and cortisol levels were compared with Pearson correlation tests in RStudio (version 1.2.1335). The gene expression data investigated in the different brain parts (Pietsch, 2024) were used to build mixed models with a fully Bayesian approach using the brms package (Bürkner, 2017) in RStudio. Based on pre-checks, t-distributions were chosen for the models with 10,000 iterations that included gene-specific random effects for the constants (α), gene-specific random effects for differences between groups (β), and animal-specific random effects for the constants (γ), as explained earlier by Burren and Pietsch (2021). Improved handling of possible outliers was achieved by posterior predictive checks based on Markov chain Monte Carlo (MCMC) approximation. The resulting replicated data under the fitted model were subsequently compared to the observed data. Finally, point estimators, their SEMs, credibility intervals, and posterior predictive p-values were calculated. Significance was determined using Wald χ2-statistics for generalized linear models and F-statistics for mixed models, and the estimated marginal means were calculated, which included their corresponding 95% credible intervals (95% CI). A p < 0.05 was considered statistically significant.
The genes investigated in the different parts of the brain were also subjected to a principal component analysis (PCA) in order to show gene clusters that typically respond to the distinct treatments. The PCA was run in RStudio on individual sets of genes (HPI axis–related genes, IEGs, appetite genes, and the remaining genes related to different pathways in the brain) to prevent a low sample-to-item ratio that would lead to incorrect factor structures and misclassification of items. Finally, the most contributing genes were compiled for each pathway, and a PCA run for these in female and male fish separately. Only the first two components of each PCA were used to prepare figures of the cos2 values for each brain region. For the female fish, the two-dimensional PCAs explained 76.6% of the variance in the telencephalon, 64.6% in the hypothalamus, 70.9% in the optic tectum, and 78.0% of the variance in the rhombencephalon. For the male fish, the two-dimensional PCAs explained 79.8% of the variance in the telencephalon, 75.9% in the hypothalamus, 73.1% in the optic tectum, and 78.1% of the variance in the rhombencephalon. More details on the contribution of each gene to the total variance for the individual treatment groups are given in the Results section.
The classification and feature importance calculation required bootstrapping of the data (Pietsch, 2024). For this, the gene expression values as log 2 of the normalized expression were used to generate bootstrapped data sets, with n = 100 data points separately for each treatment group and gender, for each gene using the R package boot (Canty and Ripley, 2021) and resampled (Hesterberg, 2015) in RStudio, and subsequently, random forest models were performed in a Jupyter Notebook based on Python 3. Accordingly, 70% of the data points from each bootstrap iteration was used for training the models, while the remaining 30% was used for model evaluation. The gene expression data were stratified and scaled prior to model building. The built-in feature importance function was used to report the contribution of the individual parameters to the model output. The number of genes that were sufficient to yield the same accuracy as the full data set for each brain part was calculated in an iterative process.
3 Results3.1 Morphological characteristics of the fish and body steroid analysesThe initial analyses of the present study concentrated on the morphological and stress hormone differences between the experimental groups and differences between the female and male fish. The adult zebrafish that were used for the experiment showed significant differences in weight between the genders, which also affected the condition factor and BMI between female and male fish (Supplementary Table S3). An effect of the treatment group assignment or an interaction of treatment and gender was not observed.
The analysis of the body stress hormone levels revealed that the levels of 11-deoxycorticosterone and corticosterone in the whole-body samples were not quantifiable. The cortisol and cortisone levels for each fish correlated well with each other in female and male fish (Figure 2). Moreover, the two-sided ANOVA indicated a significant effect of gender (p = 0.005) and treatment (p = 0.012) on the steroid levels (Supplementary Table S4), but there was no significant difference between the steroid levels between the treatments after correcting the p-values for multiple comparisons. Thus, the whole-body steroid levels do not appear to be valuable proxies for the stress scenarios used in the present study.
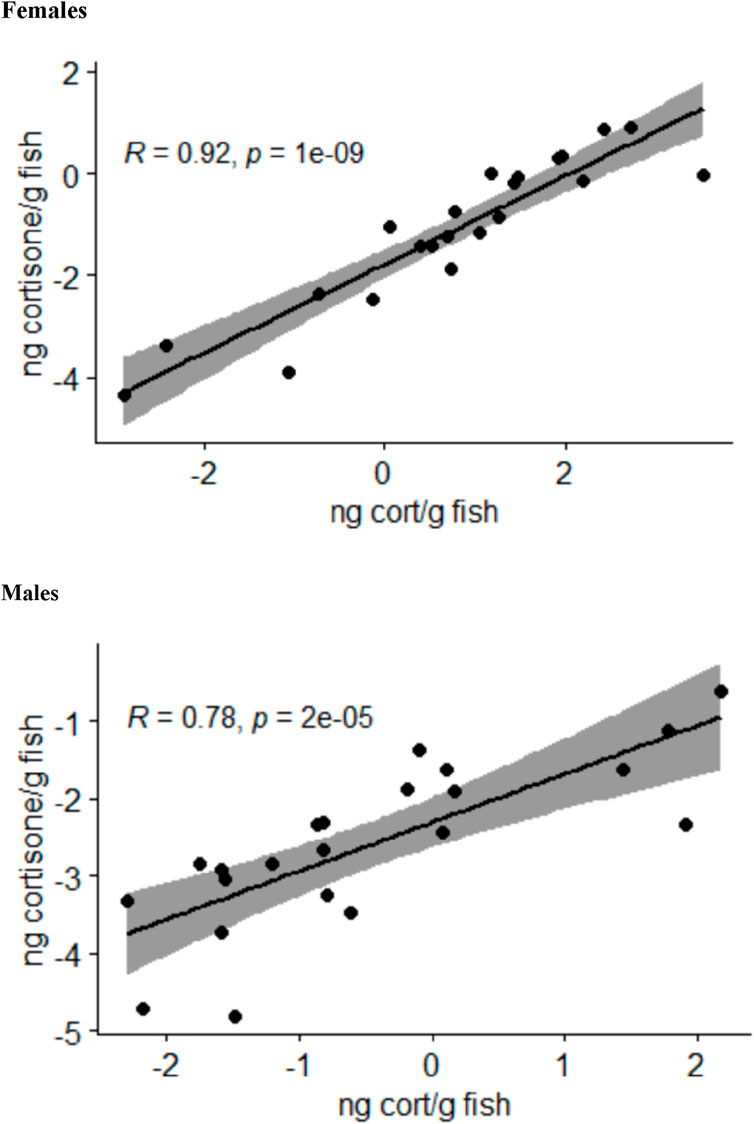
Figure 2. Relationship between the log-transformed whole-body cortisol (cort) and cortisone levels calculated as nanograms per gram of fish in female and male zebrafish across all treatment groups analyzed by Pearson correlation tests; the area shaded in gray indicates the 95% confidence interval.
3.2 Immediate early genes (cfos, eiFa, egr-1, erk-1, neuroD, and palld)The investigations of the gene expression patterns comprised four different brain parts in which different expression patterns in female and male fish were observed. In the telencephalon of female zebrafish, the expression of the IEG c-fos was lower in air-exposed animals and in the feed control fish compared with the controls (Figure 3, p = 0.012). A significant difference between control fish and feed control fish or air-exposed fish was also observed for the IEG eiFa in the telencephalon of male fish (Figure 4, p < 0.05).

Figure 3. Gene expression profile in each of the four brain parts (telencephalon, hypothalamus, optic tectum, and rhombencephalon) in the female control fish (group 1) and fish at 60 min after the treatment (feeding = 2; feed contr = 3; and air exposure = 4); marginal means ± SEM; n = 6 per treatment; and the means of groups with the same letters are not significantly different from each other (p > 0.05).
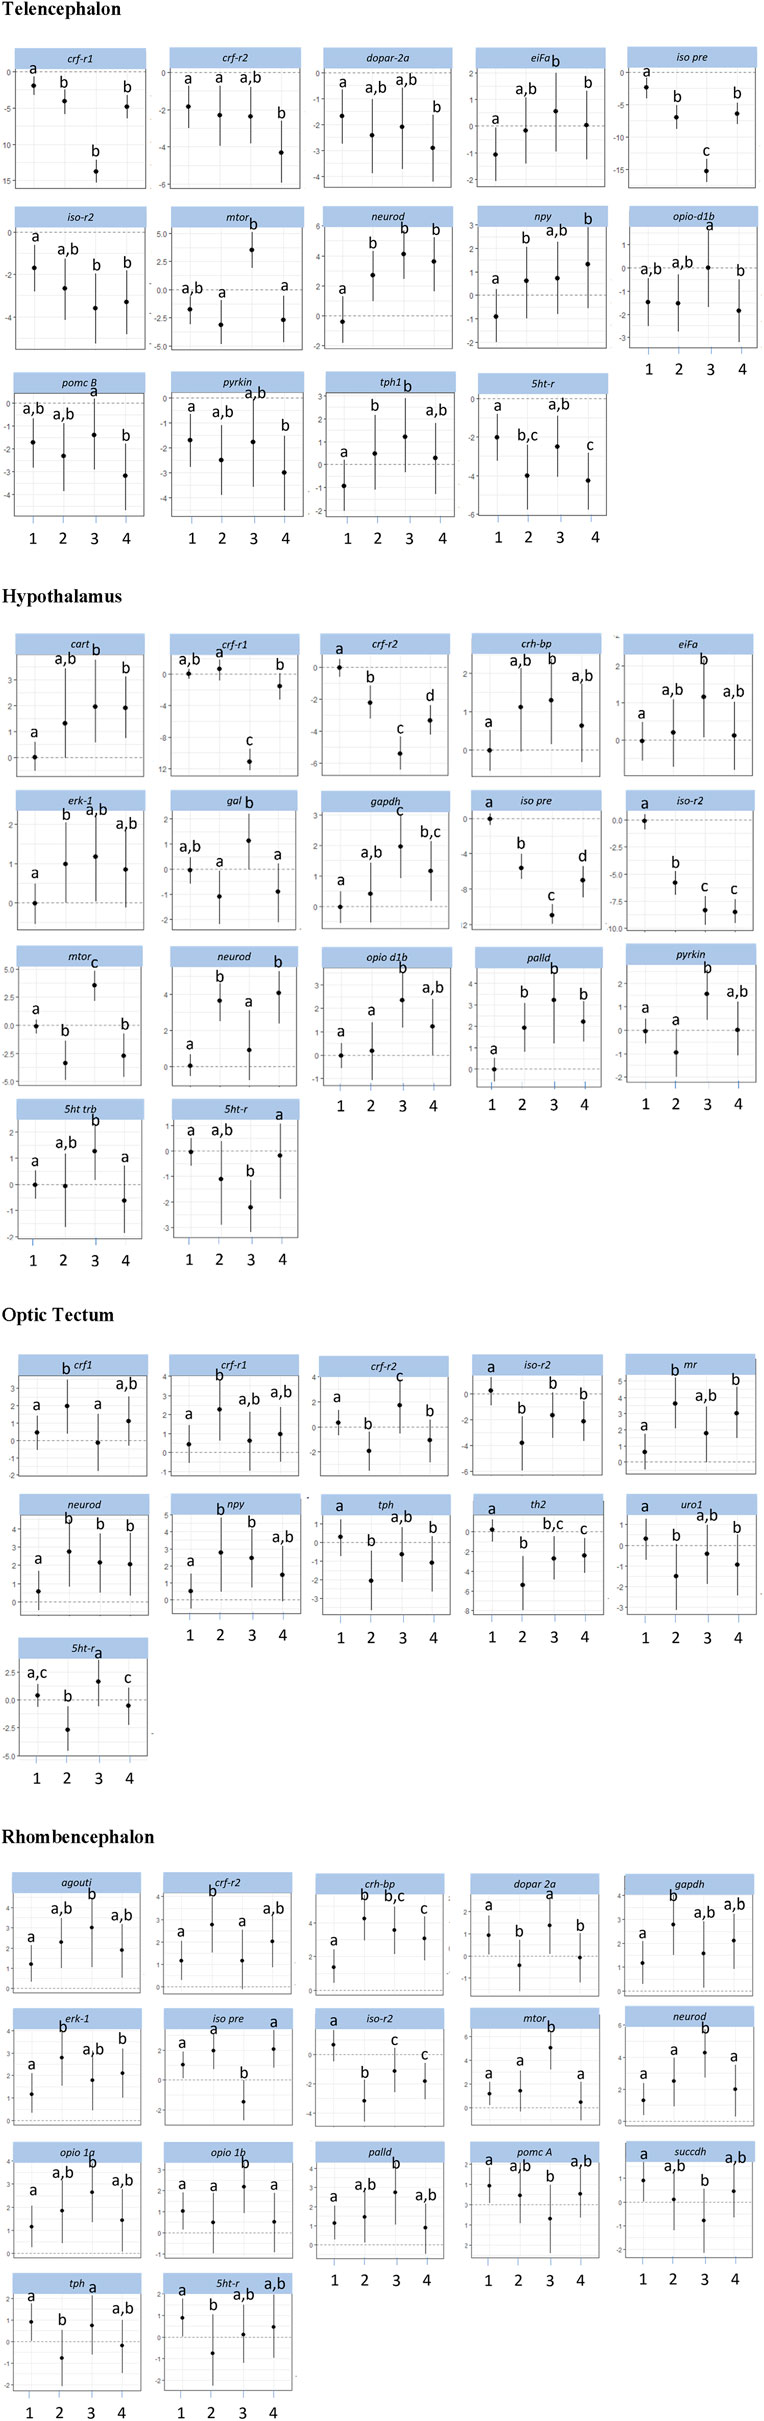
Figure 4. Gene expression profile in each of the four brain parts (telencephalon, hypothalamus, optic tectum, and rhombencephalon) in the male control fish (group 1) and fish at 60 min after the treatment (feeding = 2; feed contr = 3; and air exposure = 4); marginal means ± SEM; n = 6 per treatment; and the means of groups with the same letters are not significantly different from each other (p > 0.05).
For the hypothalamus of male fish, a higher mRNA expression of eiFa in fish of the feed control group was observed than the controls (Figure 4, p = 0.046). In addition, the expression of erk-1 was higher in the feed-rewarded fish than in the control animals (p = 0.046). The expression of palld was higher in all male treatment groups than in control fish (p < 0.004). Moreover, the expression of neuroD in male fish was significantly higher in feed-rewarded and air-exposed fish than in the control animals (p < 0.001) or fish from the feed controls (p < 0.028). Similar to the situation in the telencephalon, c-fos expression showed a significant difference in value between the hypothalamus of control fish and of female fish.
For the optic tectum, the neuroD expression in male fish was found to be significantly higher in all treatment groups than in the controls (Figure 4, p ≤ 0.038). In the optic tectum of female fish, the expression levels of c-fos and palld were significantly lower and the mRNA level of eiFa was significantly higher in all treatment groups than in control fish (Figure 3, p ≤ 0.018). The expression of neuroD in female fish was only different between the air-exposed zebrafish and controls (p = 0.03).
Similar to the pattern in the hypothalamus, the expression of erk-1 was higher in the feed-rewarded fish than in the control animals in the rhombencephalon of male fish (Figure 4, p = 0.002) but also higher in the air-exposed fish (p = 0.042). In addition, the expression of palld was higher in the feed control group than in the controls (p = 0.048). The expression of neuroD was also higher in this group than in all remaining groups (p ≤ 0.048). In female fish, the expression of c-fos was higher in the feed reward group than in the controls (p = 0.002). In addition, the mRNA levels of egr-1 and erk-1 were significantly lower in the feed control and air exposure groups than in the controls (p ≤ 0.038). Moreover, female fish showed reduced neuroD expression in the feed reward and feed control groups compared with control fish (p ≤ 0.024).
Overall, the effects of the different stressors on the IEGs indicate that besides c-fos, a number of other IEGs are regulated. In addition, the effects are distributed to all four brain parts investigated separately.
3.3 Effects on HPI axis–related genesThe investigations of the HPI axis–related gene expression patterns also comprised the four different brain parts in which different expression patterns in female and male fish were observed. The crf-related genes in the telencephalon in male fish showed significantly reduced crf-r1 mRNA expression in all treatments compared with control fish (Figure 4, p < 0.01). In female zebrafish, the expression of this gene was only reduced in the feed group and in the feed control group (Figure 3, p < 0.024). Moreover, the transcript levels of crf-r2 in male fish were only lower in air-exposed fish than in the controls (p < 0.001) and feed-rewarded individuals (p = 0.02). By contrast, female zebrafish showed only a lower expression of crf-r2 in the feed-rewarded animals than in the controls or air-exposed fish (Figure 3, p ≤ 0.006). Only in the female telencephalon, uro1 showed higher mRNA expression levels in the feed reward and feed control groups (Figure 3, p < 0.03). In addition, the expression of pomc B was found to be different between feed control animals and air-exposed male individuals (Figure 4, p = 0.044). However, female zebrafish showed significantly lower pomc A expression in all treatments than in control fish (Figure 3, p < 0.02).
In the hypothalamus of male fish, the expression of crf-r1 was significantly different between all treatment groups (Figure 4, p < 0.028) and also significantly lower in the feed control group than in the controls (p < 0.001). Moreover, the expression of crf-r2 in this brain part in male fish was different in all treatment groups, which included the controls (p < 0.002). In the hypothalamus of male fish, the crh-bp mRNA expression was found to be different between the controls and feed control fish (p = 0.038). In female fish, the crf-r1 transcript levels in the hypothalamus showed significantly higher values than in the control animals (p ≤ 0.044), whereas the expression of crf-r2 expression was significantly lower than in control fish (p ≤ 0.006). In contrast to the telencephalon, the pomc A expression in the hypothalamus of female fish showed only significantly higher values in the feed reward and air exposure groups than in control fish (p ≤ 0.034).
The analyses of expression patterns of CRF-related genes in the optic tectum of male fish showed that crf1 and crf-r1 are significantly increased in the feed reward group compared with the controls (Figure 4, p ≤ 0.036). The crf-r2 expression was also higher in the feed control group, but its mRNA levels were lower in the feed reward and air exposure groups than in control fish (p ≤ 0.044). Reduced gene expression was also noted for these treatment groups for the gene uro1 in male fish. In addition, the mr transcript levels in the male optic tectum were higher in the feed reward and air exposure groups than in the controls (Figure 4, p ≤ 0.001). In female zebrafish, the expressions of crf1 and crf-r1 were lower in feed-rewarded and air-exposed fish (Figure 3, p ≤ 0.018), but the expression of both genes was significantly higher in feed control than in feed-rewarded fish (p = 0.024). The mRNA levels of crf-r2 and crh-bp were significantly lower in all treatments than in the control animals in the female optic tectum (Figure 3, p ≤ 0.001). The expression of pomc A was not only significantly lower in all treatments than in the controls (p ≤ 0.001) but also lower in the feed reward group than in the feed control or air exposure groups (p ≤ 0.046). The uro1 transcript levels were significantly higher in all treatments than in the controls (p ≤ 0.014). In addition, the expression of gr in female fish was significantly different between the feed reward group and air-exposed fish compared with the controls (p ≤ 0.026).
The HPI axis–related genes in the rhombencephalon showed that the expression of crf-r2 in male fish was higher in the feed reward group than in the controls or the feed control group (Figure 4, p ≤ 0.04). The mRNA levels of crh-bp were found to be significantly higher in all treatment groups than in control fish (p ≤ 0.006) and also different between the feed-rewarded and air-exposed fish (p = 0.038). The expression of pomc A in the male rhombencephalon was lower in fish from the feed control group than the controls (p = 0.032). In the female rhombencephalon, the expression of crf-r2, pomc A, and crh-bp was significantly lower and the expression of uro1 significantly higher in the feed reward and feed control groups than in control fish (Figure 3, p ≤ 0.048).
Taken together, the HPI axis–related genes were regulated differently in female and male fish, and the differences were observed in all four brain parts of the fish.
3.4 Gene expression patterns of appetite-related genesInvestigations of appetite-related gene expression patterns were also performed for all four different brain parts separately, and differences in the expression patterns in female and male fish were observed. Accordingly, the expression of npy was significantly higher in the feed reward group (Figure 4, p = 0.028) and fish exposed to air (p = 0.004) in the telencephalon of male fish.
In the hypothalamus of male fish, the mRNA levels of cart were found to be higher in the feed control and air exposure groups than in the controls (Figure 4, p < 0.004). In addition, the expression of gal was significantly higher in feed control fish than in feed-rewarded or air-exposed male fish (p < 0.01). In female fish, cart expression in the hypothalamus was found to be higher in all treatment groups than in the controls (Figure 3, p < 0.002). The same pattern was observed for the mRNA levels of cck-a in female fish (p ≤ 0.024). In addition, gal expression in the hypothalamus of female fish was significantly different in air-exposed animals than in the controls or feed-control fish (p ≤ 0.03).
The analyses of appetite-related genes in the optic tectum only resulted in a significant difference in the npy expression levels in male fish of the feed reward and feed control groups compared with control fish (Figure 4, p ≤ 0.038). In female fish, the expression of cck-a was found to be significantly higher in all treatments than in the control animals (Figure 3, p < 0.001), whereas the expression of npy and gal was significantly lower in all treatments than in the control (p < 0.001) and was also different between the feed reward group and feed control or air exposure group (p ≤ 0.02).
The appetite-related genes in the rhombencephalon of male fish showed that the expression of agouti is higher in the feed control animals than in control fish (Figure 4, p = 0.046). However, the agouti transcript levels in the rhombencephalon of female fish were also found to be lower in the feed reward and feed control groups than in control fish (Figure 3, p < 0.034). The expression of cck-a and cck-b was higher in the feed reward and feed control groups than in the controls (p ≤ 0.024), which was also observed for cck-a in the air exposure group (p = 0.020).
Overall, the investigation of the appetite-related genes identified significant differences between the experimental groups, which included differences between female and male fish. In addition, the effects of the stressors on appetite gene expression were not restricted to the hypothalamus.
3.5 Gene expression patterns of serotonergic and dopaminergic genes, metabolic genes, isotocin, and opioid receptorsThe investigations of the expression patterns of the remaining genes belonging to a number of different pathways were also performed for all four different brain parts separately, and differences in the expression patterns between female and male fish were observed. In the telencephalon of male fish, the expression of dopar 2a was found to be significantly lower in air-exposed fish than in the controls (p = 0.02, Figure 4). The transcript levels of iso pre were found to be different for each treatment group (p < 0.001), and iso-r2 expression differed between controls and feed-rewarded animals and air-exposed male zebrafish (p < 0.05). Female zebrafish showed that the expression of iso pre was only increased in the telencephalon of the feed control group, whereas the expression of its receptor iso-r2 was significantly increased in feed-rewarded animals (Figure 3, p = 0.038). In the male telencephalon, the expression of mTOR was significantly higher in feed control than in feed-rewarded or air-exposed animals (p < 0.001). The opio d1b receptor only showed a higher expression in the feed control animals than in air-exposed male zebrafish (p = 0.048). Similarly, the expression of this gene was increased in female fish of the feed reward and feed control groups (Figure 3, p < 0.05). The transcript levels of the metabolic gene pyrkin were higher in control fish than in air-exposed male zebrafish (p = 0.032). By contrast, not pyrkin, but the metabolic gene gapdh was found to be differently expressed in the female telencephalon, with a significant lower expression value in the feed control group than in the controls or air-exposed fish (Figure 3, p < 0.038). The serotonin pathway–related gene tph in male fish showed a higher expression in feed-rewarded and feed control animals (p ≤ 0.032), whereas the expression of the 5 ht-r (Figure 4) showed lower expression in feed-rewarded and air-exposed animals than in the control animals (p ≤ 0.006). Furthermore, the difference between the feed control and air-exposed animals was found to be significantly different (p = 0.048). In female zebrafish, the expression of 5 ht-r was higher in feed control and air-exposed animals than in control or feed-rewarded fish (Figure 3, p ≤ 0.022). The tph mRNA levels in female fish were higher in all treatment groups than in the controls (Figure 3, p ≤ 0.01).
The same gene set in the hypothalamus showed that the mRNA expression of iso pre and iso-r2 was significantly lower in all male treatment groups than in the controls (Figure 4, p < 0.004). Similar to the telencephalon, in the hypothalamus, the expression of mTOR was significantly higher in the male feed control animals than in feed-rewarded or air-exposed animals (p < 0.001). Furthermore, again, the opio d1b receptor showed the highest expression in the feed control animals in male zebrafish. In addition, the transcript levels of the metabolic gene pyrkin in male fish were higher in feed control fish than in control fish and feed-rewarded zebrafish (p < 0.010). The mRNA expression of gapdh was also the highest in the feed control group in male animals, with a significant difference between the controls (p < 0.001) and feed-rewarded animals (p = 0.032). In male zebrafish, 5 ht trb was found to be significantly increased in fish belonging to the feed control group compared with the controls or air-exposed animals (Figure 4, p ≤ 0.032). A significant difference between these treatment groups was observed for 5 ht-r in the same animals (p ≤ 0.044). The female zebrafish showed significantly lower dopar 2a transcript levels in the hypothalamus of fish in all treatment groups than the controls (Figure 3, p ≤ 0.028). The mRNA expression of iso pre in the female hypothalamus was significantly higher in feed control fish and fish exposed to air than in the controls (Figure 3, p < 0.02). In addition, the expression of iso-r1 in the female hypothalamus was significantly higher in all treatments than in the controls (Figure 3, p ≤ 0.006), and the expression of iso-r2 was only significantly higher in air-exposed fish than in the controls (p = 0.018). In the female hypothalamus, the mRNA expression of 5 ht-r was also found to be higher in the feed reward and air exposure groups than in the controls (Figure 3, p ≤ 0.022).
The analyses for the optic tectum showed that the iso-r2 mRNA expression in male fish was significantly lower in all treatments than in the controls (Figure 4, p ≤ 0.028). The serotonin pathway–related gene tph in male fish showed a lower expression in feed-rewarded and air-exposed animals (p ≤ 0.02), whereas 5 ht-r showed different expression levels between all three treatments (p ≤ 0.04). Moreover, the th2 transcript levels in the optic tectum of male fish were significantly different between all treatment groups and controls (p ≤ 0.008) and also between the feed-rewarded fish and air-exposed animals (p = 0.014). Similar to the observations for the hypothalamus in female fish, the expression of dopar 2a and mTOR was significantly lower in the optic tectum in all female treatment groups than in the controls (Figure 3, p ≤ 0.01). The expression of citrsyn and pyrkin in female fish was significantly higher in all treatment groups than in control fish (p ≤ 0.036), whereas the mRNA levels of succdh were higher only in the feed reward group than in the controls (p = 0.018). In addition, the expression of opio d1b was higher only in the feed reward group than in the controls (p = 0.036). The iso-r1 transcript levels were higher in all treatment groups than in the control animals (p ≤ 0.006), but the expression of iso-r2 was found to be different between the feed reward and air exposure groups compared with the controls (p ≤ 0.026). In addition, the expression of iso-r2 was different between female fish from the feed reward group and feed control group (p = 0.04). Finally, the th1 mRNA levels were significantly different in the optic tectum of female fish between the feed reward and feed control groups compared with the controls (p ≤ 0.042) but only significant for th2 between the feed reward group and control fish (p ≤ 0.006).
For the same gene set in the male rhombencephalon, it was noted that the expression of dopar 2a was found to be significantly lower in air-exposed and feed-rewarded fish than in the controls (Figure 4, p ≤ 0.04). The expression of gapdh was higher in the feed reward group, and the expression of succdh was significantly lower than in the controls (p ≤ 0.004). The expression of mTOR was high in the feed control group compared with fish of the other groups (p < 0.001). Similarly, mRNA levels of opio d1a and opio d1b were significantly higher in the feed control group than in the controls (p ≤ 0.038). In addition, the expression of iso pre was lower in the feed control group than in the remaining groups in the male rhombencephalon (p ≤ 0.001), whereas the transcript levels of iso-r2 were significantly lower in all treatment groups than in the controls (p ≤ 0.028). Moreover, the expression of tph in the male rhombencephalon was significantly lower in the feed reward group than in the controls or feed controls (p ≤ 0.044). Finally, the expression of the 5 ht-r was significantly lower in the feed reward group than in control fish (p = 0.044). By contrast, the mRNA expression of gapdh and citrsyn in the rhombencephalon of female fish showed a higher transcript level in the feed reward and feed control groups than in the zebrafish of the control group (p ≤ 0.032). The expression of opio d1b in female fish was significantly higher in the feed-rewarded animals than in the controls (p = 0.038). In addition, female fish showed a lower expression of mTOR in air-exposed fish than in the other groups (Figure 3, p ≤ 0.042). Furthermore, the expression of iso pre was lower in the feed reward and feed control groups (p ≤ 0.002), but the expression of iso-r1 was higher in all treatments than in control fish (p ≤ 0.036). Finally, the transcript levels of th1 in female fish were found to be higher in the feed reward and feed control groups than in the controls (p ≤ 0.034), and the expression of the 5 ht-r was only higher in the air-exposed animals than in control fish (p = 0.016).
3.6 Principal component analysesThe principal component analyses for all genes and brain parts are shown in Supplementary Figures S2–S5. Based on these results, the two most important genes for each brain regulation pathway have been selected and used for additional PCA. For the genes in the telencephalon of female fish, cck-a and uro1 were identified as genes with strong relevance for the expression patterns in this brain part (Figure 5). By contrast, the contribution of cck-a to the outcome of gene expressions in the male telencephalon was considerably low compared with the contribution of genes such as opio d1b and gapdh (Figure 6). Moreover, the genes with the highest influence in the hypothalamus of female fish were agouti and opio d1a, which were also found in the top eight of the list for male hypothalamus, but in the latter, the influence of succdh, ckap, and dopar3 was even higher than that. In the optic tectum of female fish, the genes agouti and ckap had the strongest ability to explain the variability in the data sets, whereas in the male optic tectum, this was observed for the two opioid receptors (Figure 6). Finally, the female rhombencephalon showed the strongest influence of the genes opio d1a and uro1, whereas eiFa and opio d1b were influential in the male rhombencephalon.

Figure 5. Gene expression analysis with PCAs for the most contributing genes in each of the four brain parts showing their representation on the factor map as cos2 values (i.e., high cos2 values indicate high influence on the gene expression patterns), where the numbers on the x-axis (Dim1) and y-axis (Dim2) indicate the percentage of variance in the datasets that is explained by the first two components of the PCA of female fish; n = 6 per treatment.
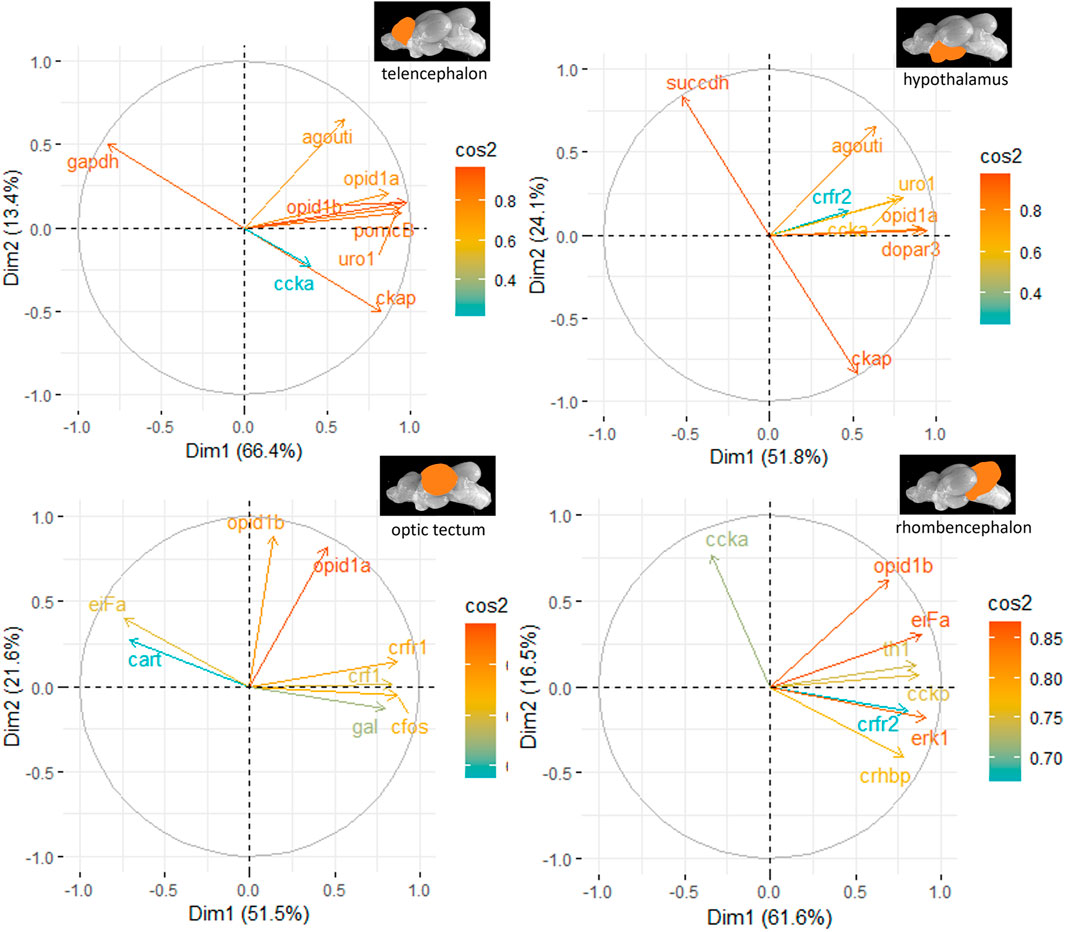
Figure 6. Gene expression analysis with PCAs for the most contributing genes in each of the four brain parts showing their representation on the factor map as cos2 values (i.e., high cos2 values indicate high influence on the gene expression patterns), where the numbers next to the x-axis (Dim1) and y-axis (Dim2) indicate the percentage of variance in the data sets that is explained by the first two components of the PCA of male fish; n = 6 per treatment.
3.7 Classification and feature importanceThe random forest classification reached 100% accuracy for the genes selected for the test data set in the telencephalon of female and male fish but only 78% accuracy for the genes in the male hypothalamus. The latter result was caused by lower classification success for the treatment in the feed group and in the feed control group (Table 1).

Table 1. Results of the precision, recall, and F1 scores for the random forest models for the test data sets of each brain part separately for female and male fish; models based on the bootstrapped gene expression data sets; n = 100 per treatment group.
The classification of genes in the telencephalon of male fish with random forest models showed that the entire data set of 39 genes resulted in 100% accuracy for the classification (Table 2). According to the feature importance for gene expression patterns of this brain part, the top ten genes from this list together contributed to 71.22% of the importance for the model (Table 3), and two genes (iso pre and crf-r2) were sufficient to maintain the accuracy of the random forest model (Table 2). Similarly, of the 39 genes in the female telencephalon in total, the top ten genes from the feature importance list made up 66.9% of the importance for the model, and nine genes were sufficient to achieve 100% accuracy of the classification. For the hypothalamus of male fish, the top ten genes from this list together contributed to 60.22% of the importance for the model, whereas the same calculation for the female hypothalamus accounted for 65.85% of the importance for the model (Table 3). Similarly, the top ten genes from this list together contributed to 62.04% of the importance for the model for genes in the optic tectum of male fish, whereas the same calculation for the female hypothalamus accounted for 69.48% of the importance for the model (Table 3). For the rhombencephalon of male fish, the top ten genes from this list together contributed to 64.36% of the importance for the model, whereas the same calculation for the female hypothalamus accounted for 68.92% of the importance for the model (Table 3). The feature lists for each brain part commonly consist of HPI axis–related and serotonergic genes (highlighted in Table 3).
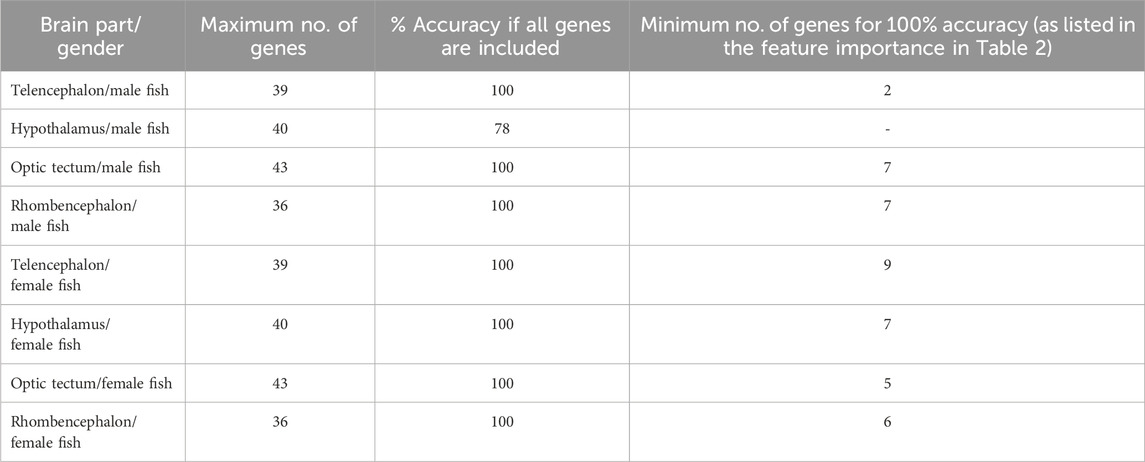
Table 2. Results of the random forest models for each brain part separately for female and male fish. The accuracy of the model achieved by including all available gene expression data was compared with the minimum number of genes to calculate the same accuracy of the model; models based on the bootstrapped gene expression data sets; n = 100 per treatment group.
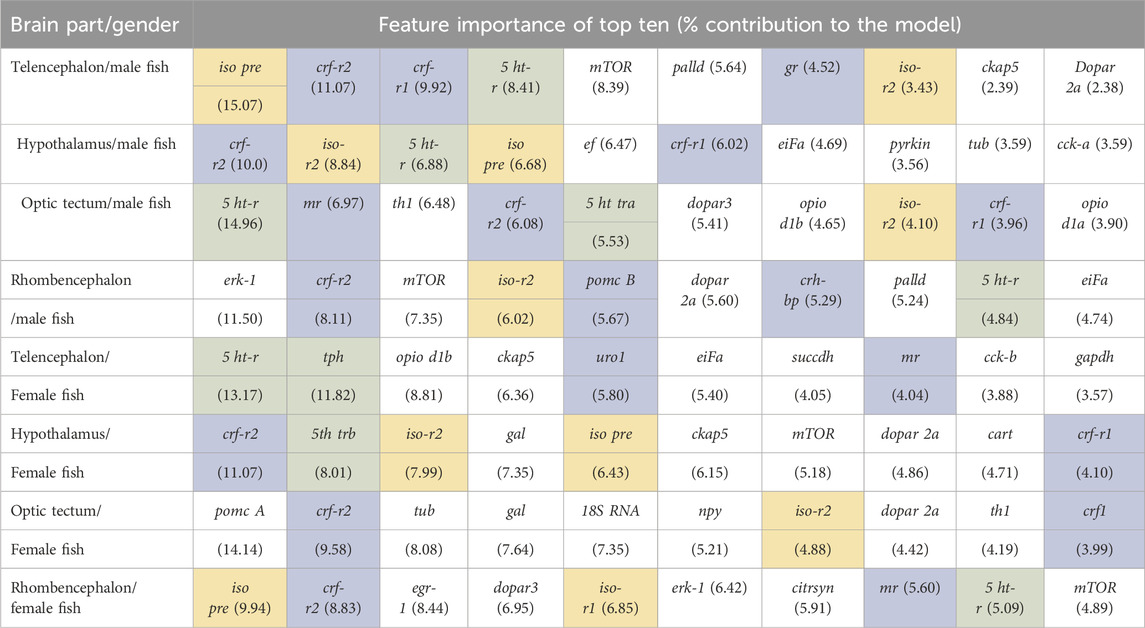
Table 3. Feature importance of the random forest models for each brain part separately for the full range of genes available for female and male fish; models based on the bootstrapped gene expression data sets; n = 100 per treatment group; HPI axis–related genes are shaded in blue, serotonergic genes are shaded in green, and isotocin-related genes are shaded in yellow.
4 Discussion4.1 Morphological chara
留言 (0)