
記住我

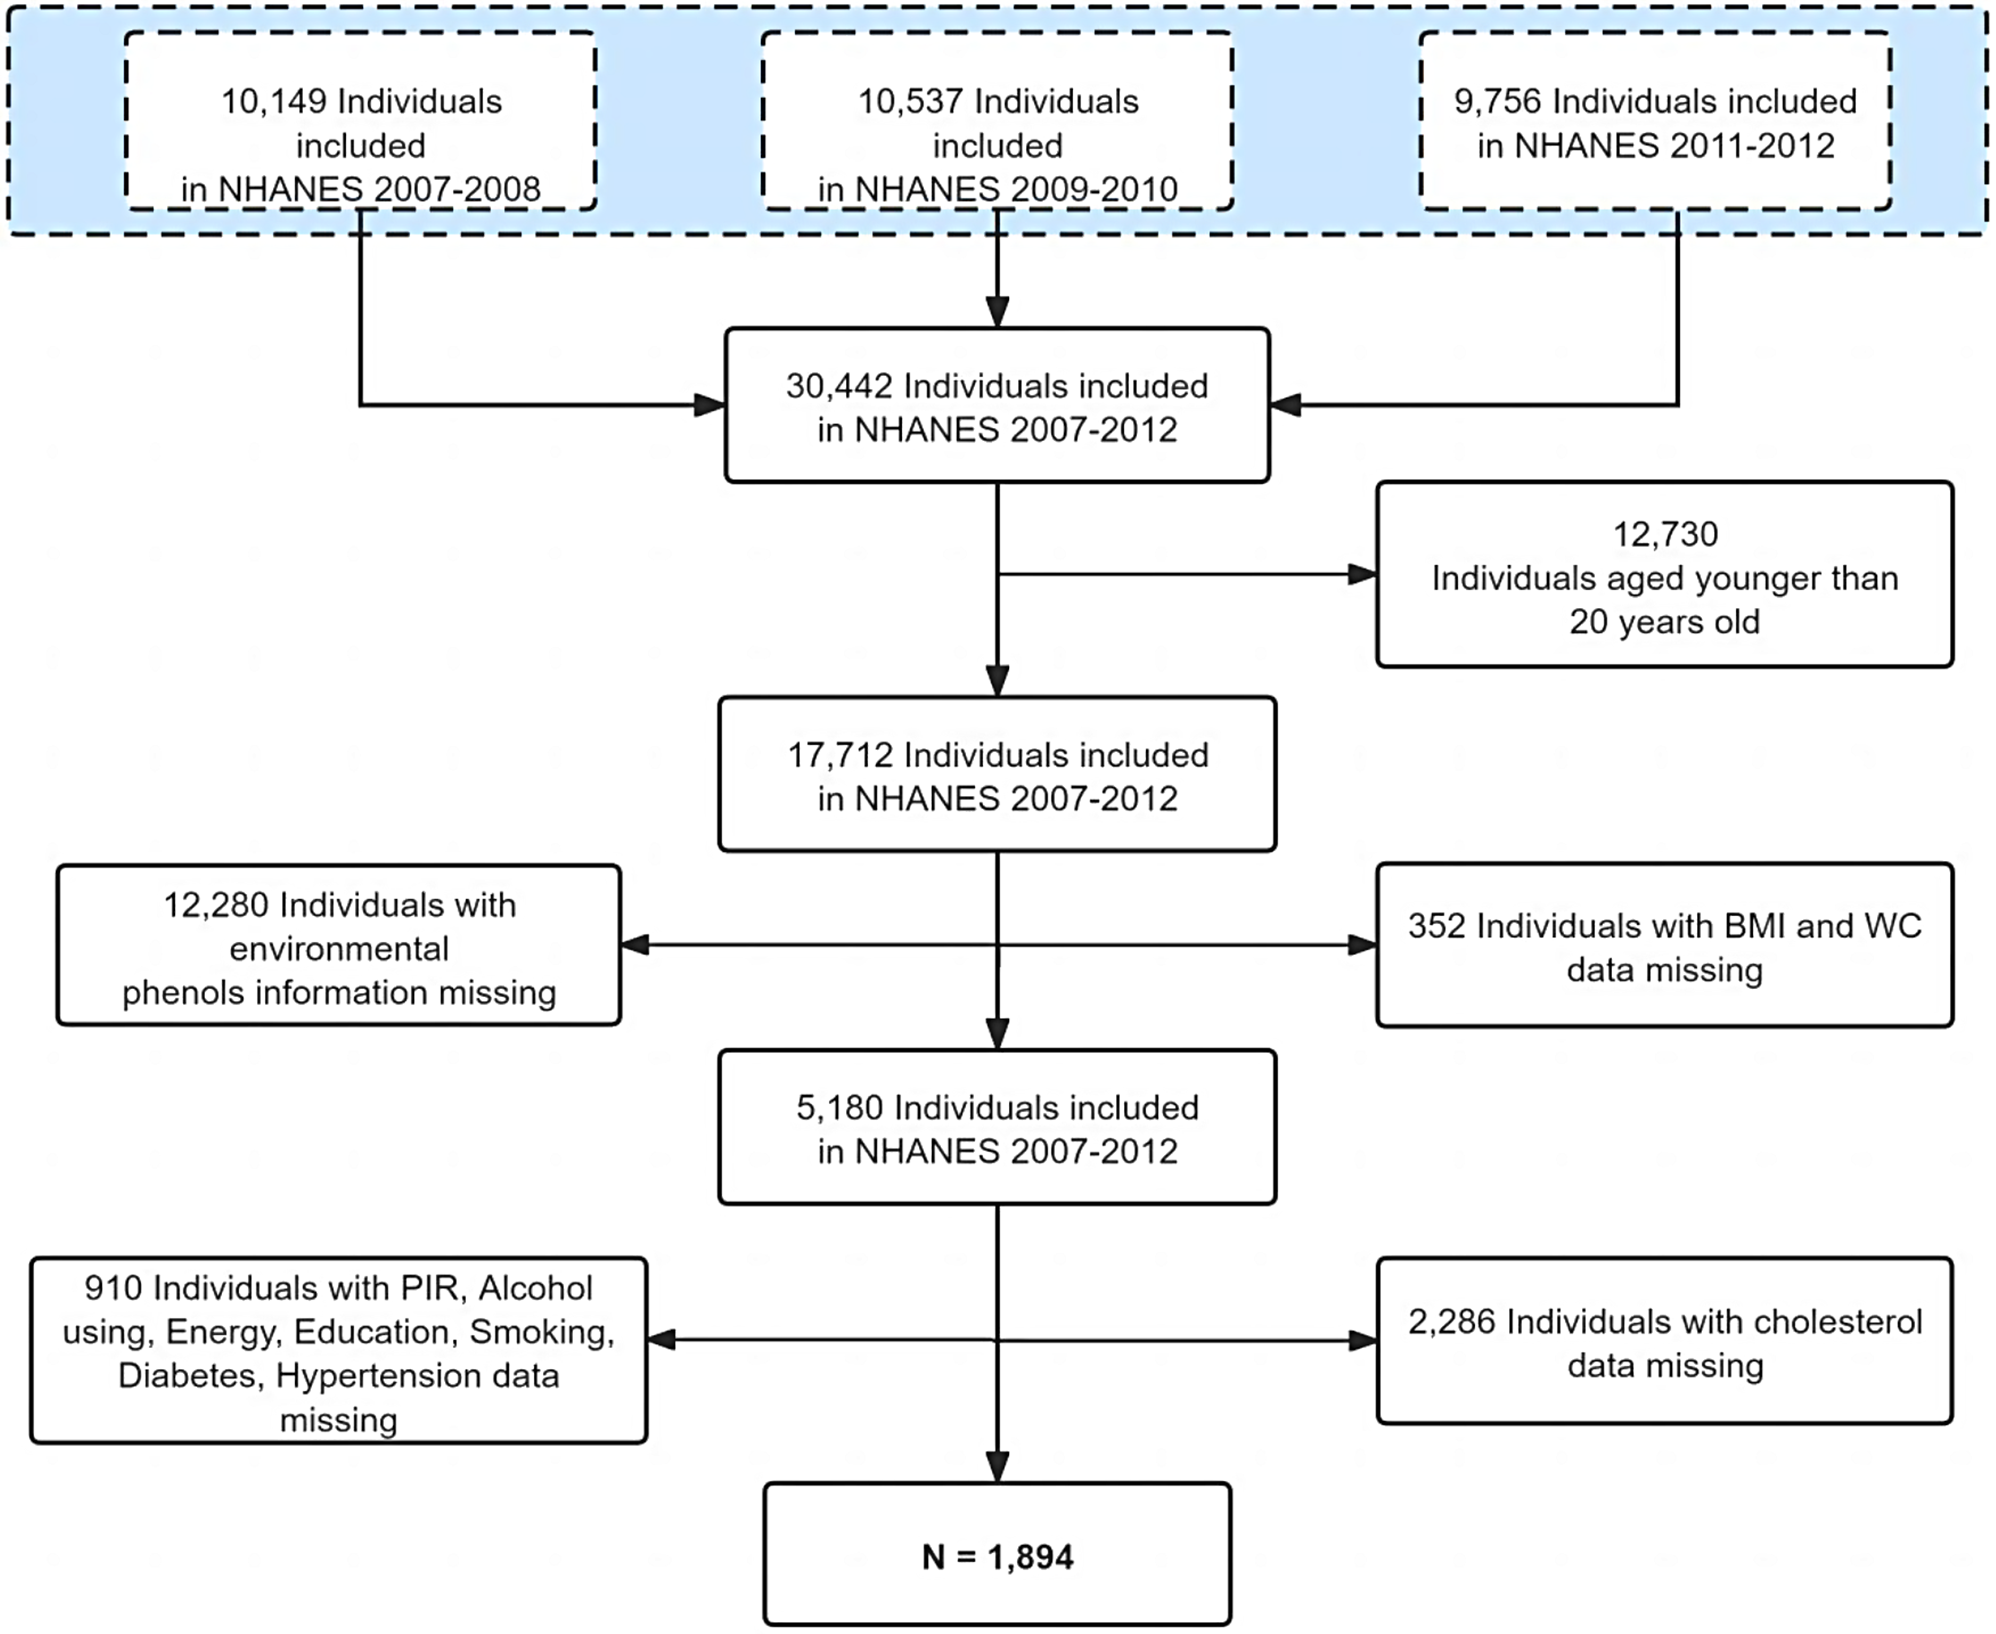


A total of 4566 medical records of elderly patients were analyzed in this study (Fig. 1). The optimal cut-off value of the TyG index to predict POD was determined to be 8.678, with an area under the ROC curve (AUC) of 0.56 (Fig. 2). Table 1 presents the characteristics of the patients divided into two groups based on the critical value of the TyG index. The study included 2423 (53.1%) male participants and 2143 (46.93%) female participants. The median age of the participants was 70.0 years (interquartile range: 67.0–74.0), and the median TyG index was 8.74 (interquartile range: 8.34–9.17). The overall incidence of POD in the study participants was 3.6%. The group with TyG > 8.678 exhibited a higher incidence of POD, a higher proportion of female participants, lower prevalence of smoking and alcohol history, elevated levels of GSP and ALT, higher BMI, Hb, total cholesterol, low-density LDL, glucose, and triglyceride levels, lower levels of HDL, serum Cre, PT, and total bilirubin, and a younger age compared to the group with TyG < 8.678 (all P < 0.05). The clinical characteristics of participants by quartile of TyG index were presented in Supplementary Table 2.
Fig. 1
Flow chart of the study population. ASA, American society of anesthesiologists
Fig. 2
ROC curve of TyG index for predicting POD in surgical elderly patients with T2DM. The optimal cut-off point was 8.678 with specificity and sensitivity of 44.6% and 65.7% (area under the curve 0.5637, 95% CI: 0.5199 to 0.6075). ROC, receiver operating characteristic; TyG: triglyceride-glucose; POD, postoperative delirium; T2DM, type 2 diabetes mellitus; CI, confidence interval
Table 1 Clinical characteristics of participants by TyG indexAssociation between the TyG index and POD incidenceThe ROC curve analysis demonstrated the ability of the TyG index to predict the risk of POD (Fig. 2). And the RCS plots showed a “S-shape” association between TyG index and POD (Fig. 3). The P for non-linear relationship is 0.74, indicating the linear relationship between TyG index and POD incidence. The relationship between POD and the TyG index, grouped by the cut-off value, is presented in Table 2. In the univariate analysis (Supplementary Table 3), the odds ratio (OR) of the group with TyG > 8.678 was 1.668 (95% CI: 1.210–2.324, P = 0.002). In the multivariate logistic regression models (Supplementary Table 4), the adjusted ORs of the TyG > 8.678 group in model 1, model 2, and model 3 were 1.590 (95% CI: 1.133–2.252, P = 0.008), 1.661 (95% CI: 1.199–2.325, P = 0.003), and 1.603 (95% CI: 1.137–2.283, P = 0.008), respectively. These results demonstrate that a TyG > 8.678 is an independent risk factor for POD in elderly patients with T2DM.
Fig. 3
Restricted cubic spline plots. The relationship between the TyG index and OR of POD. OR, odd ratio; POD, postoperative delirium. The gray background shows the distribution of TyG index
Table 2 Association between TyG index and POD with logistic regression modelsThe TyG index was also analyzed as a continuous variable. In the univariate analysis (Supplementary Table 3), the OR of the TyG index was 1.379 (95% CI: 1.084–1.749, P = 0.008). In the multivariate logistic regression models (Supplementary Table 5), the adjusted ORs of the TyG index in model 1, model 2, and model 3 were 1.268 (95% CI: 0.977–1.640, P = 0.072), 1.335 (95% CI: 1.047–1.698, P = 0.019), and 1.255 (95% CI: 0.962–1.631, P = 0.092), respectively. Notably, as a continuous variable, the TyG index was only significant in model 2, which included intraoperative variables.
The participants were further divided into four groups (group 1: TyG ≤ 8.338, group 2: 8.338 < TyG ≤ 8.736, group 3: 8.736 < TyG ≤ 9.171, group 4: TyG > 9.171) based on the quartiles of the TyG index levels (Supplementary Table 6). Group 1 served as the reference. In the univariate analysis (Supplementary Table 3), the incidence of POD increased with higher TyG index levels, and the OR of group 4 was 1.728 (95% CI: 1.100-2.762, P = 0.019). In the multivariate logistic regression models, the adjusted ORs of group 4 in model 1, model 2, and model 3 were 1.518 (95% CI: 0.936–2.498, P = 0.095), 1.666 (95% CI: 1.055–2.677, P = 0.031), and 1.489 (95% CI: 0.913–2.464, P = 0.115), respectively. Similar to the results obtained using the using the TyG index as a continuous variable to predict POD, only group 4 of the TyG index in model 2 showed significance in the multivariate logistic regression analysis.
Subgroup analysis for sexThe comparison between male and female participants with respect POD incidence, age, comorbidities (cerebrovascular disease, chronic kidney disease, depression, and anxiety), American Society of Anesthesiologists (ASA) grade, AST, urine output, albumin level, glucose level, emergency surgery, blood loss, duration of MAP < 60 mmHg, and platelet count revealed no significant differences (all P > 0.05) (Supplementary Table 7). However, compared to males, females had a higher prevalence of hypertension and cardiac disease, elevated BMI, TyG index, total cholesterol, LDL, HDL, and triglyceride levels, lower prevalence of COPD, GSP, ALT, Hb, WBC count, total bilirubin, and Cre levels, shorter PT and duration of anesthesia, and received lesser volumes of crystalloid and colloid solutions (all P < 0.05).
To explore the differences between males and females in the relationship between the TyG index and POD incidence, a subgroup analysis was conducted (Table 3). In male patients, the relationship between the TyG index and POD incidence was not significant in any of the models. In contrast, the adjusted OR of the TyG index as a continuous variable in females was 1.95 (95% CI: 1.28–2.96, P < 0.001), and the adjusted OR of TyG index > 8.678 in females was 2.24 (95% CI: 1.25–4.19, P = 0.01). When analyzed based on interquartile groups of the TyG index, the adjusted OR of group 4 in females was 2.68 (95% CI: 1.18–6.78, P = 0.03). The P values for interaction analyses between gender and TyG index as a continuous variable, a binary variable and a quartile variable in Model 3 were 0.067, 0.435 and 0.046, respectively. There is interaction effect between gender and TyG index to predict POD when TyG acts as a continuous and a quartile bariable. These results from the subgroup analysis indicate that the TyG index is a more effective predictor of POD incidence in females among elderly patients with T2DM.
Table 3 Subgroup analysis for sexSensitivity analysisThe E-value is established as 2.59 in present study due to the OR of TyG index > 8.678 to predict POD in Model 3. As ORs of most risk factors for POD were less than 2.59 in other reported studies, the results of present study could be considered to have good robustness.
As shown in Supplementary Table 8, OR of the group with TyG > 8.678 in the univariate analysis was 1.593 (95% CI: 1.146–2.238, P = 0.006). In the multivariate logistic regression models, the adjusted ORs of the TyG > 8.678 group in model 1, model 2, and model 3 were 1.493 (95% CI: 1.054–2.133, P = 0.025), 1.648 (95% CI: 1.763–2.331, P = 0.004), and 1.582 (95% CI: 1.108–2.279, P = 0.012), respectively. These sensitivity analysis has strengthened the the validity of results that TyG index has a effective prediction for POD in elderly patients with T2DM.
留言 (0)