
記住我


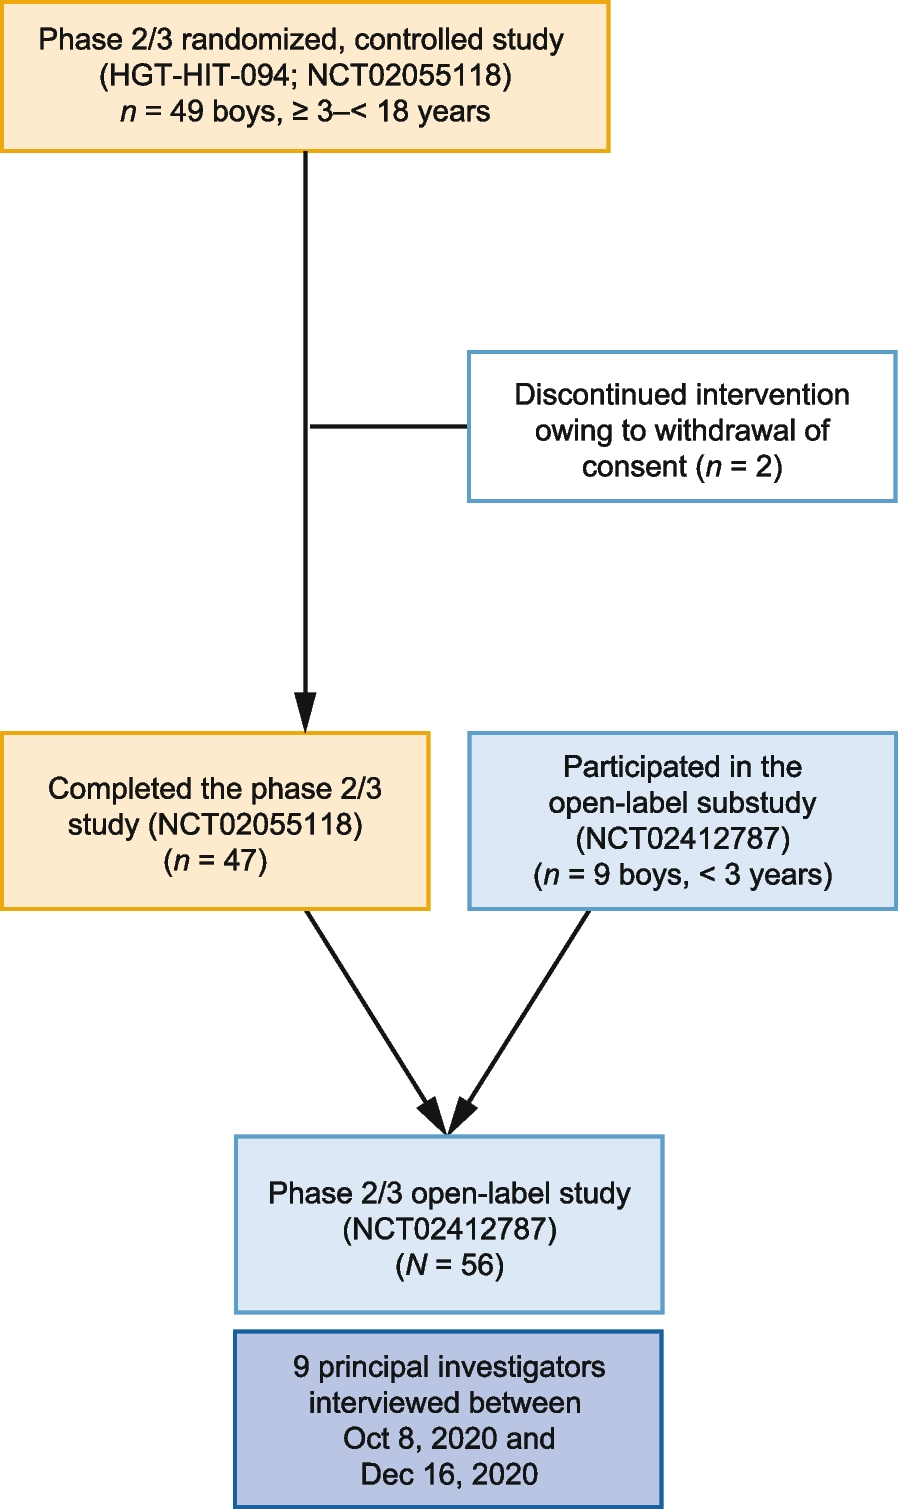
Patients were randomly assigned 2:1 to cipaglucosidase alfa plus miglustat or alglucosidase alfa plus placebo treatment groups in the PROPEL study. The baseline characteristics of the 123 patients with LOPD in the intent-to-treat population of the PROPEL study have been described previously [16]. Briefly, 55% of the patients were female, the overall mean age was 46.8 years (SD 13.3), 85% of the patients were White, 77% had been treated previously with ERT, and most of the patients had the intervening sequence splice site mutation c.-32-13 T > G. For the cipaglucosidase alfa plus miglustat and the alglucosidase alfa plus placebo treatment groups, the mean/median baseline 6MWD (m) was 357.9/359.5 m (SD 111.8) and 351.0/365.5 m (SD 121.3), the mean/median baseline 6MWD (% predicted) was 57.8/59.2% (SD 15.8), and 56.0/56.1% (SD 17.3), and the mean/median baseline sitting FVC (% predicted) was 70.7/70.0% (SD 19.6) and 69.7/71.0% (SD 21.5), respectively.
Anchor-based MCID6MWD (% predicted) change from baseline at Week 52 was significantly positively correlated with PROMIS PF change from baseline at Week 52 (R = 0.374, p < 0.0001) and with SGIC at Week 52 (R = 0.304, p = 0.00086), and it was positively correlated with FVC (% predicted) change from baseline at Week 52 (R = 0.175, p = 0.05527, Supplementary Fig. S1).
In the overall PROPEL population, the 6MWD (% predicted) MCID was 4.93%, 4.45%, and 4.85%, with PROMIS PF, SGIC, and FVC as anchors, respectively. The anchor-based 6MWD (% predicted) MCIDs in subgroups of baseline severity are summarized in Table 1. 6MWD MCIDs increased with more meters walked at baseline until a plateau was reached. Varying the definitions of the anchor-based 6MWD (% predicted) MCIDs in the sensitivity analysis (i.e., using ≥ 2- or ≥ 4- -point change from baseline in PROMIS PF to define the MCID or using an SGIC overall well-being score of ≥ 5, = 4 or = 5 to define the MCID) revealed that those MCIDs were consistently higher than the 6MWD (% predicted) MCIDs shown in Table 1, except when the MCID was defined by an SGIC overall well-being score = 4 (Supplementary Table S1). Varying the subgroups in the sensitivity analysis yielded similar results, i.e., 6MWD (% predicted) MCIDs increased with baseline meters walked, reaching a plateau (Supplementary Table S2). The increase in anchor-based 6MWD MCIDs with more meters walked at baseline is also illustrated in Fig. 1 (Supplementary Fig. S2 for the sensitivity analysis).
Table 1 Anchor-based MCID for 6MWD (% predicted)Fig. 1
Anchor-based MCIDs for 6MWD (% predicted) for subgroups of patients with baseline 6MWD < 150 m, < 300 m, < 400 m, < 450 m, and ≥ 450 m. Abbreviations: 6MWD 6-min walk distance, m meter, FVC forced vital capacity, FVC ≥ 3% MCID based on patients with an FVC (% predicted) change from baseline of ≥ 3% at Week 52, MCID minimal clinically important difference, PROMIS Patient-Reported Outcome Measures Information System, PROMIS ≥ 0 MCID based on patients with a PROMIS Physical Function short form 20a (PF) change from baseline of ≥ 0 points at Week 52, PROMIS ≥ 2 MCID based on patients with a PROMIS PF change from baseline of ≥ 2 points at Week 52, PROMIS ≥ 4 MCID based on patients with a PROMIS PF change from baseline of ≥ 4 points at Week 52, SGIC Subject’s Global Impression of Change, SGIC ≥ 4 MCID based on patients with an SGIC of ≥ 4 points at Week 52, SGIC ≥ 5 MCID based on patients with an SGIC of ≥ 5 points at Week 52, SGIC = 4 MCID based on patients with an SGIC of = 4 points at Week 52, SGIC = 5 MCID based on patients with an SGIC of = 5 points
The results were similar when anchor-based MCIDs were calculated for 6MWD (meters) using varying MCID thresholds and subgroup definitions (Supplementary Table S3). The anchor-based MCIDs varied between 23.70 m to 40.11 m for the overall PROPEL population, depending on the method, were lower for baseline 6MWD < 150 m (-14.33 to 11.53 m) and increased with baseline meters walked, reaching a plateau.
Subgroup analysis based on baseline BMI levels usually showed highest 6MWD (% predicted) MCIDs in the normal weight subgroup, ranging from 5.87% to 7.20%, and lowest 6MWD (% predicted) MCIDs in the obese subgroup with MCIDs ranging from 0.66% to 3.24% (Table 1). Sensitivity analyses varying the MCID thresholds for the BMI subgroups revealed similar results to those shown in Table 1 i.e., the highest MCIDs were generally observed in the normal BMI subgroup and lowest MCIDs in the obese subgroup (Supplementary Table S1).
Analyses of medical history or comorbidities subgroups revealed higher anchor-based MCIDs in the subgroup of patients having had a knee or hip surgery in the past than in the overall PROPEL population, ranging from 6.74% to 14.10% (Table 1 and Supplementary Table S1). Subgroups of COPD and heart failure had too small sample sizes to draw robust conclusions.
Distribution-based MCIDDistribution-based MCIDs for 6MWD (% predicted) in the overall PROPEL population were 8.11% (1/2 SD), 6.48% (0.4 SD), and 5.40% (1/3 SD) when baseline 6MWD (% predicted) values were considered, and 3.4% (1/2 SD), 2.72% (0.4 SD), and 2.27% (1/3 SD) when the 6MWD (% predicted) change from baseline at Week 52 values were considered for the MCID calculation. The MCIDs for 6MWD (% predicted) using a distribution-based approach are summarized in Table 2. The lowest MCIDs (% predicted) were observed in patients with impaired walking abilities (i.e., patients having baseline 6MWD < 150 m), with MCIDs ranging from 1.44 (1/3 SD of the change from baseline at Week 52 values) to 3.37 (1/2 SD of the baseline values). The MCIDs increased with more meters walked at baseline until reaching a plateau and even a decline for the subgroup of patients with baseline 6MWD ≥ 450 m. Similar results were observed in sensitivity analyses applying different subgroup definitions (Supplementary Table S4). The increase in distribution-based 6MWD MCIDs with more meters walked at baseline is also illustrated in Fig. 2 (Supplementary Fig. S3 for the sensitivity analysis).
Table 2 Distribution-based MCID for 6MWD (% predicted)Fig. 2
Distribution-based MCID for 6MWD (% predicted) for subgroups of patients with baseline 6MWD < 150 m, < 300 m, < 400 m, < 450 m, and ≥ 450 m. Abbreviations: 6MWD 6-min walk distance, m meter, MCID minimal clinically important difference, SD standard deviation, SD BL MCID based on the standard deviation at baseline, SD CFBL MCID based on the standard deviation at change from baseline at Week 52
Similar results were observed for the distribution-based MCID for 6MWD when calculated in meters, with a range of 38.1 to 57.2 m for the overall PROPEL population. The MCIDs were lower for baseline 6MWD < 150 m (7.5 to 11.3 m) and increased with baseline meters walked, reaching a plateau (Supplementary Table S5).
Distribution-based MCIDs in baseline BMI subgroups were highest in the subgroup with a normal weight, except for the MCIDs when using baseline 6MWD (% predicted) values to derive the MCID, where the highest values were observed in the obese subgroup. Inspection of the distribution of the 6MWD (% predicted) values in this subgroup revealed that unexpectedly, many patients had low and high baseline 6MWD (% predicted) values, leading to a larger SD and thus a larger MCID in that subgroup.
Analyses of medical history or comorbidities subgroups revealed similar distribution-based MCIDs in the subgroup of patients having had a knee or hip surgery in the past as compared to MCIDs for the overall PROPEL population, ranging from 2.13% to 7.32% (Table 2). Subgroups of COPD and heart failure had too small sample sizes to draw robust conclusions.
留言 (0)