
記住我
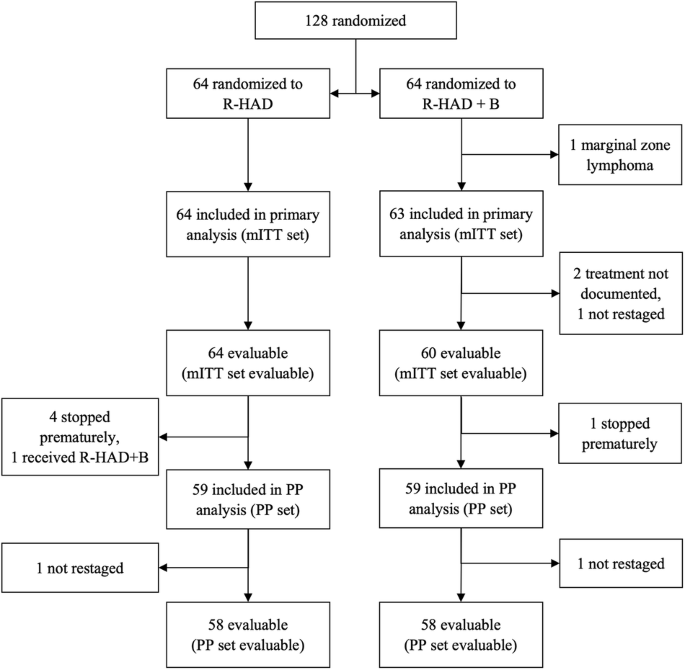


In this study, a total of 998 consecutive patients who received care at the Blood Diseases Hospital of the Chinese Academy of Medical Sciences and had cytogenetic data examined by FISH at the time of diagnosis (testing for gain/amp(1q), del(13q), del(17p), del(1p), and IgH translocation) were included (Fig. S1). The median follow-up time for the entire cohort was 38.2 months. The baseline characteristics of all patients are detailed in Table 1. The median age was 60 years, with 48.7% and 23.2% of patients classified as International Staging System (ISS) stage III and R-ISS stage III, respectively. Del(13q), del(17p), and del(1p) were observed in 47.8%, 6.5%, and 5.1% of patients in our cohort, respectively. Moreover, more than half of the patients at diagnosis were found to have IgH translocation (578/998, 57.9%) (Table 1).
Table 1 Baseline characteristics.Since the cutoff value of gain/amp(1q) is different among different centers (Table S1). We thus did not set a specific cutoff value for gain/amp(1q) in this study to investigate the prognostic significance of gain/amp(1q) at different clonal sizes. Gain/amp(1q) was detected in 513 patients at the time of diagnosis. Furthermore, significantly shorter PFS and OS were observed in patients with gain/amp(1q) compared to those without gain/amp(1q) (PFS: 29.5 months vs. 41.9 months, HR = 1.58, 95% CI: 1.33–1.89, P < 0.001; OS: 50.4 months vs. 71.0 months, HR = 1.67, 95% CI: 1.34–2.07, P < 0.001) (Fig. 1A, D).
Fig. 1: The prognostic significance of gain/amp(1q) at different clonal sizes in NDMM.
Kaplan-Meier analysis of PFS (A) and OS (D) by gain/amp(1q). Kaplan-Meier analysis of PFS (B) and OS (E) by clonal size. NDMM patients with gain/amp(1q) are grouped using cutoff values of 20% and 50%. Kaplan–Meier analysis of PFS (C) and OS (F) by clonal size. NDMM patients with gain/amp(1q) are grouped using a cutoff value of 20%. NS not significant, *P < 0.05, ***P < 0.001, by two-sided log-rank test.
Based on the proportion of PCs involved, patients with gain/amp(1q) were subsequently categorized into four groups: no gain/amp(1q), gain/amp(1q) ≤ 20%, gain/amp(1q) 20%-50%, and gain/amp(1q) > 50%. The median PFS was 41.9 months, 52.2 months, 32.5 months, and 26.8 months, respectively, while the median OS was 71.0 months, 71.6 months, 52.9 months, and 46.5 months for these four subgroups (Fig. 1B, E). Our results showed that patients with gain/amp(1q) ≤ 20% had similar survival to those without gain/amp(1q), while patients with gain/amp(1q) in less than 50% of clonal PCs (20–50%) and gain/amp(1q) in more than 50% of clonal PCs experienced similar survival. Further investigation revealed that patients with gain/amp(1q) ≤ 20% experienced significantly better survival compared to those with gain/amp(1q) > 20% (Fig. S2A, S2B). Thus, based on the survival curves, 20% was then selected as the cutoff value to divide the patients into three subgroups: no gain/amp(1q), gain/amp(1q) ≤ 20%, and gain/amp(1q) > 20%. The median PFS was 28.9 months, and the median OS was 49.4 months for patients with gain/amp(1q) > 20% (Fig. 1C, F).
In line with prior studies (Table S2) [10, 12, 18, 21, 26], including our own investigation [4, 28], our findings indicated that gaining more than one copy of 1q did not confer additional prognostic significance to gain/amp(1q). There was no significant difference in median PFS and median OS between patients with three copies and those with four or more copies of 1q (PFS: 29.6 months vs. 29.5 months, P = 0.640; OS: 50.4 months vs. 50.0 months, P = 0.963) (Fig. S3A, S3B). However, for patients with gain/amp(1q) ≤ 20%, having four or more copies of 1q was associated with a significantly shorter PFS compared to having three copies of 1q (56.7 months vs. 19.8 months, P = 0.029) (Fig. S3C). Moreover, for patients with gain/amp(1q) ≤ 20%, our results indicated no significant difference in OS between patients with three copies or four or more copies of 1q (Fig. S3D). Patients with at least four copies of 1q also exhibited comparable PFS and OS compared to those with three copies of 1q, either for gain/amp(1q) 20%-50% or gain/amp(1q) 50% (Fig. S3E–3H). Furthermore, no statistically significance was observed between different clonal sizes and copy numbers in patients with gain/amp(1q) in the aspect of both PFS and OS (Fig. S4A, S4B).
Copy number and clonal size evolution of gain/amp(1q) and its relationship with CIN phenotype in MMTo provide further insights into the characteristics of clonal size and copy number of gain/amp(1q) and their relationship, we initially grouped the patients into three categories based on the copy number of 1q: three copies, four copies, and five or more copies. The median clonal sizes of gain/amp(1q) for these groups were 71%, 78%, and 83.5%, respectively. Notably, significantly higher clonal sizes were observed in patients with five or more copies or four copies of 1q compared to those with three copies of 1q (Fig. 2A). Subsequently, we applied cutoff values of 20% and 50% to categorize the clonal size of gain/amp(1q) into minor (≤20%), subclonal (20–50%), and dominant (>50%) clones. In our cohort, 55, 76, and 382 NDMM patients were identified with a minor, subclonal, and dominant clone of gain/amp(1q), respectively (Fig. 2B).
Fig. 2: Copy number and clonal size evolution of gain/amp(1q) and its relationship with CIN phenotype in MM.
A The proportion of cells with gain/amp(1q) is indicated by the height of the bar on the y-axis. The proportion of cells with three, four, or ≥five copies of 1q21 in each sample is indicated by green, blue, and red, respectively. A total of 513 NDMM with gain/amp(1q) are ordered from the lowest to the highest proportion of cells with gain/amp(1q) from right to left on the x-axis. B Volin plot of the cell fraction of gain/amp(1q) in patients detected with different copy numbers of 1q. NS, not significant, *P < 0.05, **P < 0.01, by two-sided unpaired Student’s t tests. C Bar plot comparing the proportions of distribution of patients detected with different copy numbers of 1q according to the clonal size of gain/amp(1q). NS, not significant, ***P < 0.001, by 2-sided χ² test. D Frequency bar plot showing the number of CAs other than gain/amp(1q) detected by FISH among NDMM patients without gain/amp(1q) or with different clonal sizes of gain/amp(1q). E Comparison of proportion of high-risk CAs among patients without gain/amp(1q) or with different clonal sizes of gain/amp(1q). F Percentage frequency of genetic changes associated with minor, subclonal, and clonal gain/amp(1q). G Scatter plots demonstrate the relationship of gain/amp(1q) clonal fraction and del(13q) clonal fraction for patients with concomitant gain/amp(1q) and del(13q). H Scatter plots demonstrate the relationship of gain/amp(1q) clonal fraction and del(1p) clonal fraction for patients with concomitant gain/amp(1q) and del(1p).
Our results showed that patients received similar treatment regimens. For patients without gain/amp(1q), with a minor, subclonal, and dominant clone of gain/amp(1q), PI-containing regimens were received in 75%, 81%, 82% and 73% of them, respectively (P = 0.173). Furthermore, there was also no significant difference in the proportion of patients in these four groups who received first-line autologous hematopoietic stem cell transplantation (dominant: 34%; subclonal: 42%; minor: 26%; no gain/amp(1q): 34%, P = 0.416) (Table S3).
Interestingly, our results showed similar copy number architecture between patients with a minor clone and those with a dominant or subclonal clone of gain/amp(1q) (Fig. 2C). Further analyses revealed that progressively higher numbers of CAs were detected in patients without gain/amp(1q) and in those with a minor, subclonal, and dominant clone of gain/amp(1q). For patients without gain/amp(1q), with a minor, subclonal, and dominant clone of gain/amp(1q), at least one CA was detected in 65%, 73%, 83%, and 88% of them, respectively (Fig. 2D). Moreover, for patients with no gain/amp(1q) and with a minor clone of gain/amp(1q), 18% and 22%, respectively, had at least one high-risk CA, while for patients with a subclonal and a dominant clone of gain/amp(1q), 27% and 43% of patients were detected with at least one high-risk CA at the time of diagnosis, respectively (Fig. 2E).
Despite being a rare high-risk cytogenetic event at diagnosis, more cases of del(17p) were observed in patients with a dominant clone of gain/amp(1q) (Fig. S5A). Our results also showed that patients with concomitant gain/amp(1q) and del(17p) had slightly higher copy numbers of 1q compared to those with only gain/amp(1q) (Fig. S5B). For standard-risk CAs such as del(13q) and del(1p), a dominant or subclonal clone, compared to a minor clone or no gain/amp(1q), was associated with higher rates of del(13q) (dominant: 62%; subclonal: 46%; minor: 40%; no gain/amp(1q): 38%) and del(1p) (dominant: 8%; subclonal: 8%; minor: 5%; no gain/amp(1q): 3%) (Fig. 2F).
Additionally, a significant correlation of clonal size was observed for patients with concomitant del(13q) and gain/amp(1q) (R = 0.44, P < 0.001) (Fig. 2G). A similar correlation was likewise observed for patients with both del(1p) and gain/amp(1q) (R = 0.53, P < 0.001) (Fig. 2H). Finally, regarding clinical characteristics such as the ISS stage, the rates of ISS stage III were increased in patients with a dominant or subclonal clone of gain/amp(1q) compared to those with a minor clone of gain/amp(1q) or no gain/amp(1q) (Fig. S5C). In summary, the associations between gain/amp(1q) clonal size and increasing rates of other secondary CAs suggested that gain/amp(1q) was related to the CIN phenotype in MM.
Concomitant del(1p) and minor clone of gain/amp(1q) are associated with a poor clinical outcome in MMPrevious studies have demonstrated that jumping translocations of 1q can lead not only to the amplification of 1q but also to other secondary CAs in MM, including MYC translocations and del(16q) [15, 16]. We hypothesized that there might be a subset of patients with a minor clone of gain/amp(1q) who had worse survival due to concomitant high-risk genetic factors. To investigate this, we initially compared the survival outcomes of patients with both a minor clone of gain/amp(1q) and at least two CAs (other than gain/amp(1q)) to those with a minor clone of gain/amp(1q) and fewer than two CAs. Despite similar PFS between these two groups (+1q ≤ 20% & <2 CAs: 52.9 months vs. +1q ≤ 20% & ≥2 CAs: 33.7 months, P = 0.370) (Fig. 3A), patients with +1q ≤ 20% & ≥2 CAs experienced significantly shorter OS than those with +1q ≤ 20% & <2 CAs (+1q ≤ 20% & <2 CAs: 71.6 months vs. +1q ≤ 20% & ≥2 CAs: 40.6 months, P = 0.035) (Fig. 3B).
Fig. 3: Concomitant del(1p) and minor clone of gain/amp(1q) are associated with a poor clinical outcome in MM.
A, B Kaplan-Meier analysis of PFS (C) and OS (D) by gain/amp(1q) and number of CAs detected by FISH. Kaplan-Meier analysis of PFS (C) and OS (D) by gain/amp(1q) and del(1p) detected by FISH. NS, not significant, *P < 0.05, **P < 0.01, ***P < 0.001, by two-sided log-rank test.
Further analysis revealed significantly shorter PFS and OS in patients with concomitant del(1p) and a minor clone of gain/amp(1q) compared to those with a minor clone of gain/amp(1q) and without del(1p) (PFS: +1q ≤ 20% & no del(1p): 52.2 months vs. +1q ≤ 20% & del(1p): 13.4 months, P < 0.001; OS: +1q ≤ 20% & no del(1p): 71.6 months vs. +1q ≤ 20% & del(1p): 33.6 months, P < 0.001) (Fig. 3C, D). In conclusion, our results suggested that although a minor clone of gain/amp(1q) was not inherently associated with a poor prognosis in MM, the coexistence of more than two CAs in a subset of patients with a minor clone of gain/amp(1q) might lead to a poor prognosis in this specific group of patients.
Clonal evolution of minor clone of gain/amp(1q)Given recent findings that a minor clone of gain/amp(1q) at diagnosis can become a major clone at relapse in MM [6], and considering previous studies that have suggested a significantly higher proportion of patients carrying gain/amp(1q) at relapse compared to diagnosis [5, 8], we delved into the clonal evolution of the minor clone of gain/amp(1q) by conducting longitudinal FISH examinations at diagnosis and relapse. In our cohort, 13 patients with a minor clone of gain/amp(1q) at diagnosis underwent FISH testing at their first relapse (Table S4, S5). Our results indicated that nine cases (69%) saw the evolution of the minor clone at diagnosis into a subclonal/dominant clone at first relapse, while two patients (15%) maintained a minor clone of gain/amp(1q) both at diagnosis and relapse. Only two patients (15%) experienced the loss of the minor clone of gain/amp(1q) at relapse (Fig. 4A). Further analysis revealed that the clonal evolution of the minor clone of gain/amp(1q) was accompanied by an expanded clonal size of del(17) or by newly acquired del(17p) (Fig. 4B). Finally, patients with a significant increase in clonal size of gain/amp(1q) had significantly shorter PFS than patients with a subclonal and a dominant clone of del(1q) at diagnosis (Fig. 4C), while no significant differences were observed for OS among these groups (Fig. S6A). Thus, our study suggested that a minor clone of gain/amp(1q) was prone to evolve into a dominant clone at relapse and was also correlated with the clonal evolution of del(17p).
Fig. 4: Clonal evolution of minor clone of gain/amp(1q).
A The change in cell fraction of gain/amp(1q) between two time points. Different colors demonstrate three different evolutionary patterns of gain/amp(1q) between diagnosis and relapse. B The change in cell fraction of del(17p) between two time points. Different colors demonstrate three different evolutionary patterns of gain/amp(1q) between diagnosis and relapse. C Kaplan-Meier analysis of PFS by different gain/amp(1q) clonal sizes at diagnosis and evolved minor clone between two time points. NS not significant, *P < 0.05, **P < 0.01, ***P < 0.001, by two-sided log-rank test.
留言 (0)