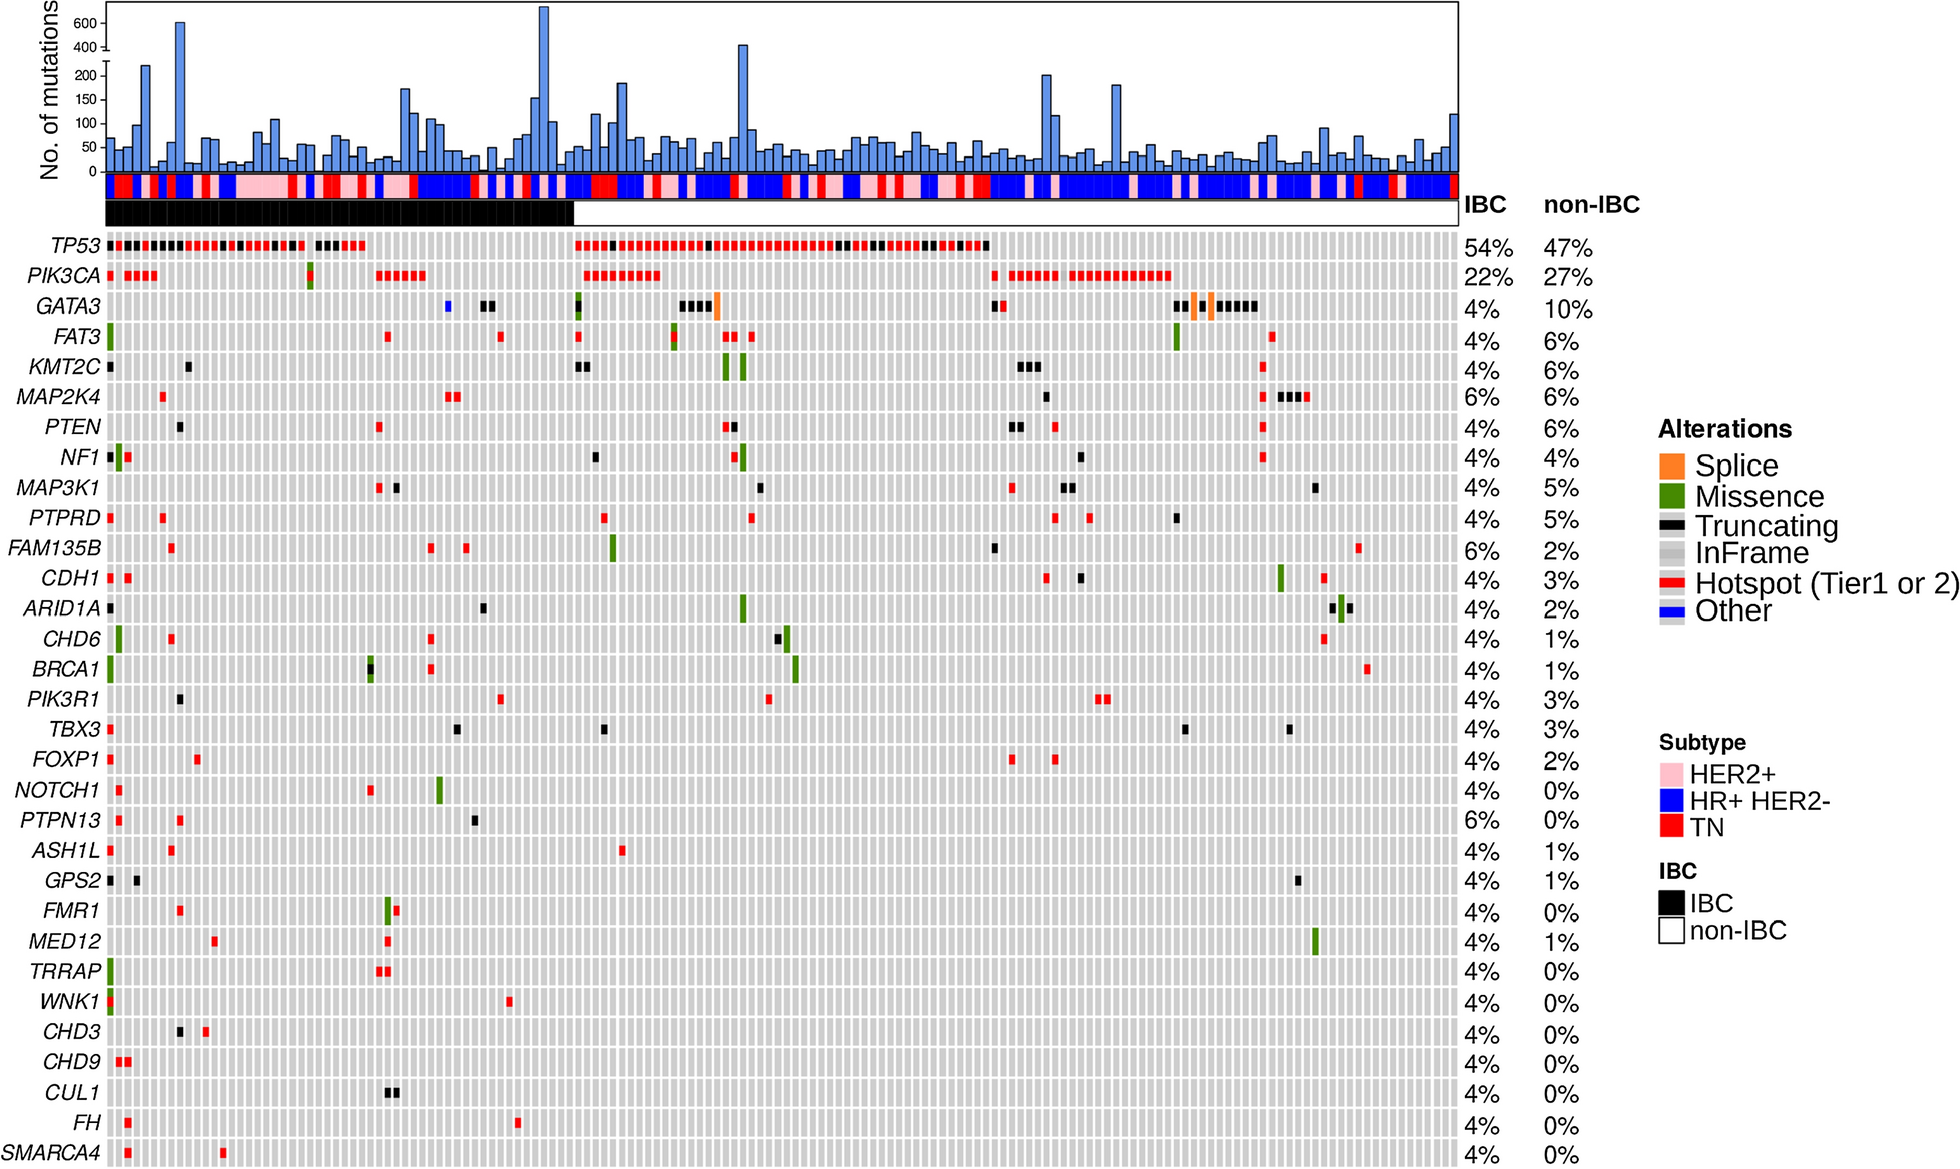
Patients and tissue samples
Tumor specimens from 66 patients with cSCC surgically resected at Xiangya Hospital of Central South University from January 1, 2017 to August 31, 2023 were selected for this study. Immediately after excision, all specimens were placed in tissue-protecting solution and quickly transferred to liquid nitrogen for cryopreservation. Tissue samples were used to prepare immunohistochemical sections. Neoplastic and paracancerous tissues from 5 cSCC patients were also used to extract mRNA and protein. Patient clinicopathologic features were obtained from medical records. Tumor pathological diagnosis was made according to the American Joint Committee on Cancer (AJCC) TNM Classification for Cutaneous Carcinoma of the Head and Neck (8th ed., 2017). The study was approved by the Ethics Committee of Xiangya Hospital, and written informed consent was obtained from all participants.
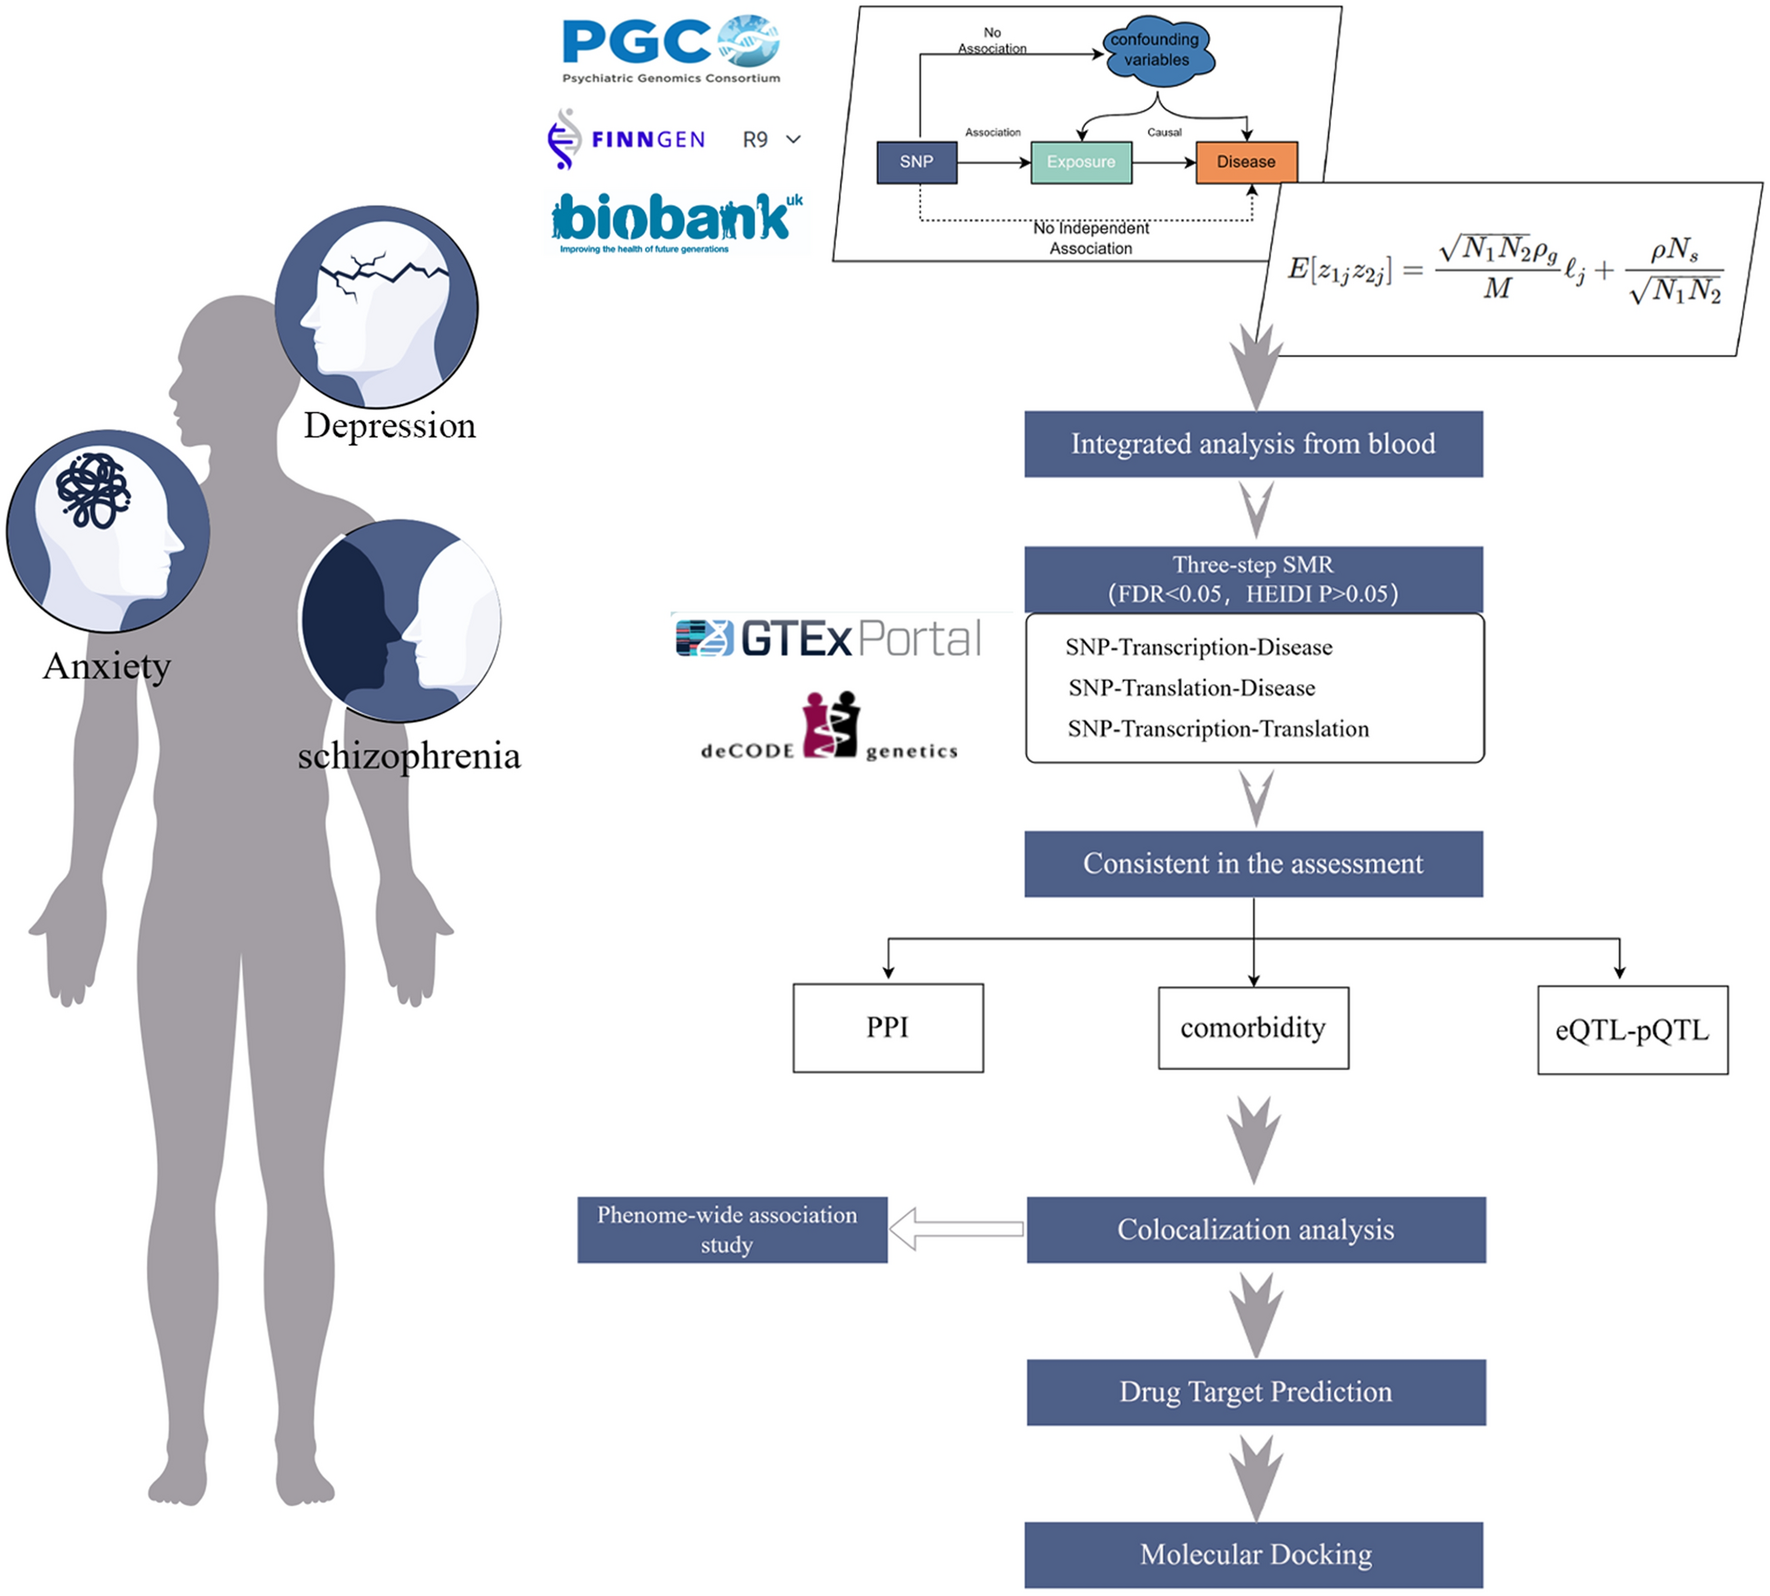
Public databases
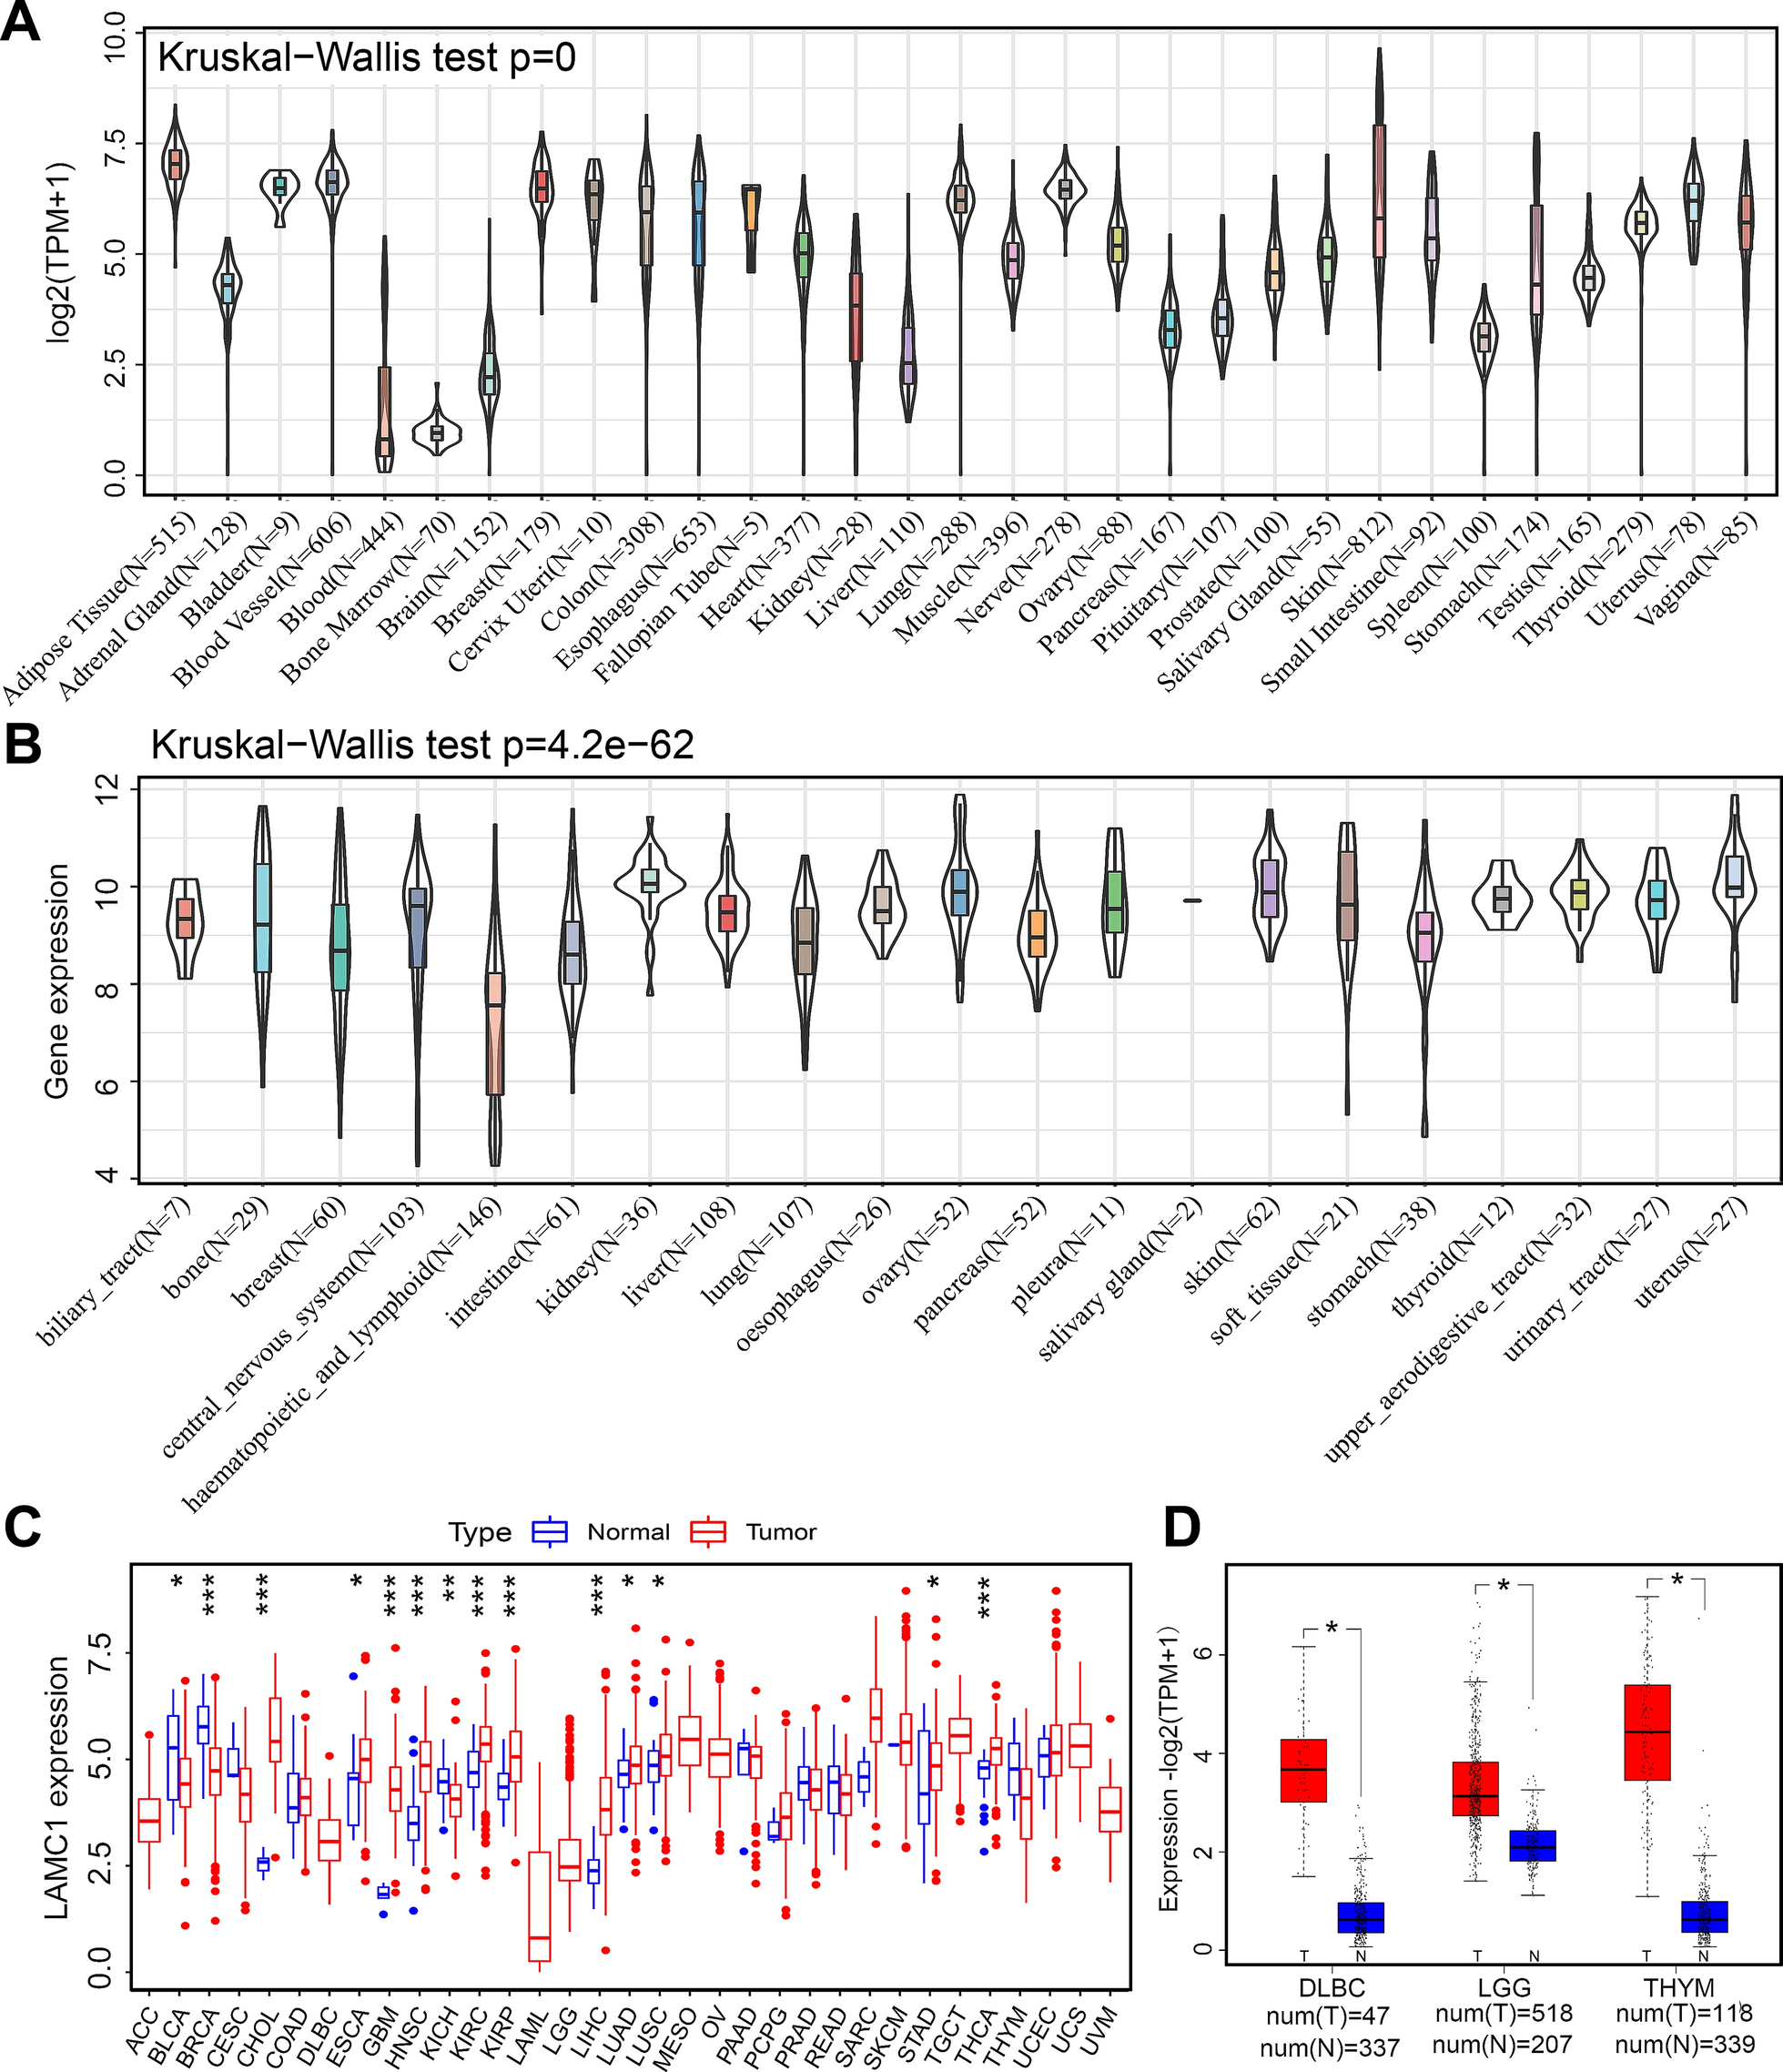
cSCC datasets GSE32628 and GSE66359 were selected from the GEO database for gene selection. The TCGA and GTEx databases were used to analyze survival curves. GSE63329 was used to analyze key signaling pathways.
Cell lines and culture
Human cSCC cell lines (A431, Colo16, SCL1) and normal human keratinocyte HaCat cells were purchased from Abiowell or BIOESN Biotech with STR certification reports. Cells were cultured in high-glucose DMEM (Gibco) supplemented with 10% fetal bovine serum and 1% penicillin/streptomycin at 37 °C with 5% CO2.
Immunohistochemistry (IHC)
Immunohistochemistry was employed to evaluate the expression levels of specific markers in human cSCC tissue samples (FSTL1, ZEB1) as well as in nude mouse subcutaneous tumor tissue samples (FSTL1, Ki67, ZEB1, E-cadherin, N-cadherin, Vimentin). Sections were deparaffinized in an oven at 65 °C for 2 h. They were subsequently hydrated through a series of solutions: xylene 1, xylene 2, anhydrous ethanol, 95% ethanol, 80% ethanol, and 60% ethanol. Antigen retrieval was performed by heating sections in boiling sodium citrate solution for 10 min. After cooling to room temperature, endogenous peroxidase activity was blocked using 3% hydrogen peroxide. Sections were then incubated in 10% BSA (BioFroxx; neoFroxx GmbH) for 30 min to prevent nonspecific binding. Primary antibodies were applied and left to incubate overnight at 4 °C. The secondary antibody was applied and incubated for 1 h. Subsequently, sections were stained using DAB (3,3’-Diaminobenzidine) (Servicebio, Wuhan, China). Hematoxylin staining (Servicebio, Wuhan, China) was performed for 5 min followed by differentiation in 1% hydrochloric acid alcohol for 3 s. Sections were rinsed under running water for 5 min and dehydrated through a series of ethanol concentrations: 60%, 80%, 95%, anhydrous ethanol, xylene 2, and xylene 1. Finally, the sections were sealed with neutral resin before being photographed under an optical microscope (Nikon N2-DMi8). Staining assessment was independently conducted and graded by two investigators. Staining intensity was categorized into 0 (negative), 1 (weak), 2 (moderate), and 3 (strong). The extent of staining was stratified as 0 (0%), 1 (1–25%), 2 (26–50%), 3 (51–75%), and 4 (76–100%), representing the percentage of positively stained area within the entire tumor invasion region. The final score for FSTL1 expression was derived by combining the staining intensity with the extent of staining, resulting in a scale from 0 to 7. Samples were then categorized into two groups: Low FSTL1 expression (0–3 points) and high FSTL1 expression (4–7 points). Sections were further classified into high and low expression groups based on these criteria. Detailed information about the antibodies utilized can be found in Table S1.
Immunocytochemistry (ICC)
Cells were washed three times with PBS and subsequently fixed with 4% paraformaldehyde (Servicebio, Wuhan, China) for 15 min. Following fixation, cells were permeabilized with 0.1% Triton X-100 (Servicebio, Wuhan, China) for 5 min. Blocking was performed using 5% BSA (BioFroxx; neoFroxx GmbH) for 30 min. Primary antibodies were incubated overnight at 4 °C. The fluorescent secondary antibody was then applied and incubated for 1 h. Subsequently, cells were stained with DAPI for 15 min, mounted with a neutral resin, and photographed using an inverted fluorescence microscope (Nikon ECLIPSE Ti2). To achieve co-localization of primary antibodies from the same species in immunofluorescence, we employed the Tyramide Signal Amplification (TSA) technique. Experimental procedures were carried out in accordance with the guidelines provided by the double-label multiplex immunofluorescence kit (Abiowell Biotechnology Co.Ltd) for simultaneous detection of multiple targets in the same cellular context. Detailed information about the antibodies utilized can be found in Table S1.
Western blot
Cells and tissues were lysed in RIPA buffer (Servicebio, Wuhan, China) with protease inhibitors (Servicebio, Wuhan, China). Total proteins were extracted and separated by 10% SDS-PAGE, then transferred to PVDF membranes. Membranes were blocked with 5% skim milk (BD, USA) for 1 h at room temperature before incubating with primary and secondary antibodies. Protein bands were visualized using ECL reagent (Servicebio, Wuhan, China). Antibody information is listed in Supplementary Table S1.
Total RNA extraction and quantitative real-time PCR
Total RNA from cells or tissues was extracted using Trizol (TransGen Biotech, China) and reverse transcribed into cDNA with the Evo M-MLV RT Kit (Accurate Biology, China). qPCR was performed on the Vii7 system (Applied Biosystems). Relative RNA expression was calculated by the -ΔΔCt method. Primer sequences are listed in Supplementary Table S2.
Plasmid construction, lentivirus generation, and cell infection
Empty vector served as a control. Target genes were knocked down or overexpressed in cSCC cell lines using sequences listed in Supplementary Table S3. siRNA and shRNA were designed with Beijing Tsingke Biotech Co., Ltd. Overexpression plasmids were designed with WZ Biosciences Inc. Lentiviruses were generated by transfecting 293T cells with the pLKO.1, psPAX2 and pMD2.G systems. Stable knockdown or overexpression was selected with puromycin.
Cell counting kit 8 assay (CCK8 assay)
cSCC cells were seeded in 96-well plates (2,000 cells/well). After transfection, 10 µL CCK-8 reagent (Beyotime, Shanghai) was added to each well and incubated for 2 h in the dark. Absorbance at 450 nm was measured with a SpectrumMax Plus microplate reader (Molecular Devices).
Colony formation assay
cSCC cells were seeded in 6-well plates at 500 cells/well for 2 weeks. Cells were fixed with 4% paraformaldehyde, stained with crystal violet, and colonies were counted under a microscope.
Scratch assay
Confluent cSCC cell monolayers in 12-well plates were scratched vertically with a sterile pipette tip. Images were captured at 0 h and 24 h post-scratch under a Nikon inverted microscope.
Transwell assay
For the investigation of cellular invasion, the upper chambers were pre-coated with matrix gel (354,248; Corning, Inc.) following the provided instructions before cell seeding. Transwell chambers (pore size, 8 μm; Corning, Inc.) were set up with 500µL of serum-free DMEM in the upper chamber and 500µL of 20% FBS DMEM in the lower chamber. cSCC cells were seeded in the upper chamber. After 24 h, the cells were fixed using 4% paraformaldehyde, stained with crystal violet, and imaged using a Nikon microscope. Cell counting was performed.
Flow cytometry-based cell apoptosis detection assays
Treated cells were enzymatically dissociated using EDTA-free trypsin, and subsequently collected by centrifugation. The collected cells were then resuspended in binding buffer, following the instructions provided with the Annexin V-FITC/PI kit (Y6002M, UElandy Inc). A 5 µL volume of YF®488-Annexin V was added to the buffer and gently mixed. Subsequently, another 5 µL of PI staining solution was added to the buffer and mixed gently. The mixture was incubated for 10 min at room temperature in the absence of light. Apoptosis was promptly detected using a flow cytometer with an excitation wavelength of 488 nm.
Cell cycle analyses via flow cytometry
The treated cells underwent trypsin digestion, and the resulting supernatant was removed post-centrifugation. Following two washes by centrifugation using 1x PBS, the cells were subjected to overnight fixation with 70% cold ethanol. After removing the fixative with 1x PBS, the cells were resuspended in 250 µL of 1x PBS. A 2 µL volume of RNase A (AWR0154, Abiowell) at a concentration of 1 mg/mL was added, followed by incubation in a water bath at 37 °C for 40 min. Subsequently, 50 µL of PI staining solution (G1021, Servicebio) was added, and the cells were incubated for 20 min, shielded from light. Flow cytometry was then performed.
Subcutaneous tumor model
Tumor cells (100 µl 10^7 cells/ml) were injected subcutaneously into the left axilla of nude mice (4 weeks old) to form subcutaneous tumors. Mice were weighed every 3 days. Tumor weight and volume were measured after mice were sacrificed. Tumor volume was calculated as (length*width^2)/2. Tumors were paraffin-embedded for H&E and immunohistochemical staining. The study was approved by the Institutional Animal Care and Use Committee of Central South University.
Co-immunoprecipitation assay
A431 cell total protein was extracted with ice-cold RIPA buffer with a protease inhibitor cocktail (Servicebio, Wuhan, China). Cell lysates were collected and immunoprecipitated with 2 µg of antibody or IgG control. Antibody/IgG immunoprecipitates were gently rotated at 4 °C overnight. Protein A/G Agarose (Selleck, Houston, USA) was used to pull down antibodies. After three PBS washes, immunoprecipitated proteins were added to 5X sample buffer and boiled at 95 °C for 5 min.
Fluorescence in situ hybridization (FISH)
THOC7-AS1 probes were designed and synthesized by Servicebio Technology Co., Ltd., who also provided the FISH kit. Briefly, tumor cells on coverslips were fixed in 4% paraformaldehyde and hybridized with probes overnight. Nuclei were stained with 1 µg/mL DAPI. Images were acquired on a Nikon fluorescence microscope.
RNA pull-down assay
Biotinylated THOC7-AS1 sense/antisense probes were designed and synthesized by WZ Biosciences Inc. Probes were incubated with cell lysates and magnetic beads overnight at 4 °C. After purification, enriched proteins underwent silver staining and Western blot analysis.
RNA binding protein immunoprecipitation (RIP)
The PureBinding® RNA Immunoprecipitation Kit (Geneseed, Guangzhou, China) was used for RIP per manufacturer’s protocol. Cell lysates were incubated with IgG control or anti-OCT1 antibody conjugated to magnetic beads. After purification, immunoprecipitated RNAs were isolated and analyzed by qPCR.
Chromatin immunoprecipitation (ChIP)
ChIP was performed using the Chromatin Immunoprecipitation Kit (Beyotime, Shanghai, China) per manufacturer’s instructions. Cells were fixed with 1% formaldehyde and crosslinked chromatin was sonicated to 200–1000 bp fragments, which were immunoprecipitated. Protein/DNA complexes were eluted and analyzed by real-time quantitative PCR. ChIP primer sequences are shown in Supplementary Table S4.
Dual-luciferase reporter assay
FSTL1 promoter sequences were designed and synthesized by WZ Biosciences Inc. The FSTL1 promoter was cloned into the pGL3-promoter vector. After seeding cSCC cells in 6-well plates for 48 h, the luciferase reporter plasmid and 10 ng pRL-TK Renilla plasmid were co-transfected using Lipofectamine 8000 (Beyotime, Shanghai, China). Luciferase and Renilla signals were detected 48 h post-transfection using the Dual Luciferase Reporter Kit (TransGen Biotech, China).
Statistical analysis
Data were analyzed using GraphPad Prism 9.0. Student’s t-test compared differences between two groups. One-way ANOVA was used to analyze differences between three groups. Correlations between continuous variables were analyzed by Spearman’s correlation. Categorical data were assessed by chi-square test or Fisher’s exact test. Experiments were conducted in triplicate. p < 0.05 was considered statistically significant.


留言 (0)