
記住我


This prospective study received ethical approval from the Ethics Committee of Jinling Hospital, a prominent Chinese tertiary-level teaching hospital, on September 29, 2022 (Approval No: 2022DZKY-084-01). The study was duly registered with the Chinese Clinical Trial Registry under the registration number ChiCTR2300068562 (registration date: 23/02/2023). Prior to participation, all eligible patients provided comprehensive written informed consent. Inclusion criteria were: Individuals aged between 18 and 65 years, classified as ASA physical status I or II, and scheduled for elective surgery under general anesthesia. Patients were excluded if they had a medical history of hypertension, diabetes mellitus, acute kidney injury, coagulation dysfunction, implanted pacemaker/cardioverter devices, tricuspid failure, right-sided heart disease, portal hypertension, obstructive lung diseases, had taken angiotensin-converting enzyme inhibitors or angiotensin receptor blockers; or were undergoing procedures in lateral or prone positions. Additionally, patients with incomplete data (pertaining to SCV, MAP, or HR) during the study period were excluded from the trial.
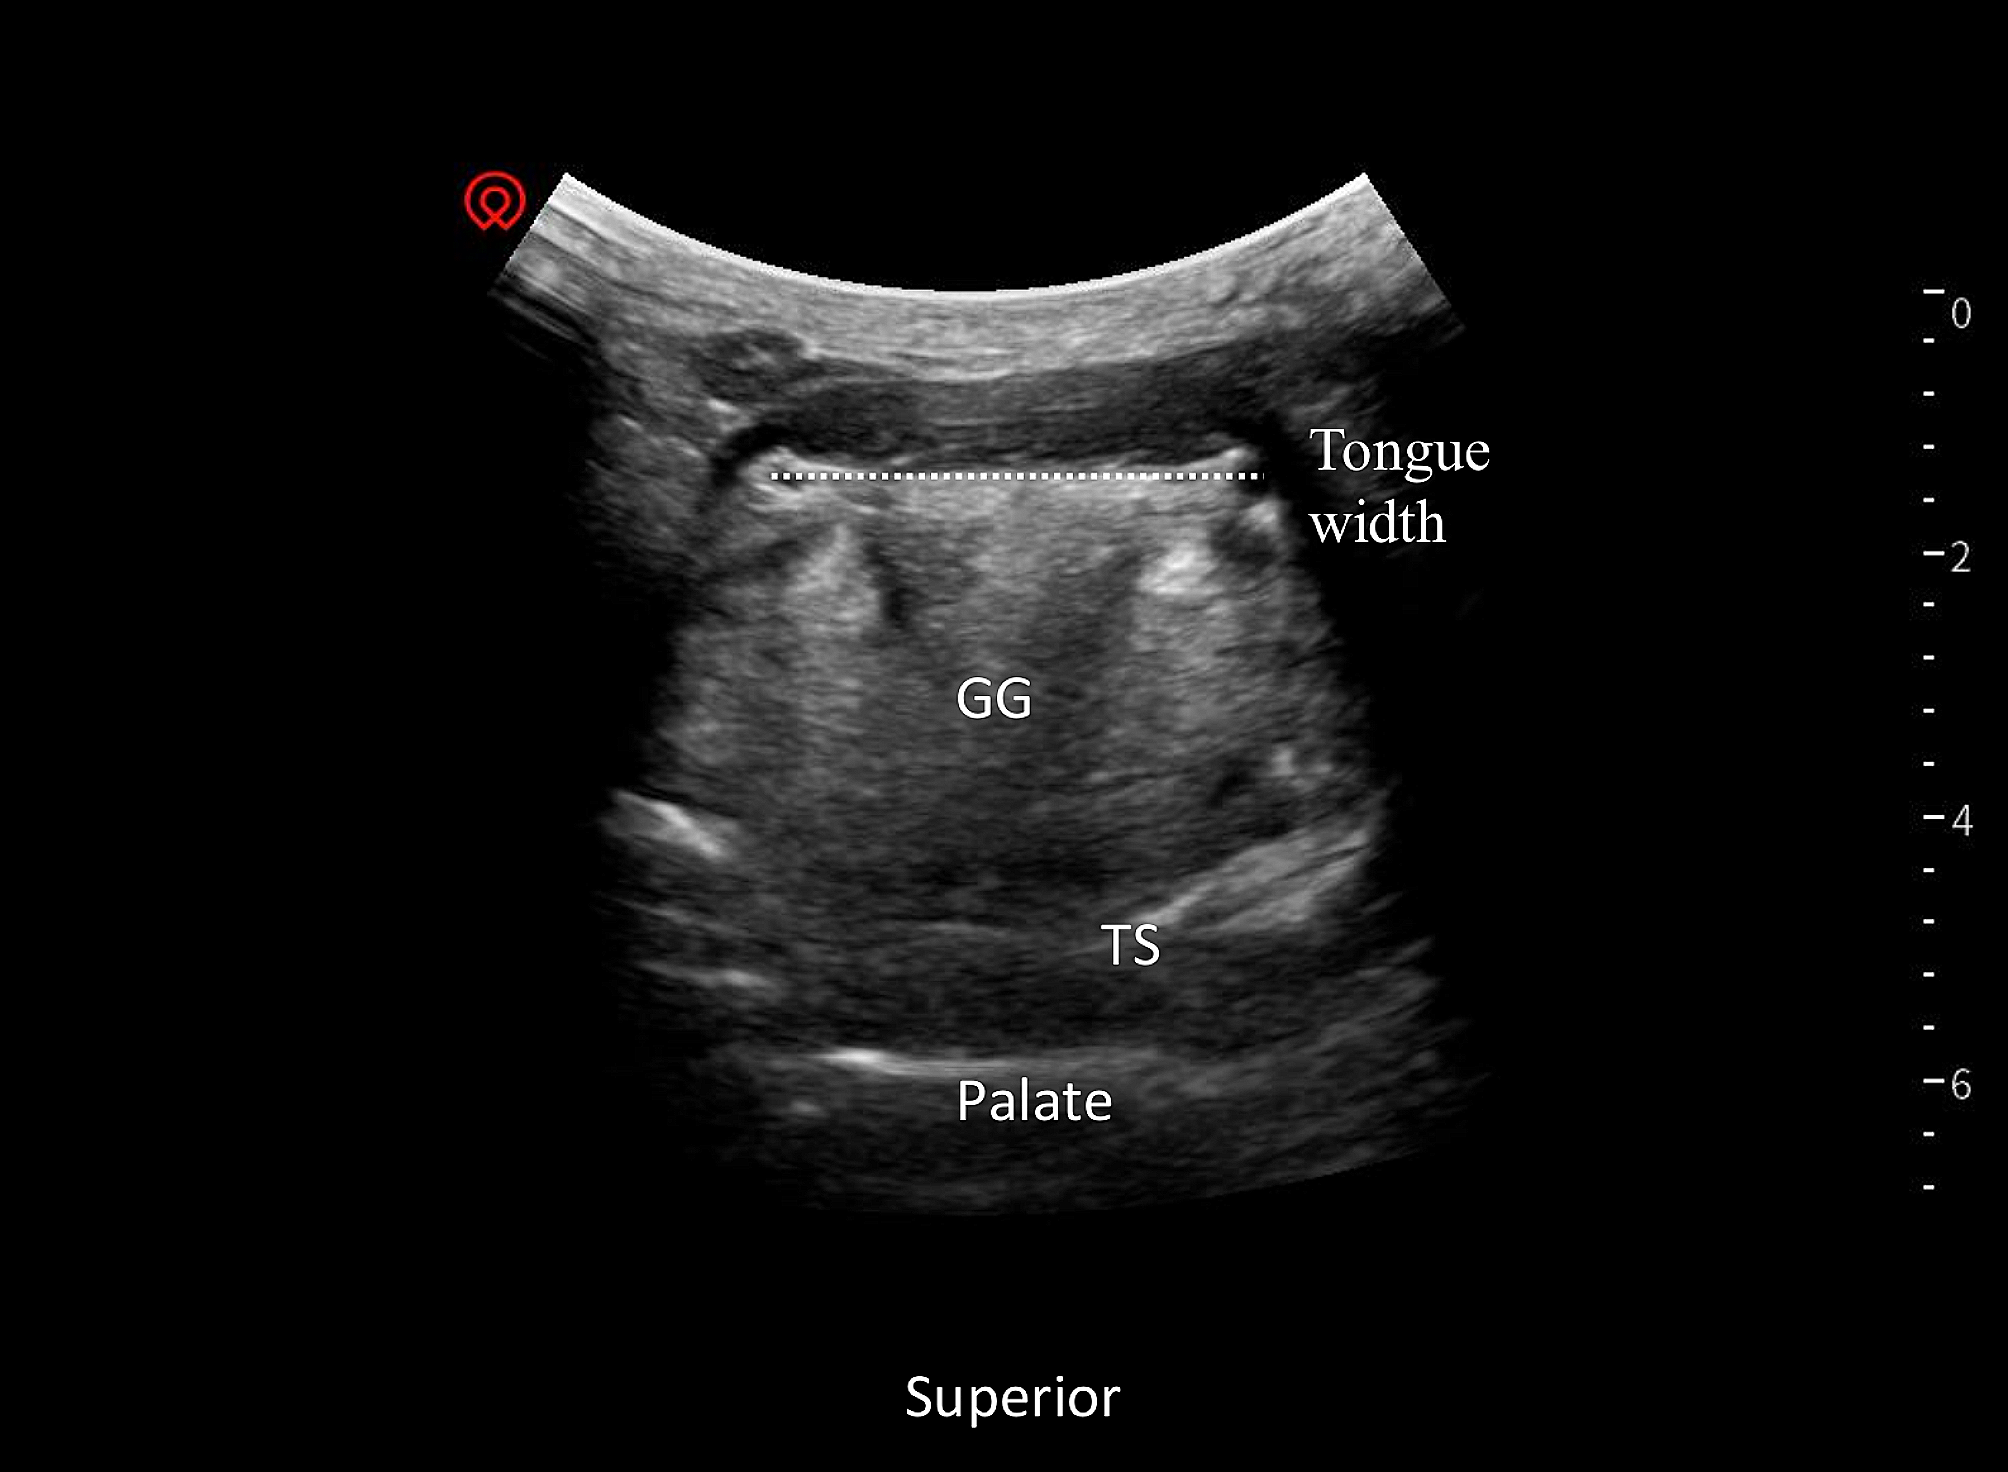
Subclavian vein ultrasonographyBefore the SCV examination, all patients would wait in the anesthetic preparation room for ≥ 5 min prior to entering the operating room and were conscious, laying supine, and spontaneously breathing. A 4–15 MHz linear probe of an ultrasound unit (Wisonic, China) was used to perform ultrasound measurements of the right SCV diameter in all patients. To obtain the best view of the SCV during the study, the probe was placed beneath the proximal part of the middle of the clavicle and the area below the clavicle was scanned. Patients were directed to perform a deep, intentional inhalation, followed by a gradual and relaxed exhaling process. After locating the target vein, the change in dynamic diameter over time was recorded using M-mode imaging, which was subsequently used to identify and measure the minimum (dSCVmin) and maximum (dSCVmax) venous dimensions over the respiratory cycle. The SCV Collapsibility Index (SCVCI) and SCV variability (SCVvariability) were calculated using the following formulas; SCVCI = (dSCVmax – dSCVmin)/dSCVmax * 100%, and SCVvariability = (dSCVmax – dSCVmin)/ (dSCVmax + dSCVmin)/2 * 100% [20, 21]. The mean of three measurements was selected. All these measurements were obtained by one anaesthesiologist with extensive sonography experience (Fig. 1).
Fig. 1
M-mode ultrasonography of the subclavian vein
Anesthesia managementAll patients were fasted for 12 h, and none had been pre-medicated before surgery. All patients’ vital signs (pulse oxygen saturation, respiratory rate, blood pressure, and electrocardiogram) were monitored. The anesthesia induction regimen followed a standard conventional sequence induction: 0.04 mg/kg midazolam + 0.3 µg/kg sufentanil + 2 mg/kg propofol + 0.15 mg/kg cisatracurium. Using a video laryngoscope, an experienced anesthesiologist performed tracheal intubation 3 min after administering the muscle relaxant. Subsequently, mechanical ventilation was administered using a volume of 8 ml/kg (based on ideal body weight), accompanied by a fresh gas flow rate of 2 L/min. In parallel, a Ringer’s acetate solution was consistently infused at a rate of 10 ml/kg/h for all patients participating in the study.
Blood pressure measurementsInvasive blood pressure monitoring was performed in all patients using a 20-gauge arterial catheter (Supercath Ztu-V, Japan) inserted into the radial artery following local lidocaine infiltration before induction. The catheter was then connected to a pressure sensor (Hisern, Zhejiang) flushed with heparinized saline. After adjusting the zero pressure, MAP was subsequently recorded every 1 min by the monitor (Mindray, China).
Sample size calculations and data collectionIn Part I study, the sample size was determined using following formula: N = [(Zα/2 + Zβ) S/δ]2, and the standard deviation was obtained based on the results of previous studies [22], δ = (0.25–0.5) S. The required number of cases was calculated to be 126 (α = 0.05, power = 80%). A sample size of 140 (assuming a 10% dropout rate) was enrolled to achieve sufficient statistical power. Demographic data (comorbid diseases, weight, height, sex, and age) were obtained. Moreover, HR and MAP were measured every minute until 10 min after intubation, with baseline MAP defined as the blood pressure value 1 min before induction. Episodes of PIH were defined as a > 30% decrease in MAP from the baseline level or any recorded period of MAP < 65 mmHg for ≥ 1 min between induction and 10 min post-intubation. Patients were treated with intravenous boluses of phenylephrine (20 µg) if MAP was < 65 mmHg or if it decreased by > 30% from the baseline level and lasted for ≥ 1 min. Bradycardia patients (HR < 50 beats/min) were treated with atropine (0.5 mg). Based on the presence or absence of hypotension during the study, patients were classified into two groups: PIH and Non-PIH. A different anesthesiologist collected and compiled all the data.
For the Part II study, we utilized PASS 15.0 software to estimate the sample size based on the observed incidence of PIH of 48.6% from our Part I study. Therefore, we assumed the significant difference α = 0.05, power of a test β = 0.8, and accounted for a 10% dropout rate. The sample size was determined to be 129. Patients were stratified into group L (SCVCI ≥ 45.4%) and group H (SCVCI < 45.4%) based on their pre-rehydration SCVCI values. Patients in group L received an intravenous bolus of colloid solution at a volume of 6 ml/kg over 20 min before induction [11]. Conversely, patients in group H did not receive additional fluid therapy before induction. dSCVmax, dSCVmin, SCVCI, SCVvariability, MAP and HR were recorded before and after rehydration. MAP and HR were assessed every minute until 10 min post-intubation, with the minimum value recorded. Furthermore, the 146 patients from Part I study were categorized into two groups: group L1 (SCVCI ≥ 45.4%) and group H1 (SCVCI < 45.4%). Subsequently, the incidence of PIH was compared among the four groups.
Statistical analysisData collected were compiled using Microsoft Excel (v 2304, Microsoft, USA). The Kolmogorov-Smirnov test was used to assess the normality of the collected data with normally distributed results reported as mean ± standard deviation (‾x ± s), and inter-group differences compared using an independent sample t-test. Non-normally distributed data were expressed as medians (interquartile ranges), and the Mann-Whitney U test was used to compare the differences. For categorical variables, analysis was conducted using the chi-square test, presenting results in numerical values and percentages.
A binary logistic regression analysis was utilized to investigate the association between SCV parameters and the occurrence of PIH. Based on clinical practice and previous PIH research, confounding variables selected for this study included ASA physical status, sex, age, body mass index (BMI), albumin levels, baseline MAP and baseline HR [1, 6, 23]. Based on the results of these analyses, the receiver operating characteristic (ROC) was performed to determine the ability of SCV parameters to predict PIH for all patients. The calculation of the area under the curve (AUC), optimal threshold values, and a 95% confidence interval (CI) was also executed. All statistical computations were carried out using SPSS version 25.0 (IBM, USA). Results displaying a significance level of P < 0.05 were deemed statistically noteworthy.
留言 (0)