Data acquisition
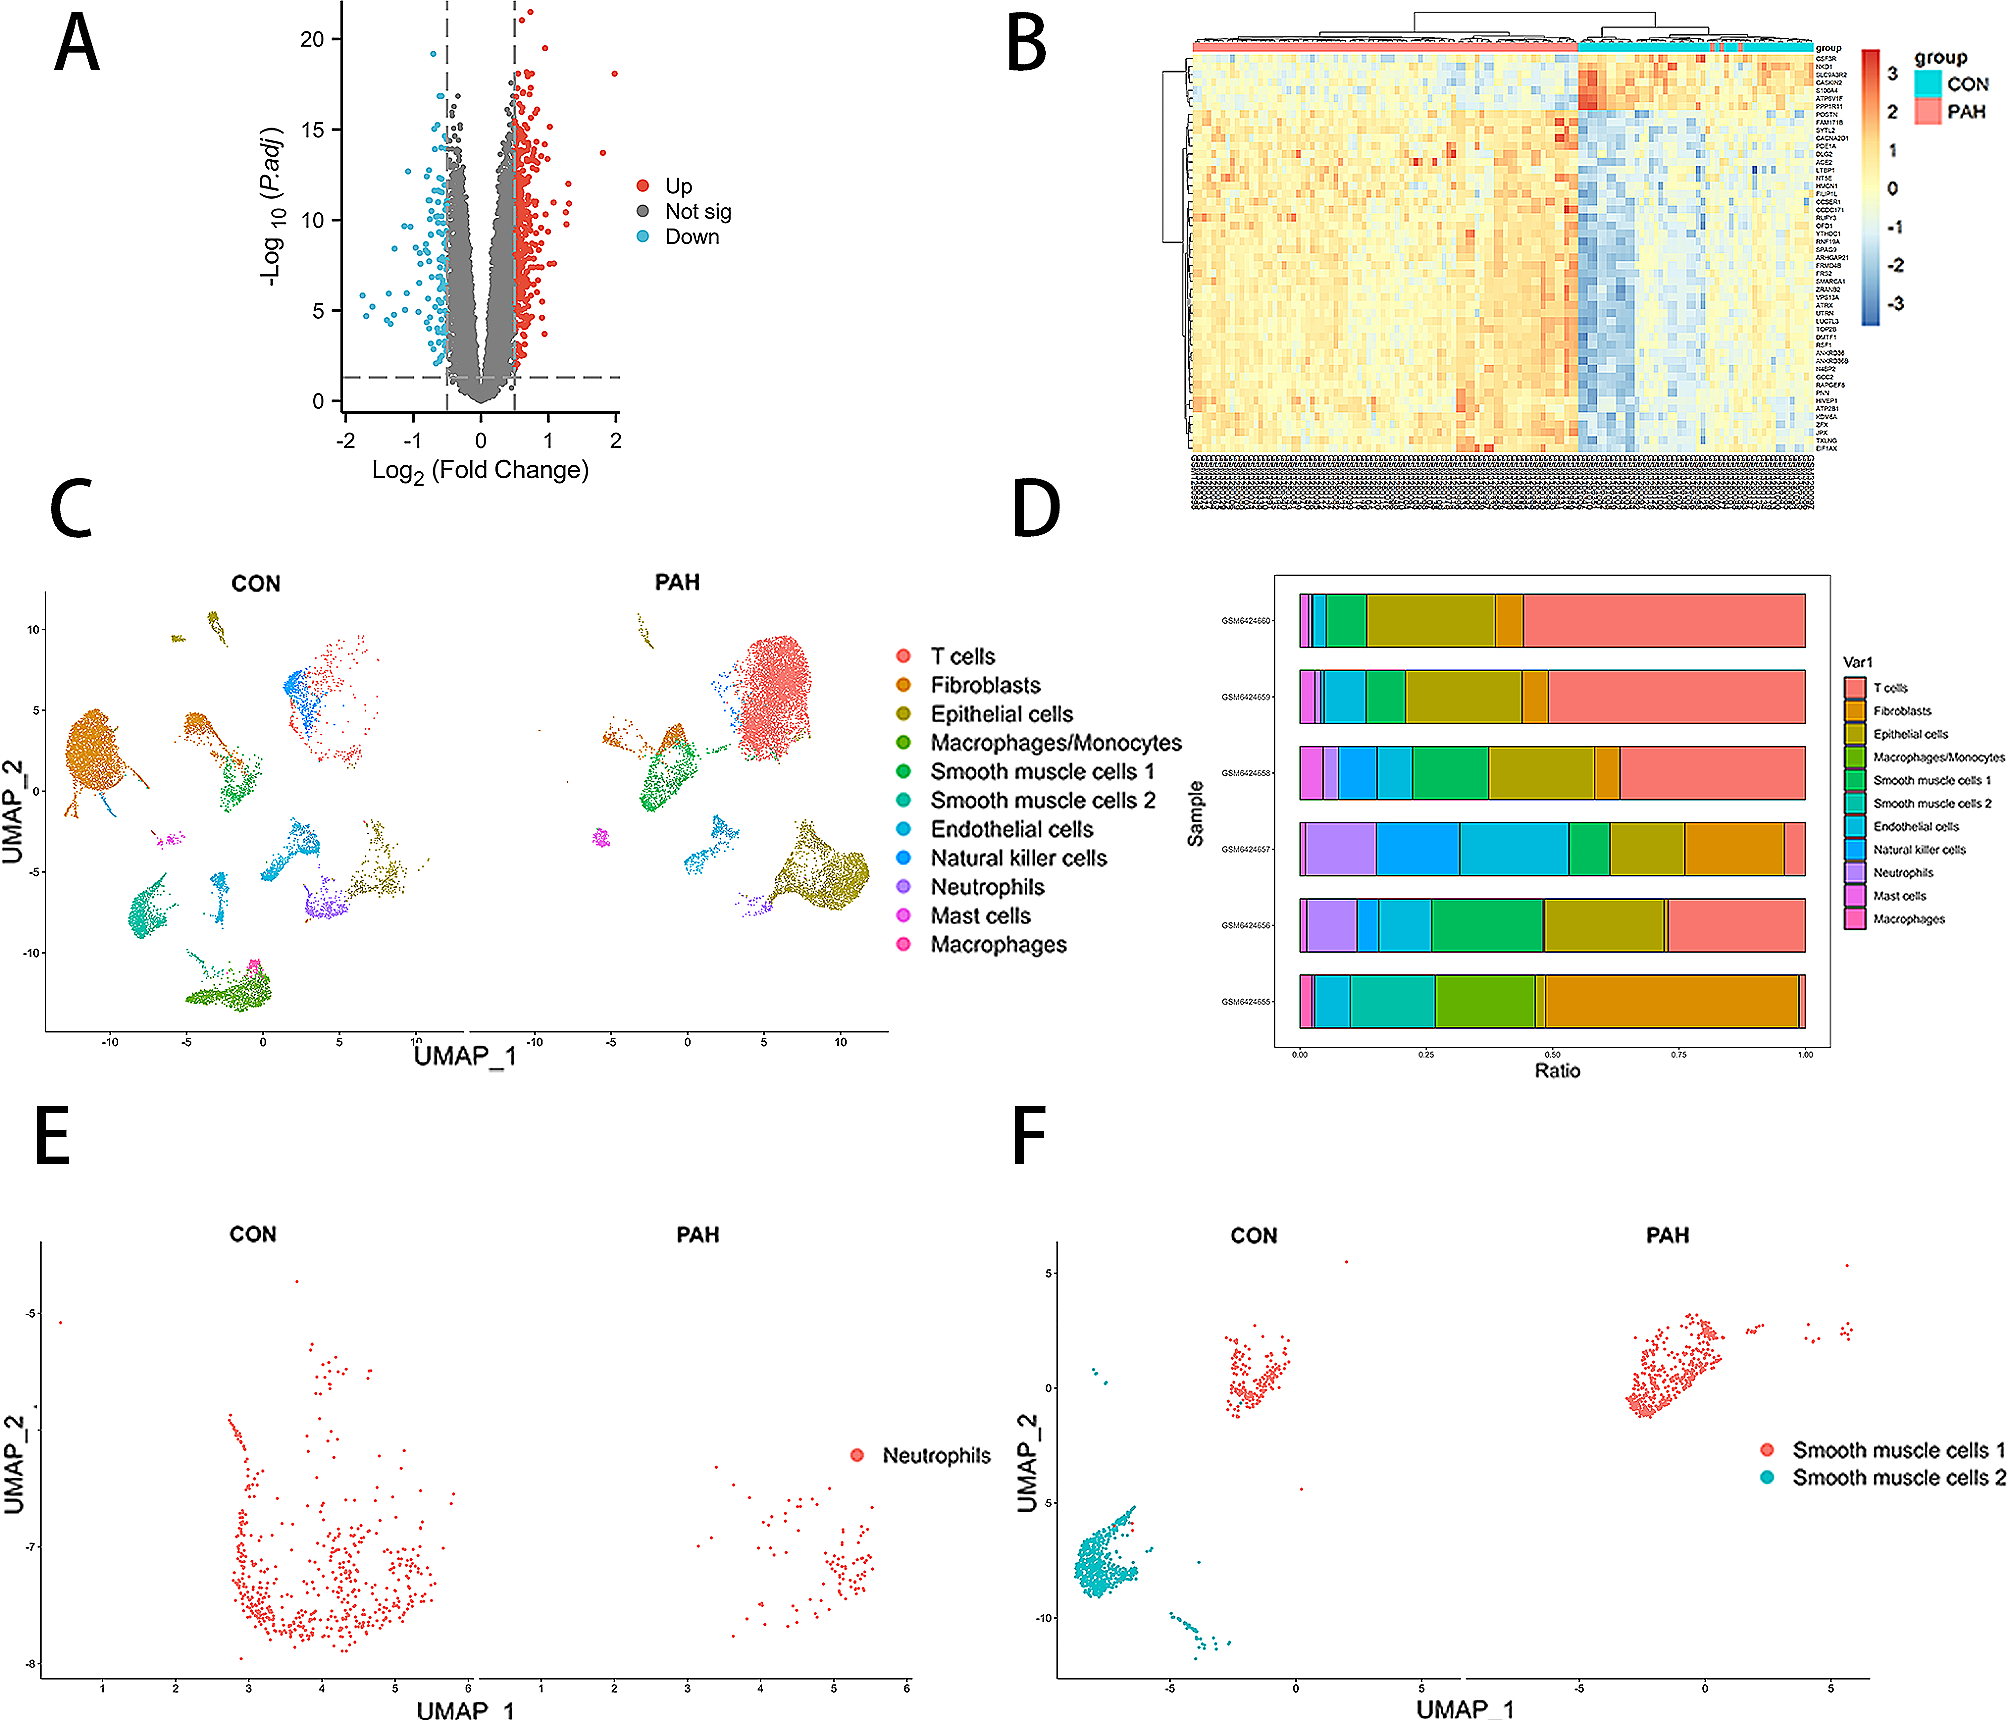
The published microarray datasets, GSE20257 (including 23 COPD and 53 control samples) and GSE10006 (including 27 COPD and 22 control samples) were received from the GEO database (https://www.ncbi.nlm.nih.gov/geo/) in the data format MINiML. We generated the above two datasets using GPL570 (HG-U133-Plus_2) Affimetrix Human Genome U133 Plus 2.0 array, both of which are gene expression arrays. Airway epithelial samples were isolated from the subjects with COPD samples and control groups in the GSE20257 and GSE10006 datasets. We pre-processed all GEO raw datasets using “affy” in R, including normalisation, background calibration and log2 conversion. When a common gene was mapped by multiple probes, the average value was taken as its expression value.
Human samples
The peripheral lung tissue of non-smokers, smokers, and patients with COPD in this study was obtained from the lobectomy of benign pulmonary nodules and lung transplantation at Wuxi People’s Hospital. All patients with COPD met the diagnostic criteria of GOLD 2023. According to the Istanbul Declaration, all organisational donors in this study were voluntary, and informed consent was obtained from them. The Ethics Committee of Wuxi People’s Hospital approved the study protocol. After collecting peripheral lung tissue, it was deposited in a test tube and quickly stored at -80 ° C for subsequent use. The clinical information on the lung function of human lung tissue donors participating in this study is shown in Table 1.
Table 1 Clinical characteristics of the subjectsAnimals and establishment of mice COPD model
C57BL6J mice (male, 6–8 weeks old) were raised in animal equipment at Wuxi People’s Hospital in Jiangsu Province and bought from Changzhou Kawensi Experimental Animal Co., Ltd. (China). The mice were treated humanely following the approval and guidelines of the Animal Care and Use Committee of Wuxi People’s Hospital in Jiangsu Province and the relevant laws on experimental animal management in Jiangsu Province. Mice were exposed to smoke from Daqianmen cigarettes (10 mg tar and 0.8 mg nicotine/cigarette, Shanghai, China). Mice were exposed to CS for 2 h, twice a day, with an interval of 4 h, 7 days a week, for 12 weeks in a tempered glass box, a systemic exposure system. In addition, these mice serve as controls in a safe and similar environment without exposure to CS-fed age-matched mice.
Animals and administration of adenovirus
The method for establishing a mice COPD model has been described above. Genechem Technology Co., Ltd. (Genechem, China) synthesised the AAV9-GLUT3-inhibitor. The mice were divided into four groups (control, CS, CS + AAV negative control, and CS + AAV9-GLUT3-inhibitor). The virus titre was 5 × 10¹¹ v.g./ml. Before mice were exposed to CS, we perfused them with adenovirus through the nose. The Animal Care approved all animal experiments, and the Use Committee of Wuxi People’s Hospital in Jiangsu Province according to the laws on experimental animal management in Jiangsu Province.
Lung function measurement
At the Jiangsu Provincial Center for Disease Control and Prevention, whole-body plethysmography was used to measure lung function in mice (Buxko Electronics Co., Ltd., USA). We placed the mouse in a room connected to a sensitive baroreceptor and recorded the enhanced pause (Penh) using FinePoint software (Buxco Electronics, USA) when the mouse breathed peacefully. Penh mainly reflects the airway resistance of mice in the respiratory parameters recorded in the instrument. Take the average value and express it as an absolute Penh value.
Regents and cell culture
BEAS-2B cells were derived from normal human pulmonary bronchial epithelial cells and received from the Chinese Academy of Science cell bank. BEAS-2B cells were cultured in Dulbecco’s modified Eagle’s medium (DMEM) supplemented with 10% foetal bovine serum (Gibco, USA), 100 U/mL penicillin, and 100 µg/mL streptomycin (Thermo Fisher Scientific, USA) in a humidified incubator containing 95% air and 5% CO2 at 37 °C. After the cells were 70–80% fused, they were digested with 0.25% trypsin (Gibco, USA) at 37 °C for 1–2 min. Observation under the microscope showed that most of the cells were in a single suspended state, and digestion was immediately terminated in the complete culture medium. The medium was then placed in the centrifuge at 1000 rpm for 5 min, the supernatant was discarded, and the cell precipitate was resuspended on the culture medium with the subculture at a 1:3 ratio. The cell generations used were 10–20 generations. Before modelling, the cells were seeded in a 6-well plate at 104 cells per well. During exposure to CSE, the cells were cultivated in DMEM medium containing 10% FBS. Finally, we collected cells after exposure to CSE at 0 h, 6 h, 12 h, 24 h, and 48 h.
Preparation of CSE
The method of preparing CSE was reported previously [8], and some modifications were made. Two cigarettes (Chinese front door) were dissolved in serum-free DMEM (Gibco, USA) with a pH of 7.4 to form a CSE solution. Then, a 0.22 µ M pore filter (Merck Microporous Company, USA) filtered and removed insolubility, standardised by measuring absorbance at 320 and 540 nm and defined as 100% CSE. We diluted CSE to 5% concentration using DMEM medium and used it immediately.
Western blot
The total protein was extracted using RIPA buffer (Beyotime Institute of Biotechnology, China) mixed with a phosphatase inhibitor and protease inhibitor (CWBIO, China). Equal amounts of protein (20–40 µg) were separated via SDS‒PAGE and transferred onto PVDF membranes (Millipore, MA). After using 5% milk blocking for 1 h, the membranes were placed with antibodies targeting GAPDH monoclonal antibody 1:60000 (#60004-1-lg, Proteintech, China), GLUT3 polyclonal antibody 1:5000 (#20403-1-AP, Proteintech, China), E-Cadherin Mouse mAb 1:1000 (#14,472, Cell Signaling Technology, USA), ZEB1 polyclonal antibody 1:1000 (#21544-1-AP, Proteintech, China), N-cadherin XP Rabbit mAb 1:1000 (#13,116,Cell Signaling Technology, USA), Vimentin XP Rabbit mAb 1:1000 (#5741, Cell Signaling Technology, USA), and NF-κB XP Rabbit mAb 1:1000 (#8242, Cell Signaling Technology, USA) at 4 °C overnight. The membrane was then incubated with the secondary antibodies 1:3000 (Beyotime). The visualisation of antibodies was completed through the ECL system.
Immunofluorescence staining
Fix cells in a 4% paraformaldehyde solution for 15 min, permeate 0.2% Tritunx-100 for 15 min, and wash with PBS three times. Then, the cells were sealed with cell sealing solution for 1.5 h and incubated overnight with primary antibodies (GLUT3 1:200, E-cadherin 1:200, N-cadherin 1:400, Vimentin 1:200) at 4 °C. Cells were incubated with fluorescent secondary antibodies (Abcam) and incubated at room temperature for 1 h, followed by DAPI for 5 min. Images were obtained using a confocal microscope.
Immunohistochemistry staining
A paraffin slicer fixed the lung tissues with 4% paraformaldehyde and paraffin-embedded and sliced into 4-µm-thick lung sections. Briefly, lung sections were deparaffinised through graded alcohols and washed in distilled H2O. Heat-activated antigen retrieval was performed using a citrate buffer, and a peroxidase blocker blocked endogenous peroxidase. After that, sections were blocked for nonspecific protein binding by 10% normal serum. Sections were immunostained with anti-GLUT3 at a 1:500 dilution. After incubation with appropriate HRP-coupled secondary antibodies, the samples were incubated with DAB (Sigma, USA). Lung sections are observed under a microscope. A blinded reader quantified immunohistochemistry staining, and staining was quantified using the Threshold feature in ImageJ.
Masson’s staining and H&E staining
The mouse right lung lobe and human lung tissue were fixed with 4% neutral paraformaldehyde for 24 h. Tissues were embedded in paraffin and sectioned (4 μm). The sample slides were stained with trichrome stain (Masson’s) kits (D026-1-2, Nanjing Jiancheng Bioengineering Institute, China) to detect collagen deposition according to the instructions. Next, a photograph documentation facility examined the slides under a light microscope. Using ImageJ software, collagen content was measured by the ratio of collagen’s surface area (blue) to the total surface area (red).
H&E staining was conducted according to the Hematoxylin-Eosin Staining Kit (Solarbio, G1120) manufacturer’s instructions.
Small interfering RNA, plasmids, and transfection
An appropriate concentration of BEAS-2B Cells were planted in a 6-well culture plate and incubated overnight in a culture incubator. Three centrifuge tubes were taken and the appropriate Opti-MEM medium was added separately. For every 125 µl of Opti MEM medium in one tube, 3.75 µl Lipofectamine 3000 was added, after which we gently blew and sucked 3–5 times to mix well. An appropriate amount of siRNA or NC siRNA was added to each of the other two tubes, gently blowing and aspirating 3–5 times, to mix it well. Three centrifuge tubes were left to stand at room temperature for 5 min. The Opti-MEM medium was sucked out with the same volume of siRNA or NC siRNA tubes from centrifuge tubes containing Lipofectamine 3000. They were mixed separately and gently blown and sucked 3–5 times to mix well. After standing at room temperature for 20 min, an appropriate amount of the final mixture was taken and added to a 6-well plate to maintain the final concentration of siRNA or NC siRNA at 100 nM. Beas-2B cells transfected with siRNA were synthesised by RiBoBio (Guangzhou), targeting GLUT3, using liposome 3000 (Invitrogen, L3000-015) for 48 h. Human ZEB-1 expression vector was purchased from RiBoBio (Guangzhou). An appropriate concentration of beas-2b cells were taken and planted in a 6-well culture plate. The transfection procedures followed the manufacturer’s protocols. The original culture medium was discarded after 12 h, and complete culture medium was added to continue cultivation.
Statistical analysis
All statistical analyses were conducted using GraphPad Prism 9 software (GraphPad Software Company, San Diego, CA) and displayed as the average ± SD of at least three independent experiments. Student’s t-test was applied for comparisons between the patient groups and was performed between two groups. The mean values were compared using the post hoc test Dunnet’s was used after one-way ANOVA when more than two groups were compared. A P < 0.05 value was considered statistically significant.


留言 (0)