
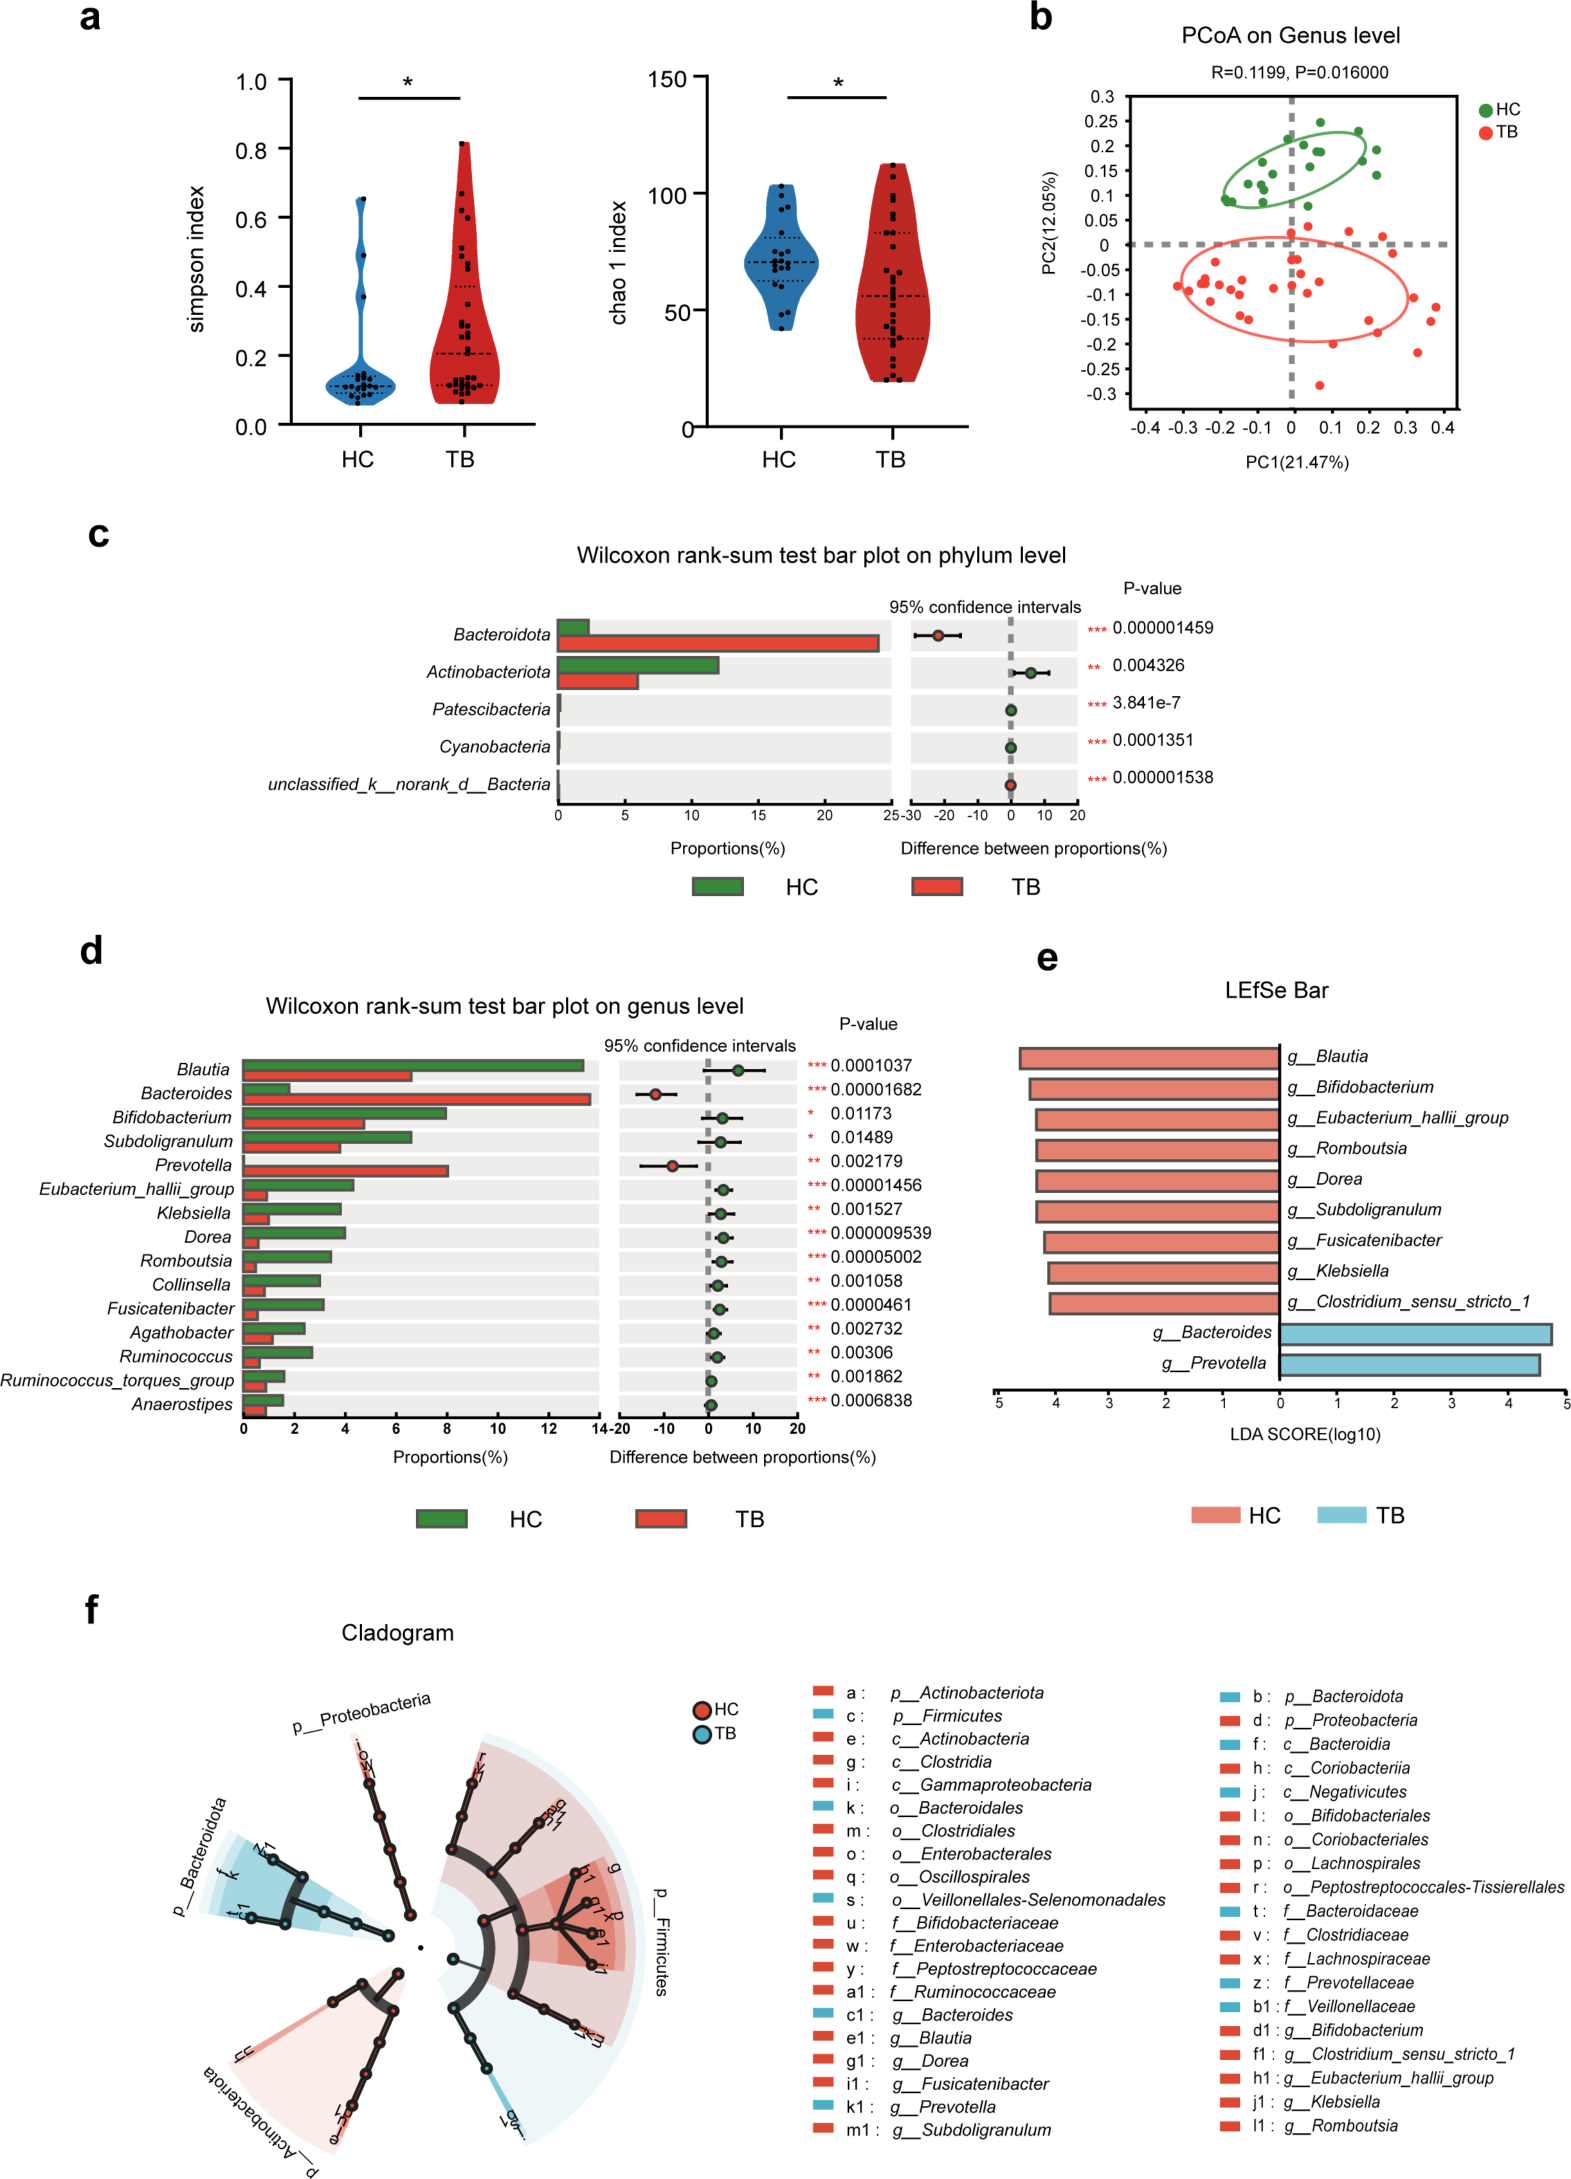
記住我


After eliminating duplicate and low-quality samples, our analysis dataset included a total of 396 obese samples and 466 control samples from seven independent studies (Table S1). The high-quality reads that remained after screening with Fastp were aligned using Metaphlan 3.0. This alignment revealed that bacteria accounted for the majority (98.80%) of the total samples, with a small percentage of archaea (0.53%) identified (referred to as the bacteriome here). The species level biodiversity analysis of the gut microbiota showed that the α-diversity (Shannon Index, p < 0.001) and richness of the control group were significantly higher than those of the obesity group (Fig. 1A,B). Furthermore, the β-diversity of the obese group (Bray-Curtis, p < 0.001) was significantly higher than that of the healthy control group (Fig. 1C). To delve deeper into the differences in the gut microbiome, we conducted a principal-coordinate analysis (PCoA). The results of the PCoA exhibited a distinct separation between the two groups (PERMANOVA, p < 0.001) (Fig. 1D), highlighting significant disparities in their microbial compositions.
Fig. 1
Structure and differential enrichment analysis of gut microbial communities in obesity. A, B, C Comparison of α diversity (Shannon index; A), β diversity (Bray-Curtis similarity index; B) and gene richness(C) of microbial content between the obesity and the control group. D PCoA analysis based on Bray-Curtis distance, with PERMANOVA used to assess differences in bacterial composition between the obesity and control groups. E Relative abundance of the top 10 bacterial phyla. F Relative abundance of the top 10 bacterial genera. G Differentially enriched species obtained through MAssLin2 analysis (p < 0.01, FDR < 0.01), with bacterial species names marked with “*” indicating consistency with LEfSe analysis results (LDA > 2, p < 0.05). The x axis represents the coefficient value calculated by MaAsLin2 analysis
PERMANOVA (Permutational multivariate analysis of variance) was employed to examine the factors contributing to sample differences. In this study, we primarily focused on disease phenotype, age, sex, country, and study as the main influencing factors. Our analysis indicated that the ‘phenotype’ factor of the participants accounted for a small portion of the variation, which aligns with previous studies [24]. Country and batch factors explained a significant portion of the variation, but the confounder analysis by SIAMCAT showed a substantial overlap between these two factors (Fig. S1A). So, we considered only the batch factors in subsequent analyses. Initially, we corrected the batch effects using MMUPHin and then employed MaAsLin2 to identify differential species. We included the two factors, sex ratio (MF) and age, as covariates in our analysis. After correcting for batch effects, the contribution of batch factors to the sample variance was reduced from 11.796 to 4.852%, and the correction effect was significant (Fig. S1B). We only retained the results from the differential enrichment analysis that met the criteria of p < 0.01 and FDR < 0.01, with a prevalence cutoff > 20%.
Microbial compositions analysis identified the Bacteroidetes, Firmicutes, Actinobacteria, Proteobacteria and Verrucumicrobia as the most dominant phyla in both groups (Fig. 1E). Further phylum level study revealed that the obesity group exhibited markedly higher levels of Bacteroidetes, Ascomycota and Fusobacteria Ascomycota and lower levels of Actinobacteria, Verrucomicrobia, Firmicutes, Synergistetes and Euryarchaeota than those of the control groups (Fig. 1E, Fig. S2A). At the same time, the average abundance ratio of Firmicutes to Bacteroides in the obese group was significantly lower than that in the control group (Fig. S2B). This observation contrasts with the findings of certain previous studies [47]. At the genus level, the relative abundance of 25 bacterial genera and two archaeal genera was significantly different between the two groups (Fig. 1F, Fig. S2C). We then conducted a species-level comparison of the gut microbiome and identified 39 species that exhibited significant differences in relative abundance between the two groups. Among these, 29 bacterial species including Akkermansia muciniphila, Eubacterium eligens, Coprococcus eutactus, and Alistipes shahii, and one archaeal species (Methanobrevibacter smithii), were found to be significantly enriched in the control group. In contrast, 9 bacterial species, including Eubacterium sp. CAG:274, Ruminococcus gnavus, Collinsella stercoris, and Megasphaera elsdenii, were enriched in the obese group (Fig. 1G). We confirmed the differential enrichment of species in both groups through LEfSe analysis, revealing that 3 species in the obesity group and 25 species in the control group exhibited significant differential enrichment (Fig. 1G).
Taxonomic annotation and comparison of gut viromePhages, or bacteriophages, are viruses that infect bacteria and have the potential to modulate the structure of the human gut microbiome by lysing bacterial hosts and facilitating horizontal gene transfer [48, 49]. Numerous studies have suggested a strong correlation between the viral component of the gut microbiome and obesity. To further investigate this relationship, we assessed the viral component using the virus identification tool Virsorter2. We finally obtained 27,651 high-quality viral contigs, which were then clustered into 22,620 representative viral operational taxonomic units (vOTUs). To understand the intra-community and inter-community diversity of the virome in the two groups, we analyzed the α-diversity, richness, and β-diversity. The analysis of gut viral composition revealed a significant decrease in both viral α-diversity (Shannon Index, p < 0.001) and richness in the obese group, and significant increase in β-diversity by comparing with the control group (Bray-Curtis, p < 0.001) (Fig. 2A, B, C). Bray-Curtis distance-based PCoA analysis showed that the obese and control groups were significantly divided into two distinct clusters (PERMANOVA, p < 0.001) (Fig. 2D). These results indicate that the gut virome profiles of subjects in the obese group differ significantly from those in the healthy control group. In our study, out of 22,620 vOTUs, 11,290 were finally annotated as phages by PhaBOX. Among these, 70.18% were taxonomically assigned to 19 viral families, with Peduoviridae being the most abundant family (16.75%) (Fig. 2E). Among the top 10 phage families with the highest average relative abundance, Mesyanzhinovviridae, Chaseviridae, Salasmaviridae, Drexlerviridae, and Casjensviridae showed significant differences in abundance between the obese and control groups (Fig. 2F). To further predict the lifestyle of these phages, the phage genomes or contigs are classified via PhaTYP, a tool combined in PhaBOX. The predictive outcome indicates that 58.70% of the phages were identified as temperate phages, while 41.30% were classified as lytic phages (Table S2). Furthermore, the most prevalent identifiable hosts at the phylum level are primarily Proteobacteria (49.11%), Firmicutes (34.79%), and Bacteroidota (6.43%) (Fig. 2G). Other phyla, such as Tenericutes, Actinobacteria, Bacillota, Chlamydiae, and Cyanobacteria, were also represented (Fig. 2G). In addition, we analyzed the genomic GC content and size of phages associated with these hosts. Our findings showed that phages with Bacteroidota as their host exhibit significantly lower GC contents and larger genomic sizes compared to other phages (Fig. 2H, S2D). Utilizing the relative abundance data of vOTUs, we conducted a differential enrichment analysis employing LEfSe. This analysis revealed 18 vOTUs that exhibited depletion in obesity and 10 vOTUs that displayed enrichment in obesity (LDA > 2.0, p < 0.01). Notably, out of these, only two vOTUs, namely vOTU15805 (Straboviridae) and vOTU16408 (Drexlerviridae), were classified within known phage families (Fig. 2I).
Fig. 2
Characteristics of the gut virus catalogue and gut viral communities in obesity. A, B, C Comparison of α diversity (Shannon index; A, gene richness B) and β diversity (Bray-Curtis similarity index C) of viral community between the obesity and the control group. D PCoA analysis based on Bray-Curtis distance, with PERMANOVA used to assess differences in viral composition between the obesity and control groups. E Percentage of different viral families in the virome. F Relative abundance of the top 10 viral families. G Percentage of different phage hosts in the overall composition. H Boxplot of the GC content of phages. The x-axis representing the corresponding hosts at the phylum level. The x-axis representing the phage hosts at the phylum level. (I) vOTUs differentially enriched between the two groups obtained through LEfSe analysis (LDA > 2, p < 0.01)
Functional alternation of gut microbiome in obesityTo gain functional insights into the gut microbiome, we used eggNOG-Mapper for KEGG functional annotation at the assembly level. This annotation assigned genes to 10,503 KEGG orthologs (KOs), with 33 of them exhibiting differential abundance between the obesity and control groups (LDA > 2.0, p < 0.05) (Fig. 3A). Among them, 18 KOs are significantly enriched in the obesity group, including digestive enzyme-coding genes like beta-galactosidase (K01190), fucosidase (K15923, K01206), glucosidase (K01187, K05349), and starch utilization system proteins (K21571, K21573, K21572). Conversely, 15 KOs are significantly enriched in the control group, encompassing genes encoding ABC transporter systems (K06147, K02004, K02003, K01990, K01992, K16786, K02027), type IV secretion system protein VirD4 (K03205), and DNA topoisomerase III (K03169) (LDA > 2, p < 0.05, Fig. 3A). Subsequently, the differentially enriched KEGG pathways and modules were identified (Fig. 3B, S3A). We revealed significant enrichment of 11 metabolic pathways and depletion of 15 metabolic pathways in the obesity group (Fig. 3B). The representative obesity enriched pathways included the Glycosaminoglycan degradation pathway (ko00531), Fructose and mannose metabolism (ko00051), Protein digestion and absorption (ko04974) and Lipopolysaccharide (LPS) biosynthesis pathways (ko00540) etc. (Fig. 3B). Moreover, the pathways associated with cofactors and vitamins metabolism or biosynthesis, such as Riboflavin metabolism, Folate biosynthesis and Ubiquinone and other terpenoid-quinone biosynthesis, were also significantly enriched in obesity group (Fig. 3B). We also discovered 15 metabolic pathways that were diminished in the obese group. Among these, the most noteworthy was the biosynthesis of ansamycins, a pathway related to terpenoids and polyketides metabolism. Additionally, pathways related to carbohydrate metabolism, including glycolysis/gluconeogenesis, pentose phosphate and pyruvate metabolism, were enriched in the control group. Notably, the bacterial secretion system was found to be depleted in the obese group, which is of particular interest (Fig. 3B).
Fig. 3
The microbiota functional characterization in obesity. Differential enrichment analysis of the KOs (A) and KEGG pathways (B) between the obesity and control groups. KOs or KEGG pathways with LDA > 2.0 and p < 0.05 are shown. Blue and red color represent obesity- and control- enriched KOs or pathways, respectively. (C) Taxon-level contribution profiles of the functional shift in the obesity. The x-axis depicts the ranking and statistical scores, while the y-axis represents the associated pathways. Taxa attenuating each functional shift are presented on the left side of the vertical line, whereas those driving each functional shift are depicted on the right side of the vertical line. For each KEGG pathway, the top bars represent contributions from obesity-associated taxa and the lower bars represents contributions from obesity-depleted taxa. Red diamonds represent taxa-based functional shift scores
To identify the individual taxa that made the greatest contribution to the functional shifts, we used FishTaco, a permutation-based method for further analysis. Unlike the simple Sperman correlation analysis, FishTaco integrates both taxonomic and functional comparative information, which offer a more comprehensive, dynamic, and quantitative analysis of microbial contributions to pathways. Remarkably, the differentially abundant metabolic pathways identified between the obesity and control groups exhibited a high degree of concordance with the results obtained from the KEGG pathway-level enrichment analysis. Among all the significantly enriched functions observed in obesity, Ruminococcus gnavus emerges as the primary driver (Fig. 3C). In contrast, within the pathways enriched in the control group, the shifts in functionality appear to be attributed to fluctuations in the abundances of Methanobrevibacter smithii, Akkermansia muciniphila, Ruminococcus bicirculans, and Eubacterium siraeum (Fig. 3C, S3B). The most significant obesity-enriched glycosaminoglycan degradation pathway (ko00531) driver species were Bacteroides uniformis and Ruminococcus gnavus, whereas Eubacterium sp. CAG:274, Blautia wexlerae and Blautia sp. CAG:257 may inhibit this functional shift. The control-enriched “biosynthesis of ansamycins” pathway was driven mostly by Methanobrevibacter smithii, Akkermansia muciniphila, Ruminococcus bicirculans, Firmicutes bacterium CAG:170, Eubacterium siraeum and Firmicutes bacterium CAG:110, while Bacteroides intestinalis, Firmicutes bacterium CAG:95 may play an inhibitory role (Fig. S3B).
Bacterial virulence factors and resistance gene analysisElevated carriage of virulence factors (VFs) and antibiotic resistance genes (ARGs) by the gut microbiome has been associated with various diseases, including obesity [50, 51]. Bacterial VFs and ARGs were identified by screening the assembled sequences using ABRicate. In total, 218 VFs were identified across both groups (Table S3). Notably, the α-diversity (measured by Shannon and Simpson indices) and richness of VF-related genes were significantly higher in the obesity group compared to the control (Fig. 4A, B, C). Through logistic regression analysis, we discovered a significant correlation between the richness of bacterial VF-related genes and the obesity phenotype (OR 1.0098, CI1.0032–1.0166, p = 0.004). According to the results of a LEfSe analysis, 11 VF-related genes were found to be significantly enriched in the obesity group (Fig. 4D). The representative obesiy-enriched VF-related genes included substrates for type II and type III secretion systems (gspF, gspM, gspL, espX4, espR1), genes associated with enterobactin biosynthesis (entC, entE, entS), and genes involved in ferric enterobactin transport (fepA, fepB, fepD) (LDA > 2.0, p < 0.01) (Fig. 4D).
Fig. 4
Bacterial virulence factor and resistance gene annotation. A, B, C Comparison of bacterial virulence factor Shannon index (A), Simpson index (B), and richness (C) between the obesity and control groups. (D) Differential enrichment analysis of bacterial virulence factors (LEfSe, LDA > 2.0, p < 0.01). The yellow bar represents the obesity enriched VFs. E, F, G Box plots depicting bacterial resistance gene Shannon index (E), Simpson index (F), and richness (G). H Differential enrichment analysis of bacterial resistance genes (LDA > 2.0, p < 0.001). The yellow bar represents the obesity enriched VFs and the green bar represent the VFs enriched in control group
In the antibiotic resistome analysis, a total of 232 ARGs were identified across both groups (Table S3). Subsequent diversity analysis revealed a higher mean value of Shannon and Simpson indices in the obesity group, though these differences were not statistically significant (Fig. 4E, F). However, we observed a significantly higher richness of ARGs in the obesity group compared to the control group (p < 0.05) (Fig. 4G). Through application of LEfSe analysis, we pinpointed 32 ARGs that were significantly enriched in the obesity group, notable examples of which include mdtF, evgS, and Escherichia coli acrA (LDA > 2, p < 0.001) (Fig. 4H). Moreover, when comparing the abundance of resistance genes in samples from various countries, we observed that samples from China exhibited a significantly higher presence of ARGs compared to the other four countries (Fig. S4).
Viral-bacterial correlations analysis in obesityIn order to characterize the association between the gut virome and bacteriome in both obese subjects and healthy controls, a comparative analysis of phage and bacterial profiles within these two groups was conducted. The regression analysis revealed significant positive correlations of the Shannon index and richness between the bacteriome and virome in both the control and obese groups, suggesting a close relationship between the bacterial-viral structures in the human gut (Fig. 5A, B). To further assess the correlation between them, we employed Spearman’s correlation coefficient to analyze the relationship between bacteria species and phage family levels. The results indicated that the number of correlations between the virome and bacteriome notably decreased in the obese group compared to the control group (993 vs. 1130, p < 0.001; Fig. 5C). Specifically, the correlations between the virus families Vilmaviridae and Chaseviridae with their bacterial hosts were significantly stronger in the control group (p < 0.01). Conversely, the correlation between the viral families Zierdtviridae and Drexlerviridae with gut bacteria was notably more intensive in the obese groups (Wilcoxon Test p < 0.01, ANOVA Test, p < 0.05, Fig. 5C). These results imply the existence of robust and intricate viral-bacterial relationships within the human gut. Furthermore, it raises the possibility that alteration in the virome-bacteriome relationship may be associated with the microbiome dysbiosis in obesity.
Fig. 5
Spearman correlation analysis between bacteria and phage families in the obesity and control groups. A Regression analysis between bacterial and viral Shannon indices. B Regression analysis between bacterial and viral richness. C Transkingdom correlations between the gut virome and bacteriome. The bacterial species with a prevalence of less than 20% were filtered out. Results in the heatmap labeled with “+” indicate r > 0.2 or r < − 0.2. The correlations with p < 0.05 and false discovery rate of < 0.05 were regarded as significant and selected for visualization. The viral species are classified by family level in columns and bacterial species are in rows
Obesity prediction based on multi-kingdom signaturesFinally, we employed the machine learning framework provided by SIAMCAT to assess the predictive potential of species and functional features of gut microbes for obesity. We evaluated the predictive capacity of bacterial species traits, vOTUs traits, and KO functional traits individually. Notably, we observed higher predictive accuracy for vOTUs relative abundance (AUC-ROC 0.766, PRC-ROC 0.736) compared to that of KO functional traits (AUC-ROC 0.710, PRC-ROC 0.688) and bacterial species traits (AUC-ROC 0.680, PRC-ROC 0.610) (Fig. 6A, B). A model trained on the combined relative abundances of differential bacteria, vOTUs, and KOs exhibited higher predictive power compared to using bacterial species or KO functional traits alone (Fig. 6C, D). However, its predictive accuracy remained lower than that achieved using vOTUs alone. To evaluate the influence of different algorithms on prediction accuracy, we reanalyzed the bacteria and vOTUs data using the Enet algorithm, resulting in AUC-ROC values of 0.680 for bacterial data, which were not significantly different from those obtained with the LASSO algorithm. However, the predictive accuracy of vOTUs data decreased (AUC-ROC value = 0.666).
Fig. 6
Classification based on species abundance and functional composition for obesity status. A ROC curves for the classification models based on taxonomic (microbial species or vOTUs abundance) and functional profiles (KEGG ortholog abundances) of microbiome respectively. B PROC curves to evaluate the model’s classification performance based on taxonomic and functional profiles of microbiome respectively. C ROC curves for the classification models based on taxonomic (microbial species or vOTUs abundance) and functional profiles (KEGG ortholog abundances) of microbiome in combination. D PROC curves to evaluate the model’s classification performance based on taxonomic and functional profiles of microbiome in combination. E, F Cross-study validation of statistical models trained on bacterial species alone(E), or combination of microbial species, vOTUs and KEGG ortholog abundances(F)
We assessed the generalizability of various research models through cross-study validation, but the AUC-ROC values for these prediction models are generally not high. The AUC-ROC values for predicting obesity based on bacterial species characteristics ranged from 0.40 to 0.84, with prediction accuracy exceeding 0.7 in a few cohorts (Fig. 6E). Among these models, the model based on the cohort ‘China-2020’ can well predict the obesity phenotype in cohort ‘China-2020’ and the cohort ‘Australia− 2015’. Meanwhile, the cohort ‘China-2020’ exhibited the highest average prediction accuracy (AUC-ROC 0.63) (Fig. 6E). The situation is similar for predictive models built with other single data sets. AUC-ROC values using KO data ranged from 0.21 to 0.76 (Fig. S4B), while AUC-ROC values derived from vOTU data ranged from 0.34 to 0.68, and the average AUC-ROC value is less than 0.6 (Fig. S4C). The cross-study validation results of prediction models using combined data sets did not show a significant improvement over those using a single data set. The AUC-ROC values ranges from 0.42 to 0.69,and the average AUC-ROC value is less than 0.6 as well (Fig. 6F). These results suggest that obesity prediction models based on a single cohort do not always apply well to other cohorts, which may reflect the individual specificity of the gut microbiome.
留言 (0)