
記住我
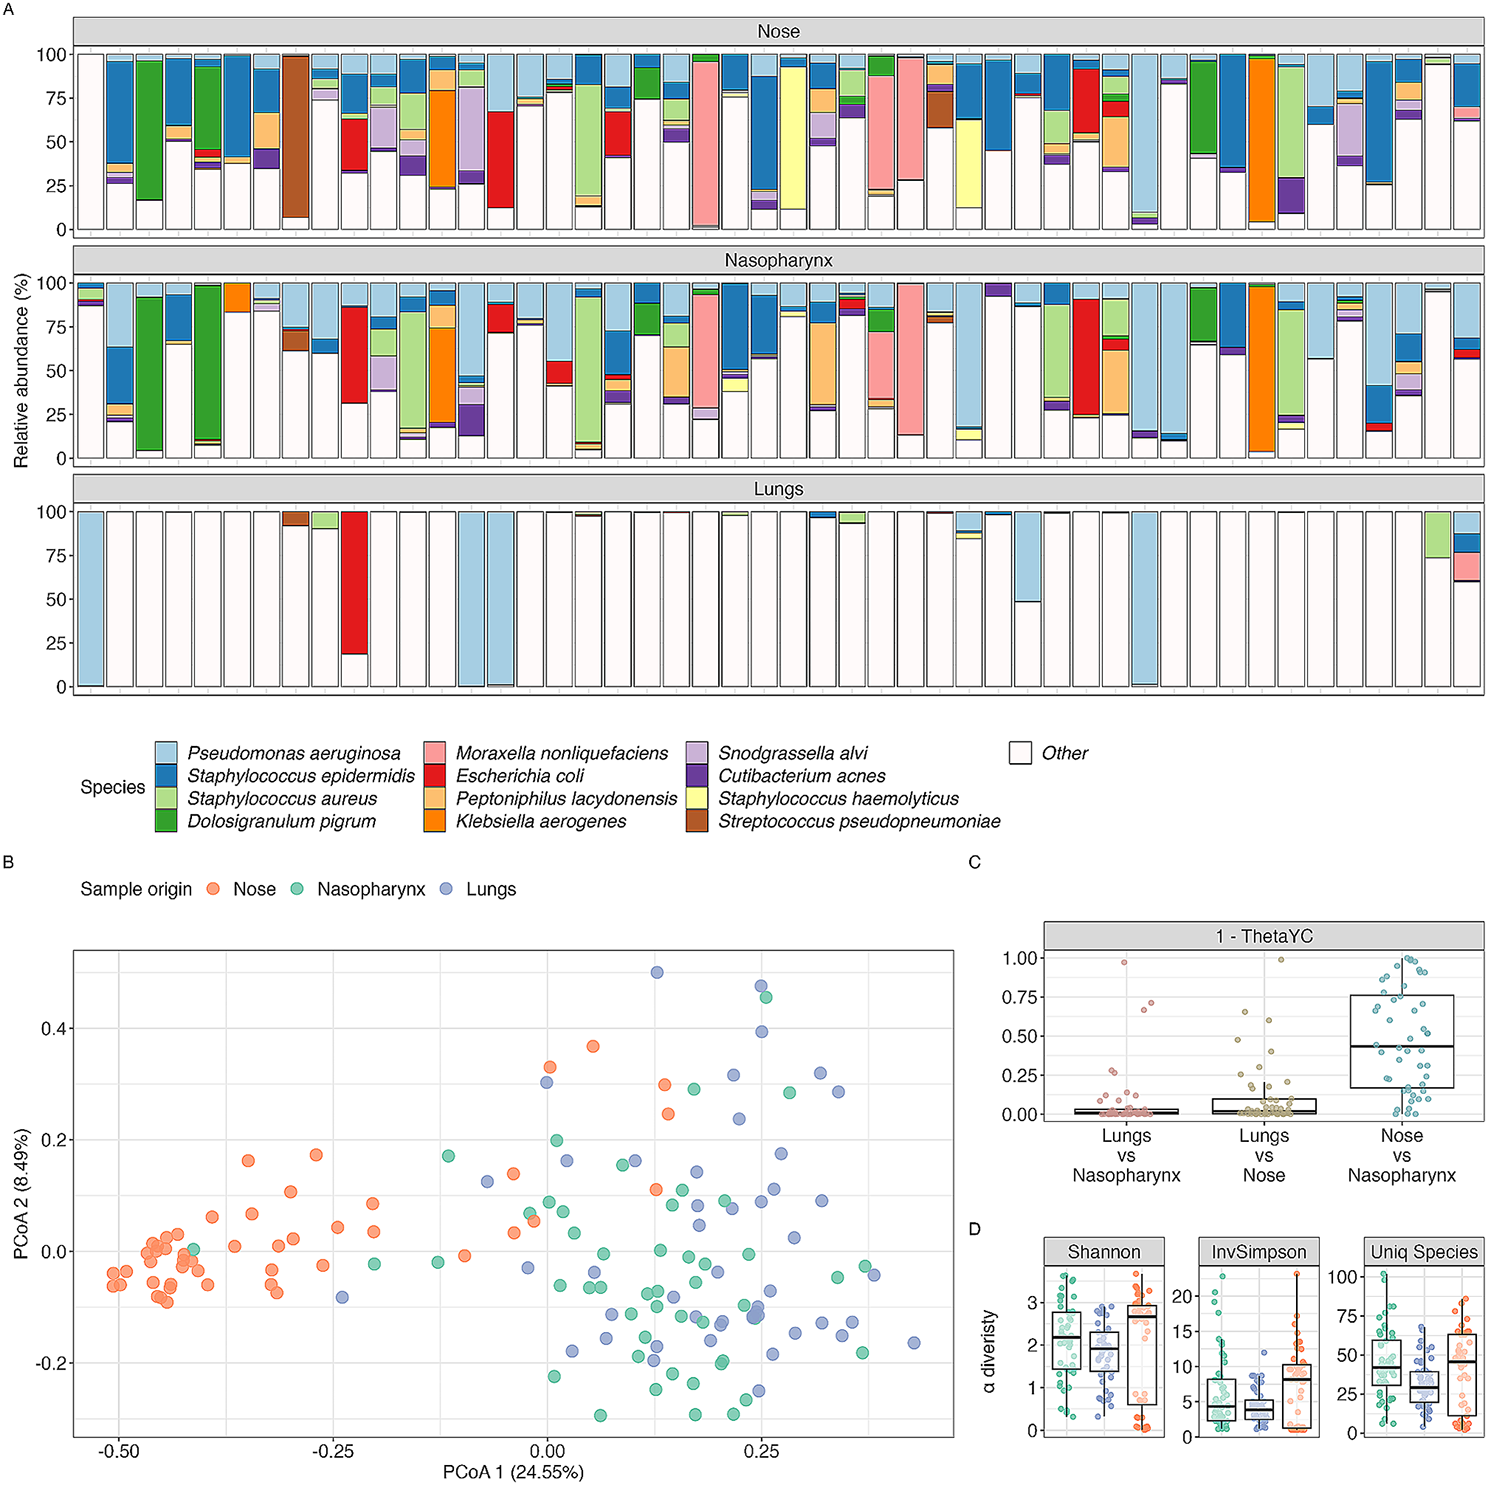


A 58-year-old male patient visited the emergency department of Yichun Hospital, Jiangxi Province, China, in 2021. He had experienced worsening symptoms of productive cough, sputum, fever, chills, and dyspnea that developed within 24 h. The physical examination revealed a respiratory rate of 40 breaths per minute and a body temperature of 39.6℃. He had been in good health prior to this episode and had no history of chronic diseases, drug use, smoking, or alcohol consumption. The laboratory results showed a white blood cell count of 4.8 × 10⁹/l with 87.6% neutrophils and C-reactive protein > 200 mg/l. Arterial blood gas analysis at room air revealed the following values: pH 7.485, pCO2 25.4 mmHg, pO2 58.9 mmHg. The diagnosis was severe community-acquired pneumonia (CAP) and type-1 respiratory failure. A CT scan revealed pronounced inflammation and complete consolidation in the right upper lobe. On the third day after admission, sputum and blood culture results indicated the presence of A. baumannii bacteria, the bacterial burden of blood and sputum were both 4 + , no definite quantitative results. Treatment for this patient consisted of Imipenem/Cilastatin 1 g ivgtt q8h plus amikacin 0.6 g ivgtt qd. Following ten days of treatment, the patient's symptoms of productive cough and sputum had alleviated, and the body temperature returned to normal. The treatment regimen lasted for 15 days, during which the patient's symptoms steadily improved, and subsequent sputum and blood culture tests returned negative results. A follow-up CT scan showed a significant reduction in inflammation and consolidation in the right upper lobe. Consequently, the case exhibited marked improvement. The strain isolated from the blood culture of this patient was designated as CAP-AB strain YC128.
Antimicrobial susceptibility of the two A. Baumannii strainsThe minimal inhibitory concentrations (MICs) of YC128 and YC156 were determined using the agar dilution method, and the antimicrobial susceptibility results of the two strains are listed in Table 1. The data revealed that the CAP-AB strain YC128 was sensitive to all testing antimicrobial agents including families of aminoglycosides, fluoroquinolones, cephalosporins and carbapenems. On the other hand, the HAP-AB strain YC156 was a carbapenem-resistant A. baumannii (CRAB), exhibiting sensitivity only to Tigecycline (1 μg/ml) and Colistin (0.5 μg/ml) (Table 1).
Table 1 Antimicrobial susceptibility of the two A. baumanniiYC128 induced significantly increased mortality rate in miceIn the YC156 group, no mice died from intranasal inoculation with either 107 CFU or 108 CFU of bacteria. In contrast, within the YC128 and LAC-4 groups, all mice (10/10) that were intranasally inoculated with a bacterial suspension of 108 CFU died within 48 h. When a bacterial suspension of 107 CFU was administered, no participants (0/10) died in the YC156 group, 60% (6/10) died in the YC128 group, and 30% (3/10) died in the LAC-4 group. No mice died in the saline control group. Figure 1 illustrated the survival rate of mice inoculated with different A. baumannii strains. The mice mortality in the YC128 group was significantly higher than in the YC156 group (P < 0.01). Furthermore, when inoculated with 107 CFU of bacteria, the mice mortality rate in the YC128 group exceeded that in the LAC-4 group (60% vs. 30%). The survival curve analysis of the YC128 group and the LAC-4 group showed borderline significance (P = 0.074).
Fig. 1
YC128 induced significantly increased mortality rate in mice. Sixty mice were intranasally inoculated with A. baumannii in 50 μl of saline, with each group 10 mice, in addition, five mice was intranasally inoculated with 50 μl saline as negative control. a Every mouse in group YC128(H), LAC-4(H) and YC156(H) was inoculated with 108 CFU A. baumannii respectively. b Every mouse in group YC128(L), LAC-4(L) and YC156(L) was inoculated with 107 CFU A. baumannii respectively. (H: high A. baumannii suspension, 108 CFU; L: low A. baumannii suspension, 107 CFU)
YC128 induced significantly higher bacterial burdens in tissuesTwenty-four mice were intranasally inoculated with A. baumannii, with each group comprising 8 mice. In addition, 4 mice were intranasally inoculated with 50 μl of saline as a control. The bacterial loads of the inoculants were 5.0 × 10⁷ CFU for YC128, 4.5 × 10⁷ CFU for LAC-4, and 3.2 × 10⁷ CFU for YC156. To compare the tissue bacterial burdens of the three groups, four mice were sacrificed at 24 h and 48 h after inoculation in each group. Lungs, livers, and spleens were harvested, homogenized, and cultured on LB agar dishes, and bacterial colony-forming data were analyzed. At 24 h post-inoculation, the pulmonary bacterial burden in the YC128 group was 9.8 ± 7.9 × 10⁶ CFU/g tissue, for LAC-4 it was 2.5 ± 4.3 × 10⁵ CFU/g tissue, and for YC156 it was 2.7 ± 4.2 × 10⁴ CFU/g tissue. At 48 h post-inoculation, the pulmonary bacterial burden for YC128 was 4.3 ± 4.4 × 10⁷ CFU/g tissue, for LAC-4 it was 3.2 ± 1.7 × 10⁵ CFU/g tissue, and for YC156 it was 4.8 ± 5.5 × 10⁴ CFU/g tissue (Fig. 2a). The liver bacterial burden for YC128 and LAC-4 was 3.0 ± 0.7 × 10³ CFU/g tissue and 2.5 ± 2.6 × 10³ CFU/g tissue at 24 h, and 1.8 ± 1.1 × 10⁴ CFU/g tissue and 6.5 ± 3.1 × 10³ CFU/g tissue at 48 h (Fig. 2b). Meanwhile, the spleen bacterial burden for YC128 and LAC-4 was 5.3 ± 5.0 × 10³ CFU/g tissue and 1.8 ± 1.8 × 10³ CFU/g tissue at 24 h, 7.3 ± 5.1 × 10⁴ CFU/g tissue and 8.8 ± 6.3 × 10³ CFU/g tissue at 48 h (Fig. 2c). In contrast, the liver and spleen bacterial burdens for the YC156 group remained at 0 CFU/g tissue throughout the experiment. The lung, liver, and spleen bacterial burdens remained at 0 in the saline control group. The pulmonary, liver, and spleen bacterial burdens in the YC128 and LAC-4 groups were significantly higher than in the YC156 group. The tissue bacterial burdens of YC128 were consistently slightly higher than those of the LAC-4 group. At 48 h, the pulmonary bacterial burden of YC128 was significantly higher than in the LAC-4 group (P = 0.003), along with the spleen burden (P = 0.05). This suggests that the CAP-AB strain YC128, in comparison with the HAP-AB strain YC156, is a highly virulent strain, and the virulence of YC128 is slightly stronger than that of the highly virulent A. baumannii control strain LAC-4.
Fig. 2
YC128 induced significantly higher bacterial burdens in tissues. The bacterial burden of YC128, LAC-4 and YC156 in mice pneumoniae model. Twenty-four mice were intranasally inoculated with 107 CFU A. baumannii in 50 μl of saline, with each group 8 mice. Four mice were sacrificed at 24 h and 48 h after inoculation in each group. The lungs, liver and spleen from three mice were conducted quantitative culture. a Bacterial counting of lungs. b Bacterial counting of liver. c Bacterial counting of spleen
The inflammatory pathological changes of the YC128 infected mice were significantly more severe than the YC156 group.
Pathological analysis of the lungs by HE-staining revealed that the inflammatory pathological changes in mice of the YC128 group were significantly more severe than that in the YC156 group. In the YC128 group, the histopathology results demonstrated that the pulmonary interstitium of the mice exhibited moderate edema, accompanied by moderate invasions of lymphocytes and neutrophils into the pulmonary cavity. There was also moderate alveolus destruction and lung consolidation (Fig. 3a, b and c). Conversely, within the YC156 group, histopathologic changes displayed severe congestion and edema at 24 h after inoculation (Fig. 3d). At 48 h and 72 h, the experimental findings indicated the occurrence of lung consolidation, necrosis, and alveolus destruction. Concurrently, a significant number of mononuclear, lymphocytes, and neutrophils invaded the pulmonary and alveolar cavities (Fig. 3e and f).
Fig. 3
The inflammatory pathological changes of the CAP-AB infected mice were significantly more severe than the HAP-AB group. Pulmonary pathology of CAP-AB YC128 and HAP-AB YC156 group mice. a 24 h after YC156 inoculation. Moderate edema in pulmonary interval (red arrow), some lymphocytes and neutrophils invasion (black arrow). b 48 h after YC156 inoculation. Focal infiltration of lymphocytes and neutrophils in bronchial epithelium (black arrow), protein effusion with inflammatory cell infiltration in some alveolus (red arrow). c 72 h after YC156 inoculation, some of the alveolus atrophy and lung consolidation (black arrow), focal intra alveolar hemorrhage (red arrow). d 24 h after YC128 inoculation. Most alveoli atrophy, lung consolidation (black arrow), the alveoli fused into large alveoli (red arrow). e 48 h after YC128 inoculation. Lung consolidation, destruction of alveolus, mononuclear and neutrophils invasion (black arrow), some alveolis fused into large alveoli (red arrow). f 72 h after YC128 inoculation. Lung consolidation, destruction of alveolus (black arrow) with a large number of mononuclear, lymphocytes and neutrophils invasion (red arrow)
YC128 induced more severe pneumonia that is proved by chest CT scanThe chest CT scan images of theYC128 and YC156 mice are shown in Fig. 4. In the YC128 group, The CT scans displayed slight patchy opacities in both lungs at 24 h (Fig. 4a), followed by increased patchy opacities in both lungs at 48 h (Fig. 4b). Subsequently, the images showed patchy opacities almost returned to normal at 72 h (Fig. 4c). Conversely, in the YC156 group, the image exhibited slight patchy opacities in both lungs at 24 h (Fig. 4d). By 48 h, severe inflammation and complete consolidation were observed in the entire left lung, alongside localized patchy opacities in the right lung (Fig. 4e). The inflammation worsened progressively, leading to consolidation in both lungs resembling a "white lung" appearance by 72 h (Fig. 4f).
Fig. 4
YC128 induced more severe imaging changes shown in chest CT scan. a 24 h after YC156 inoculation. Slight patchy opacities in both lungs. b 48 h after YC156 inoculation. Moderate patchy opacities in both lungs. c 72 h after YC156 inoculation. Patchy opacities alleviation in both lungs. d 24 h after YC128 inoculation. Slight patchy opacities in both lungs. e 48 h after YC128 inoculation. Complete consolidation was present in the whole left lung and local patchy opacities in the right lung. f 72 h after YC128 inoculation. consolidation appeared in bilateral lungs like “white lung”
YC128 induced more rapid and severe pro-cytokines expressions in the lungThe local (lung) levels of cytokines/chemokines (IL-1β, IL-6, TNF-α, and CXCL1) were detected by RT-qPCR, and the cytokines/chemokines expressions in the lung are shown in Fig. 5. The designated time points were 0 h, 24 h, 48 h, and 72 h post-inoculation. Regarding the IL-1β expression level in the lung of the two groups, group YC128 reached its peak at 24 h, exhibiting a 48-fold increase compared to the baseline at 0 h. In contrast, group YC156 only increased by 19-fold, a significantly lower increase than the YC128 group (P = 0.020). At 48 h post-inoculation, group YC156 continued to rise, reaching a 40-fold increase. On the other hand, the IL-1β expression level in group YC128 decreased to a 27-fold increase. Subsequently, the expression levels decreased to 28-fold for both groups at 72 h. However, the maximum expression level in group YC128 was 8-fold higher than in YC156 (Fig. 5a). Similar expression patterns of IL-6 and CXCL1 were observed in the two groups. The expression levels of YC128 reached their peak at 24 h, significantly higher than those of the YC156 group. For IL-6, group YC128 reached its peak at 24 h, exhibiting a 23-fold increase, whereas group YC156 increased by only 1.2-fold (P = 0.020). In group YC156, the peak level was reached at 48 h (fivefold), which was 18 times lower than the peak in group YC128 (Fig. 5b). As for CXCL1, group YC128 reached its peak at 24 h (98-fold), while group YC156 increased by 12-fold (P = 0.036). The peak level for group YC156 appeared at 48 h (30-fold), resulting in a 68-fold difference between the peaks of the two groups (Fig. 5d). The difference in TNF-α expression level peaks between the two groups was not significant. In the YC156 group, it increased by 866-fold at 48 h, and in the YC128 group, it increased by 922-fold at 24 h compared to the baseline level at 0 h (Fig. 5c).
Fig. 5
YC128 induced more rapid cytokines expressions in the lung. The local level in lung of cytokines/chemokine were detected by RT-qPCR. a IL-1β. b IL-6. c TNF-α. d CXCL1
YC128 showed significant stronger in vitro anti-phagocytosis ability than that of YC156Each well was supplemented with 20 μl of YC128 and YC156 bacterial suspension, each at a specific concentration, into peritoneal macrophages isolated from 5 mice. After two hours, the macrophage culture medium was collected, and then the wells were treated with sterile water to lyse the macrophages. The resulting suspension was subsequently cultured to quantify the intracellular bacterial count. The findings demonstrated that the intracellular bacterial count within macrophages of YC128 was significantly lower than that of YC156 (1.5 ± 1.4 × 10⁶ CFU/ml vs. 5.3 ± 4.7 × 10⁶ CFU/ml, P = 0.0054) (Fig. 6a). The previously collected cell culture medium was assayed to determine the extracellular bacterial count. The results indicated that the extracellular bacterial count was similar between the two groups (Fig. 6b).
Fig. 6
YC128 showed significant stronger in vitro anti-phagocytosis ability than that of HAP-AB strain. Peritoneal macrophages isolated from 5 mice and each mouse macrophages were distributed into 6 wells. Then, 20 μl per well of YC156 and YC128 bacterial suspension were added into the cell culture. After two hours later, the cell culture medium was collected to quantify the extracellular bacterial number. Then the wells were washed using ice-cold PBS and sterile water added into wells to lysis macrophage. Two hours later, the suspension was cultured to quantify the intracellular bacterial number. a Intracellular bacterial number. b Extracellular bacterial number
Characterization of antimicrobial resistance and virulence genes of YC128 and YC156Comparing the results of Whole Genome Sequencing (WGS) for YC128 and YC156, it was observed that 169 virulence-related genes, including Acinetobacter trimeric autotransporter (Ata) and Type IV pili (TFP) ect., were nearly identical between the two strains [12]. Additionally, 30 virulence-related genes were exclusively identified in YC128 but not in YC156. Among these, 11 genes were related to capsules [13], and there was also a cluster of genes associated with the Type VI secretion system (T6SS) [14] (Fig. 7a). Remarkably, YC128 contained a complete set of T6SS genes (13 in total) as well as genes encoding T6SS secreted effectors [15]. On the other hand, YC156 exhibited only one gene (T6SS tip protein VgrG) from the T6SS gene cluster [16]. Most of the T6SS genes and T6SS secreted effector genes were absent in YC156 due to this deficiency. This indicates that YC128 possesses the ability to express T6SS, whereas YC156 lacks this capability. Thus, it can be deduced that T6SS plays a pivotal role in the hypervirulence of YC128. The WGS results also revealed that YC128 had no acquired antimicrobial resistance (AMR) genes except for the chromosome carrying β-lactamase genes (blaADC-25 and blaOXA-91). In contrast, YC156 harbored 16 AMR genes, including β-lactamase genes such as blaADC-25, blaOXA-23, blaOXA-66, blaOXA-91, and blaTEM-1D, as well as genes related to sulfamide resistance (Sul1) and aminoglycoside resistance (ant(3'')-Ia and armA) [17] (Fig. 7b).
Fig. 7
The Comparisons of Whole Genome Sequencing between YC128 and YC156. a Virulence related genes. b Antimicrobial resistance genes
留言 (0)