
記住我


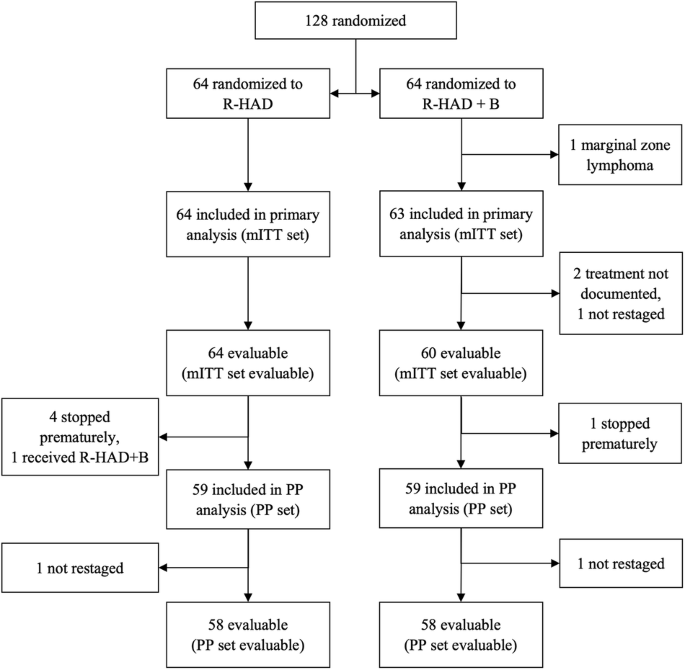

At the cut-off date of January 10, 2023, 263 patients have been documented in the registry and 240 formed the core of the present analysis. Twenty-three patients were excluded due to lack of accurate diagnosis of BP, evidence for BP before January 1st, 2015, or incomplete data. A flow chart of patients documented and analyzed is presented in Fig. 1.
Fig. 1: Consort diagram of patients included in the registry and in the analysis.
BP blast phase, CP chronic phase.
Patients’ characteristics are reported in Table 1. The availability of TKI by participating countries is detailed in Supplementary Table 1. Median age at diagnosis of BP was 49 years and 60.0% of patients were male. Eighty-nine patients (37.0%) where diagnosed with a de novo BP. For those patients diagnosed with a previous CML, median time between CML diagnosis and evolution to BP was 29.1 months (range, 1–378). Two BP occurred in patients that had stopped TKI within a treatment free remission concept.
Table 1 Patients and disease characteristics.Information about additional chromosomal abnormalities (ACAs) was available in 174/240 patients, of which 101 (58.0%) had at least one ACA. The most frequent high-risk abnormality (29.9%) was a complex karyotype, followed by +8, additional Philadelphia chromosome (+22q-), deletion of chromosome 7/7q, and abnormalities of chromosome 3q26.2 (Table 1).
BCR::ABL1 transcript type was e13a2 and/or e14a2 in 90.7% (117/129) of patients. Twelve patients had atypical transcripts (Table 2 and Supplementary Table 2). BCR::ABL1 mutations occurred in 28.0% of the patients. As expected, the most frequently BCR::ABL1 mutation reported was T315I (12 cases), followed by E255K (n = 11), F317L (n = 5), and Y253H (n = 5) (Table 2). Eleven patients had more than one BCR::ABL1 mutation. Thirty mutations in genes other than BCR::ABL1 were reported in 21 patients investigated (Supplementary Table 3). The type of mutation was heterogeneous, with no unifying pattern.
Table 2 Type of BCR::ABL1 transcript and occurrence of mutations for all patients and for patients with secondary or de novo CML-BP.Information regarding central nervous system (CNS) and extramedullary involvement were reported in 214 and 220 patients respectively. Of these 9.8% had CNS involvement and 19.5% extramedullary manifestations.
ELTS score at the time of CML diagnosis was available for all 151 patients with a previous CML, and was low risk in 39.6%, intermediate risk in 36.3% and high-risk in 24.2% of them (Table 1).
TreatmentTreatment of BP was heterogeneous with regard to sites and individual patient. The median number of lines of therapy for BP was 3. One-hundred and thirty-two out of 240 patients (55.0%) received at least one alloSCT for their BP during the course of the disease. Additional 16 patients had previously received an alloSCT in the CML-CP and progressed to BP after transplant. Regarding treatment given at the first occurrence of BP, 232 patients had complete data and could be analyzed. TKIs were the cornerstone of BP treatment, with only 16.9% of patients not receiving a TKI. The combination employed most frequently was a TKI plus chemotherapy (42.7% of cases), followed by TKI alone (21.1%). TKI plus chemotherapy and alloSCT was used in 15.1%, whilst 10 patients received TKI and alloSCT. For those patients receiving alloSCT, the median time from BP diagnosis to transplantation was 6 months.
At initial therapy, dasatinib was the most frequently used TKI (32.3%), followed by imatinib and ponatinib (26.7% and 13.4%, respectively). Median duration of TKI therapy was 121 days for dasatinib, 94 days for imatinib and nilotinib and 87 days for ponatinib. Bosutinib was given in first line in 4 patients only, with a median duration of therapy of 187 days. The different treatment combinations in first line and for all lines of treatment as well as the frequency of the usage of the various TKIs is reported in Supplementary Tables 3 and 4.
CNS prophylaxis or CNS therapy was used in 44 patients. Twenty-three additional patients received systemic chemotherapy containing drugs active on the CNS, such as methotrexate and lomustine.
Looking at factors that might influence choice of first line treatment, patients treated with dasatinib were more likely to be younger than patients receiving other TKIs (median: 45 vs. 50 years, p = 0.0291). Similarly, patients receiving alloSCT were in median younger than patients not being transplanted (median 43 vs. 50 years, p = 0.010). In contrast, ponatinib patients were older (median 53 vs 47 years, p = 0.0219). Patients with a shorter CP duration before evolution in BP were more likely to be treated with dasatinib (median 16 vs. 34 months, p = 0.0060) and alloSCT (median 14 vs. 31 months, p = 0.0394). Imatinib was given predominantly in cases where no BCR::ABL1 mutations were present with a frequency of 29.7% compared to only 9.5% in the presence of a BCR::ABL1 mutation (p = 0.0111). Ponatinib was the more frequently used TKI when BCR::ABL1 mutations were present (35.7% vs. 11.0%, p = 0.0007). Treatment was influenced also by the phenotype of BP. Chemotherapy and alloSCT were used more often in patients with a lymphoid BP (LyBP) as compared with patients with a myeloid BP (MyBP) (odds ratio [OR] 5.10, 95%-confidence interval [CI]: 2.1–12.1, p < 0.0001 and OR 2.37, 95%-CI: 1.2–4.8, p = 0.0181, respectively).
ResponsesResponses were evaluated at three and at 6 months after onset of BP. Three months response data were evaluable for 134 patients, including 21 (15.7%) patients with early death during the first 3 months after diagnosis of BP. Thirty-four patients (25.4%) did not achieve any response and remained in BP. Sixty-seven (50.0%) and 38 (28.4%) patients achieved at least a complete hematologic response (CHR) and a complete cytogenetic response (CCyR), respectively. Major molecular response (MMR) was achieved in 27 patients (20.1%), with 12 (9.0%) each achieving MR4.5 (BCR::ABL1 transcript levels ≤0.0032% on the international scale, IS [29]) and MR5 (BCR::ABL1 transcript levels ≤0.001% IS [29]) (Table 3). When censoring for alloSCT, results did not change significantly, since only three patients had an outcome measurement after alloSCT.
Table 3 Responses to therapy of CML-BP.Six-month data were evaluable for 112 patients, of which 33 (29.5%) had died before this milestone. Of evaluable patients, 57 (50.9%) achieved at least a CHR and 48 (42.9) achieved a CCyR at 6 months. MMR was achieved in 44 patients (39.3%), MR4.5 and MR5 in 27 (24.1%) and 21 (18.8%), respectively. The proportion of patients who did not respond to treatment was 17.0% (19 patients). Eleven of these results were obtained after alloSCT. Best response achieved at any time during treatment is available in 184 patients (Table 3). Best response results depend heavily on individual observation times, as patients with shorter observation times might still improve their responses in the future. For this reason, these results are to be interpreted purely descriptive, and, in contrast to the 3- and 6-months’ time-points, should not be generalized. When censoring responses for alloSCT, the rates of CHR, CCyR, MMR and MR5 was 68.9%, 51.2%, 38.2%, and 12.2%, respectively. After alloSCT, the proportion of patients achieving an MMR increased to 59.2%, with 41.8% of patients achieving MR5.
Comparison between BP from previously diagnosed CML and de novo BPGiven the relatively high number of patients with de novo BP in our series, differences between these patients and those whose BP evolved from a preceding CP (secondary BP) were explored. Age distribution was similar in the two groups (Table 4). The proportion of female patients was higher in de novo BP (47.2% vs. 35.8%), although the difference was not statistically significant. The phenotypic presentation between de novo BP and secondary BP was comparable, yet atypical transcripts were more frequent in de novo BP (3.9% vs. 17.0%, p = 0.028). High risk ACAs and mutations in the BCR::ABL1 gene were more frequent in secondary BP patients. Interestingly there was no significant difference between the two groups regarding the proportion of patients presenting with CNS or extramedullary involvement (Table 4).
Table 4 Comparison between CML-BP as evolution of a chronic phase (secondary BP) and de novo CML-BP.Patients diagnosed with de novo BP received most frequently imatinib (OR 13.09, 95%-CI: [6.44; 26.63], p < 0.001) as first line treatment. Only patients with a secondary BP received ponatinib in first line (21.4%, p < 0.0001). The other treatments were relatively balanced between the two groups (Supplementary Table 3).
Regarding treatment efficacy, response distributions at 3 and 6 months were not significantly different when comparing secondary BP to de novo BP. Nevertheless, patients with de novo BP tended to have a better outcome at the 6-month time-point, although significance was not reached (Mann–Whitney test p = 0.06)
SurvivalWith a median follow up of 27.8 months, median overall survival was 23.8 months (95% CI: 17.0–34.8, Fig. 2). There was almost no difference in survival in patients with CNS or extramedullary involvement as compared to patients without these high-risk characteristics (median 28.5 vs. 23.8 months, HR 1.17 [95% CI: 0.73–1.88], p = 0.519, Fig. 3A). Conversely, patients with de novo BP had a better outcome then patients with a preceding CP (median 29.7 vs. 18.0 months, HR 0.80 [95% CI: 0.66–0.98], p = 0.032, Fig. 3B), as did patients with a lymphoid phenotype (median 32.2 vs. 17.0 months for LyBP vs. MyBP, HR 0.54 [95% CI: 0.34–0.86], p = 0.009, Fig. 3C). Patients with a low ELTS score at diagnosis of CML [30] and patients with de novo BP had rather comparable outcomes (median 34.8 vs. 29.7 months for low ELTS and de novo BP respectively, HR 1.09 [95% CI: 0.68–1.75], p = 0.713), significantly better than the outcome of patients with intermediate (11.4 months, HR 2.35 [95% CI: 1.35–4.11], p = 0.003) or high (9.9 months, HR 2.75 [95% CI: 1.57–4.81], p < 0.001) ELTS score (Fig. 3D). Patients with ≥30% blasts had a 1.7-times higher hazard of dying than patients with 20–29% blasts, however, the differences were not significant (median survival: 20.7 for patients with 20–29% blasts vs. 15.7 months for patients with ≥30% blasts). When differentiating between de novo BP and secondary BP, survival was comparable between both blast categories in de novo patients (HR: 1.19 [95% CI: 0.47–2.99], p = 0.706). Conversely, a minor and not significant difference between patients with ≥30% and 20–29% blasts (HR: 2.10 [95% CI: 0.94–4.74], p = 0.072) was found in patients with preceding CP.
Fig. 2: Overall survival from diagnosis of blast phase (all population).
Median follow up 27.8 months.
Fig. 3: Overall survival from diagnosis of blast phase according to different subgroups.
A overall survival for patient with central nervous system (CNS) and/or extramedullary (EM) involvement compared to patients without CNS and extramedullary involvement; B Overall survival for patient with de novo blast phase (CML-BP) and blast phase evolving from a previous chronic phase (CML-CP); C overall survival according to disease phenotype (myeloid vs. lymphoid); D overall survival according to disease phase (de novo) and ELTS score at the time of chronic phase (ELTS low, ELTS intermediate, ELTS high) [low ELTS vs. de novo HR 1.09 [95% CI: 0.68–1.75], p = 0.713, low ELTS vs. intermediate ELTS HR 2.35 [95% CI 1.35–4.11], p = 0.003, low ELTS vs. high ELTS HR 2.75 [95% CI: 1.57–4.81], p < 0.001]. All p values have to be interpreted as exploratory.
留言 (0)