
記住我


Acute ischemic stroke (AIS) is a highly heterogeneous disease characterized by a high risk of morbidity, disability, recurrence, and mortality (1, 2). It has been reported that the number of IS-related deaths is expected to increase further from 3.29 million in 2019 to 4.90 million by 2030 (3). Administration of antiplatelet and statin drugs in AIS patients is recommended by the American Heart Association (AHA) to reduce the risk of stroke recurrence and cardiovascular events (4). However, despite patients following the therapies of the guidelines, there is a substantial risk of recurrent stroke in AIS patients (5). A major barrier to intervention is the high heterogeneity of AIS. Therefore, stratifying the heterogeneity of AIS using multiple features can identify undescribed phenotypes that may respond differently to medication, making it possible to offer more personalized treatment to AIS patients. Recently, Ding et al. (6, 7) used unsupervised clustering algorithms to identify novel phenotypes with distinct traits in non-cardioembolic ischemic stroke (NCIS). Similarly, Chen et al. (8) and Schütz et al. (9) used the latent class analysis method to reveal the potential phenotypes of ischemic stroke with obstructive sleep apnea (OSA). Likewise, Lattanzi et al. (10) adopted the hierarchical cluster analysis to distinguish clinical phenotypes of the embolic stroke of an undetermined source. These studies elucidate the new tendency to discover potential phenotypes by understanding the heterogeneity of diseases based on a clustering algorithm.
The k-means clustering, as an unsupervised learning algorithm, can classify unlabeled data by maximizing the heterogeneity within different phenotypes (11) and also can identify similarities of potential phenotypes in a dataset (12). A large body of research work has shown that the k-means clustering algorithm can be used to reveal novel phenotypes of stroke (13), sepsis (14, 15), early-onset Alzheimer's disease (16), postoperative delirium symptoms (17), and coronary heart disease (CHD) (18), which can help to understand the potential pathogenesis and treatment respondence of diseases. For instance, with the availability of laboratory data, Guo et al. (15) used k-means clustering to categorize sepsis phenotype, reflecting the severity of sepsis and treatment effects. Similarly, Sriprasert et al. (18) classified postmenopausal women into different phenotypes based on nine metabolic laboratory indicators, revealing the relationship of subtypes to subclinical atherosclerosis.
Although clinical laboratories produce large amounts of laboratory results each day to assist clinical diagnosis (19), these data are not fully utilized (20). Hence, Wen et al. proposed a concept of clinical laboratory omics (Clinlabomics) using machine learning (ML) or deep learning algorithms to establish models based on clinical and laboratory data that can reveal valuable information hidden in a great deal of data (20).
Therefore, the objectives of this study were to investigate novel phenotypes of AIS patients based on clinical and laboratory data using a k-means clustering algorithm and maximizing the heterogeneity, compare the differences among phenotypes based on demographic, clinical, individual traits, physiological indices, and laboratory data, develop Clinlabomics models of AIS phenotypes, and evaluate the diagnostic performance of models, which have not been done previously.
Methods Study design and populationThis study consecutively enrolled AIS inpatients attending Lanzhou University Second Hospital between Dec 2019 and Dec 2022. Furthermore, we also prospectively collected AIS patients from January 2023 to January 2024 as an external validation dataset. The inclusion criteria were as follows: (1) age ≥18 years old; (2) first-ever AIS at admission within 24 h. Patients were excluded for malignant tumors, mental conditions, autoimmune diseases, intracranial hemorrhage, infection within 2 weeks before the onset of stroke, recurrent stroke, transient ischemic attacks (TIA), treated with anticoagulation or reperfusion, or missing data >5%. AIS, as defined by the World Health Organization (WHO), is a clinical syndrome with rapidly developing neurological deficit due to cerebrovascular cause, persisting for more than 24 h or death (21). The AIS was confirmed by computed tomography (CT) scan or diffusion weight imaging (DWI) on admission. Further, we also included a control group with 484 inpatients without any type of current or prior cerebral infarction but possessing clinical manifestations similar to AIS patients. This study was approved by the Ethics Committee of the Lanzhou University Second Hospital (IRB number: 2022A-710). Informed consent was obtained from all participants.
Clinical and laboratory data collectionMedical records provided routinely available clinical data, including demographic data (age, gender, nationality, education, marriage), individual traits (height, weight, body mass index), vascular risk factors (the history of hypertension, diabetes, atrial fibrillation, coronary disease, and unhealthy habits including smoking and drinking), physiological indices (heart rate, oxygen saturation, blood pressure), the National Institutes of Health Stroke Scale (NIHSS) score that evaluates the stroke severity, Glasgow coma scale (GCS) that determines the degree of coma, modified Rankin scale (mRS) that assesses the degree of disability caused by stroke, Trial of Org 10172 in Acute Stroke Treatment (TOAST) classification that classifies etiological subtypes, and CT or DWI results that confirm the location and numbers of lesions. Based on the NIHSS score, scores of 1–4, 5–15, 16–20, and 21–42 were regarded as mild, moderate, moderate-to-severe, and severe stroke, respectively (22). An experienced senior neurologist (BY) examined and verified the NIHSS score, GCS, mRS, and TOAST classification in all included patients. There was a green channel for patients suspected of AIS, whose blood collection and detection were conducted immediately upon admission. In general, the results of complete blood count (CBC), biochemical tests, and coagulation examinations needed to be reported in 10, 30, and 30 min, respectively. Laboratory test results on admission were collected from the laboratory information system (LIS).
Variable selectionIn total, we collected data on 97 variables, where 76 variables could be measured, detected, or calculated. The calculation formula of inflammatory biomarkers was as follows: neutrophil to lymphocyte ratio (NLR) = neutrophil (NEU)/lymphocyte (LYM); lymphocyte to monocyte ratio (LMR) = LYM/ monocyte (MON); monocyte to high-density lipoprotein-cholesterol ratio (MHR) = MON/ high-density lipoprotein-cholesterol (HDL-C) (23); neutrophil to high-density lipoprotein-cholesterol ratio (NHR) = NEU/HDL-C (23); systemic immune-inflammation index (SII) = platelet (PLT) × NLR (24); system inflammation response index (SIRI) = NUE × MON/LYM (24); multi-inflammatory index 1 (MII-1) = NLR × C-reaction protein (CRP) (25); multi-inflammatory index 2 (MII-2)=PLT/LYM × CRP (25); multi-inflammatory index 3 (MII-3) = (PLT × NLR) × CRP (25); red blood cell distribution width to platelet ratio (RPR) = red blood cell distribution width coefficient of variation (RDWCV)/PLT (26). Additionally, we used the ln [total triglyceride (TG) (mg/dL) × fasting blood glucose (FBG) (mg/dL)/2] formula to calculate the triglyceride-glucose (TyG) index (27). The corresponding lipid parameters of the atherogenic index of plasma (AIP), lipoprotein combine index (LCI), non-high-density lipoprotein-cholesterol (non-HDL-C), atherogenic coefficient (AC), Castelli's index-I (CRI-I), and Castelli's index-II (CRI-II) were calculated by lg (TG/HDL-C) (28), total cholesterol (TC) × TG × low-density lipoprotein-cholesterol (LDL-C)/HDL-C (29), TC–HDL-C (30), non-HDL-C/HDL-C (31), TC/HDL-C (31), and LDL-C/HDL-C (31), respectively. We classified the 76 variables into 11 domains according to their commonality, including non-invasive physiological indices, individual characteristics, inflammatory biomarkers, red blood cell-related parameters, lipid parameters, diabetes-related biomarkers, renal function indicators, ions, liver function-related indicators, myocardial injury markers, and coagulative markers. Categorical variables, such as gender and stroke severity, were excluded because of the requirements of clustering analysis.
Statistical analysesA normal distribution of data was determined by the Kolmogorov-Smirnov test. The use of frequency counts and proportions (n%) expressed categorical variables that were compared using the Chi-square test and Fisher's exact test, if appropriate. Mean and standard deviation (SD), namely mean ± SD, was used to express normally distributed continuous variables, which were compared by a t-test. In contrast, non-normally distributed continuous variables were presented using median and interquartile range (IQR), namely M (Q1 - Q3), and compared by the Mann–Whitney U-test. The k-means clustering algorithm was used to identify novel phenotypes of AIS patients, where the optimal k was determined by the elbow method (32). The original data was transformed into standardized values (mean = 0, SD = 1) for clustering analysis. This clustering algorithm can partition observations into k clusters by assigning each observation to the nearest centroid (33). Once determined the phenotypes of AIS, we performed intergroup comparisons for the identification of significantly different variables. Further, a chord diagram was used to visualize abnormal variables classified by phenotype.
Before constructing models, we used the least absolute shrinkage and selection operator (LASSO) algorithm to perform variable selection for eliminating high multicollinearity variables (34). Subsequently, we used a random sampling method to divide patients in a 7:3 ratio into training and testing datasets. Next, a support vector machines (SVM) classifier was adopted to establish Clinlabomics predictive models, also regarded as phenotype classifiers, of AIS novel phenotypes. The SVM algorithm, which performs perfectly in dealing with both linear and non-linear data, can project training datasets into a multidimensional space, using a hyperplane to classify data (35), thus avoiding the overfitting problem (36). Receiver operating characteristic curves (ROC) were used to determine the optimal cut-off values of models, and the predictive performance of models was assessed by area under the receiver operating characteristic curve (AUC), accuracy, sensitivity, specificity, positive predictive value (PPV), and negative predictive value (NPV). All statistical analyses were performed on RStudio software (R version 4.3.0). A two-tailed p < 0.05 was regarded as statistical significance.
Results Baseline characteristics of the study populationIn total, we retrospectively included 909 AIS patients [median age: 64 (IQR: 17) years, 69% male] and 484 non-AIS subjects [median age: 66 (IQR: 15) years, 53% male]. In addition, we also prospectively collected 507 AIS patients [median age 60 (IQR: 18) years, 70% male] as validation dataset to verify the robustness of the k-means clustering algorithm. Figure 1 shows the detailed patient selection process and flow chart of this study. Table 1 summarizes the characteristics of the participants. There were no significant differences in age, nationality, marriage, history of atrial fibrillation (AF) and CHD, heart rate (HR), oxygen saturation in arterial blood (SaO2), body mass index (BMI), mean corpuscular hemoglobin (MCH), RDWCV, TC, LDL-C, non-HDL-C, urea, urea to creatinine ratio (UCR), calcium (Ca), total bilirubin (TBIL), indirect bilirubin (IBIL), aspartate aminotransferase (AST), albumin (ALB), creatine kinase (CK), international normalized ratio (INR), thrombin time (TT), and fibrin degradation products (FDP) between the two groups (all p > 0.05).
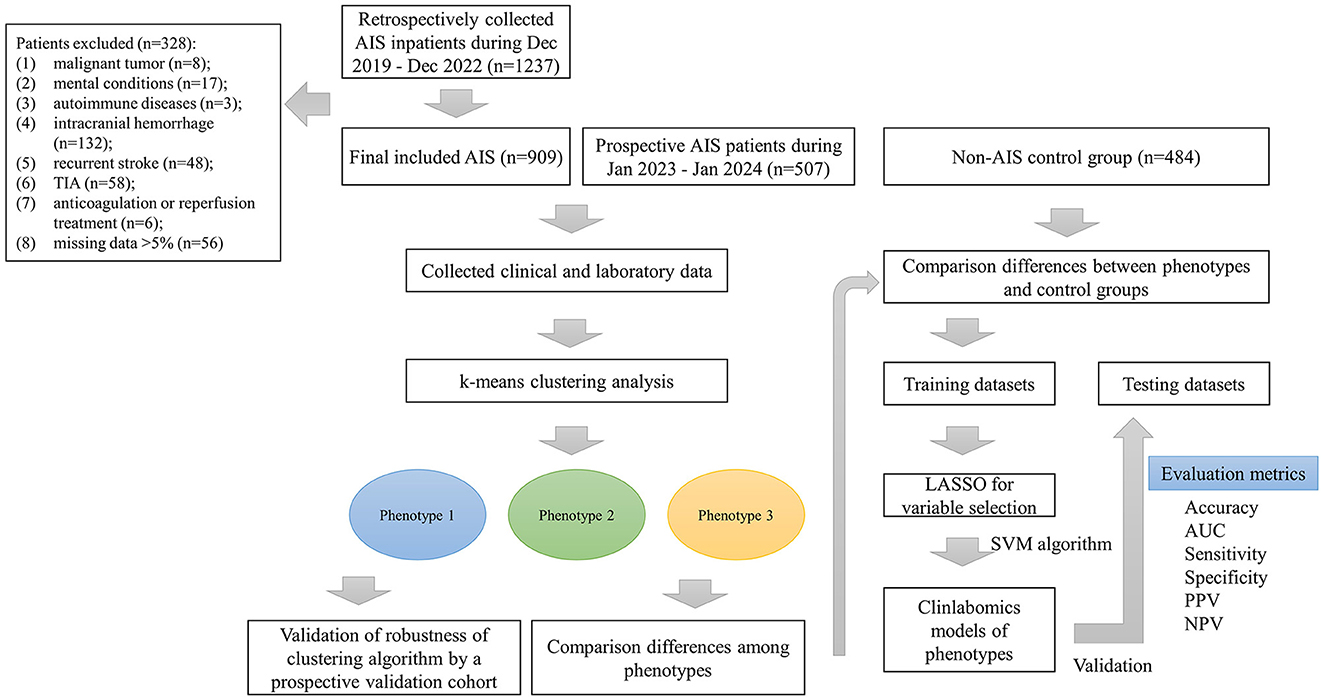
Figure 1. The patient selection process and flow chart. AIS, acute ischemic stroke; TIA, transient ischemic attack; LASSO, the least absolute shrinkage and selection operator; AUC, the area under curve; PPV, positive predictive value; NPV, negative predictive value.
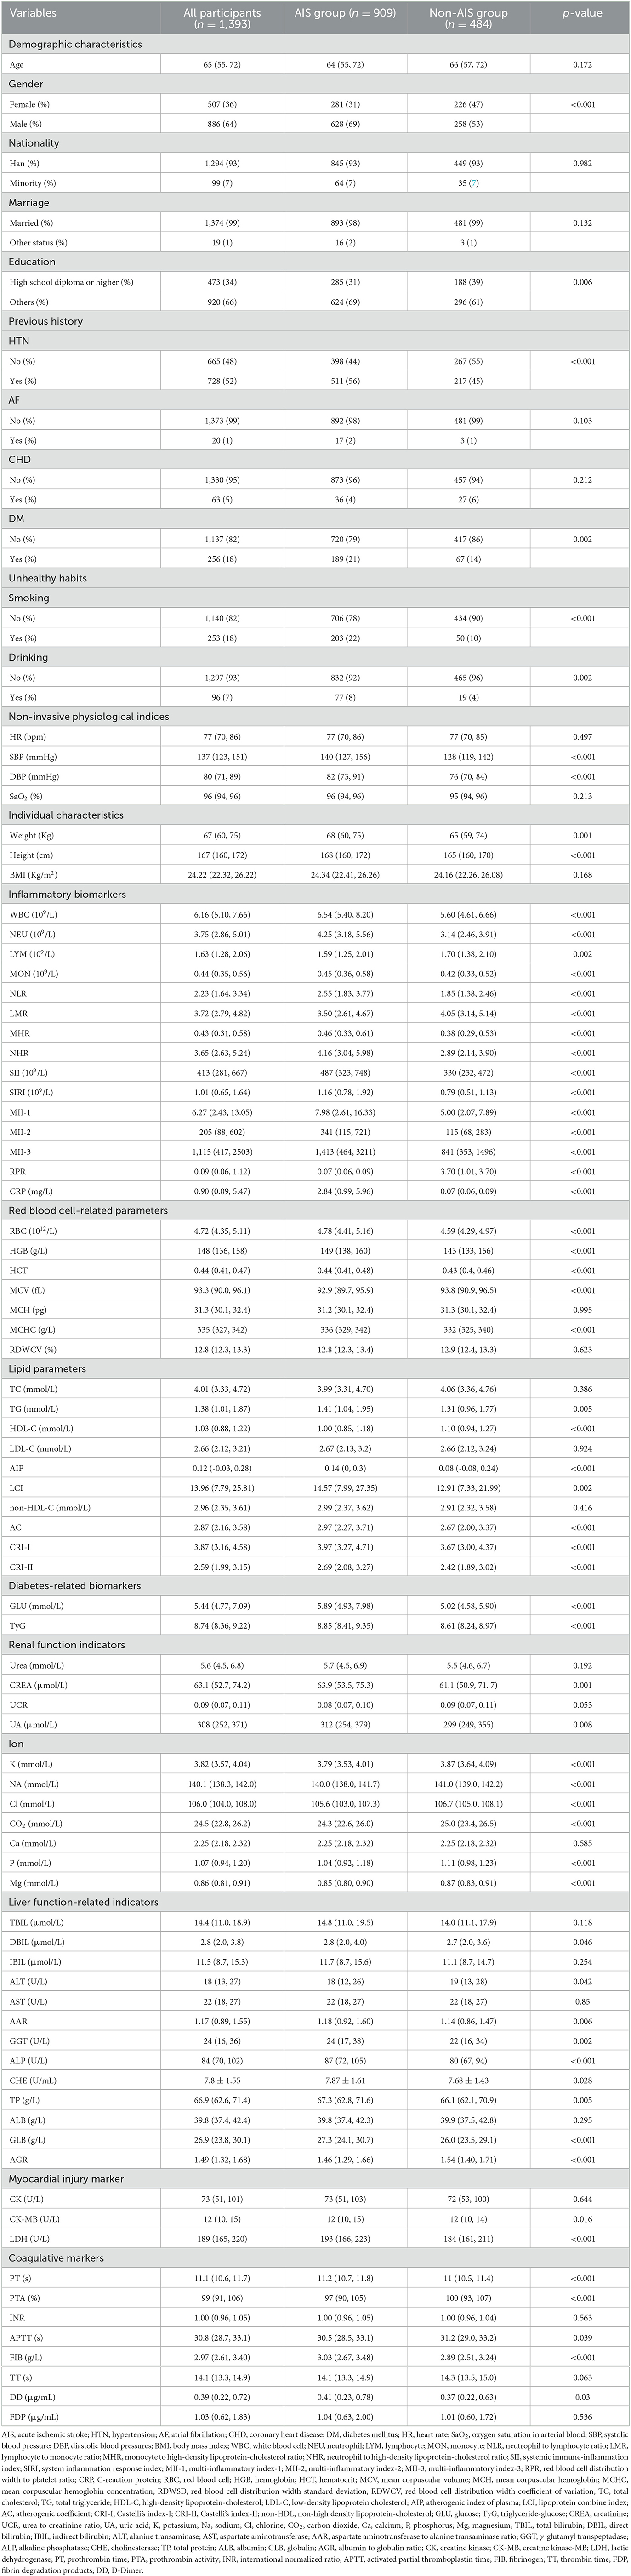
Table 1. Baseline characteristics of included participants in the retrospective cohort.
K-means clusteringWe used the elbow method to determine the optimal k value of 3 (Figure 2A) and divided 909 AIS patients into three novel phenotypes (Figure 2B). Figure 3 describes the abnormal variables of three phenotypes. Patients in phenotype 1 (n = 401) were relatively young and obese and had significantly elevated levels of lipids. Phenotype 2 (n = 463) was associated with abnormal ion levels. Phenotype 3 (n = 45) was characterized by the highest level of inflammation, accompanied by mild multiple-organ dysfunction. Table 2 compares the statistical difference among phenotypes in demographic, clinical characteristics, and laboratory data.
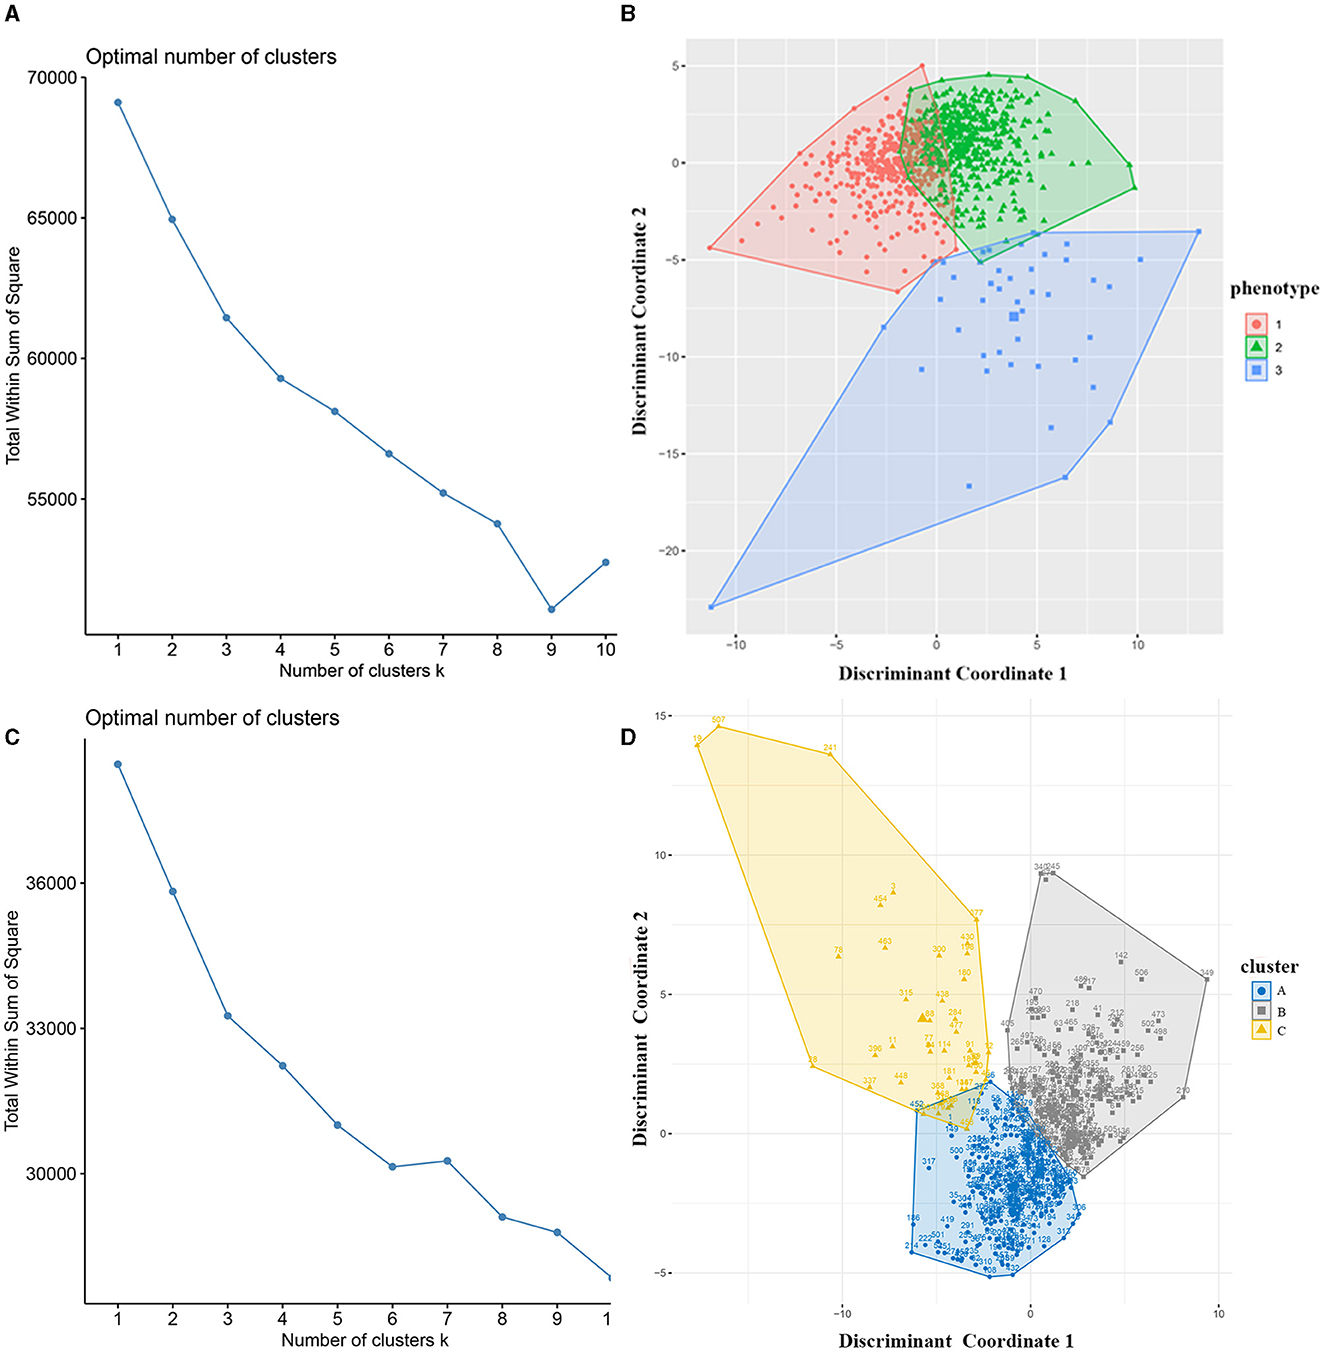
Figure 2. Identification of phenotypes of AIS patients using k-means clustering. (A) The optimal k value was determined using the elbow method; (B) Plotting of individual observations of each phenotype in discriminant component space; (C) The optimal k value in the validation cohort; (D) Individual observations of each cluster in discriminant component space in the validation dataset. AIS, acute ischemic stroke.
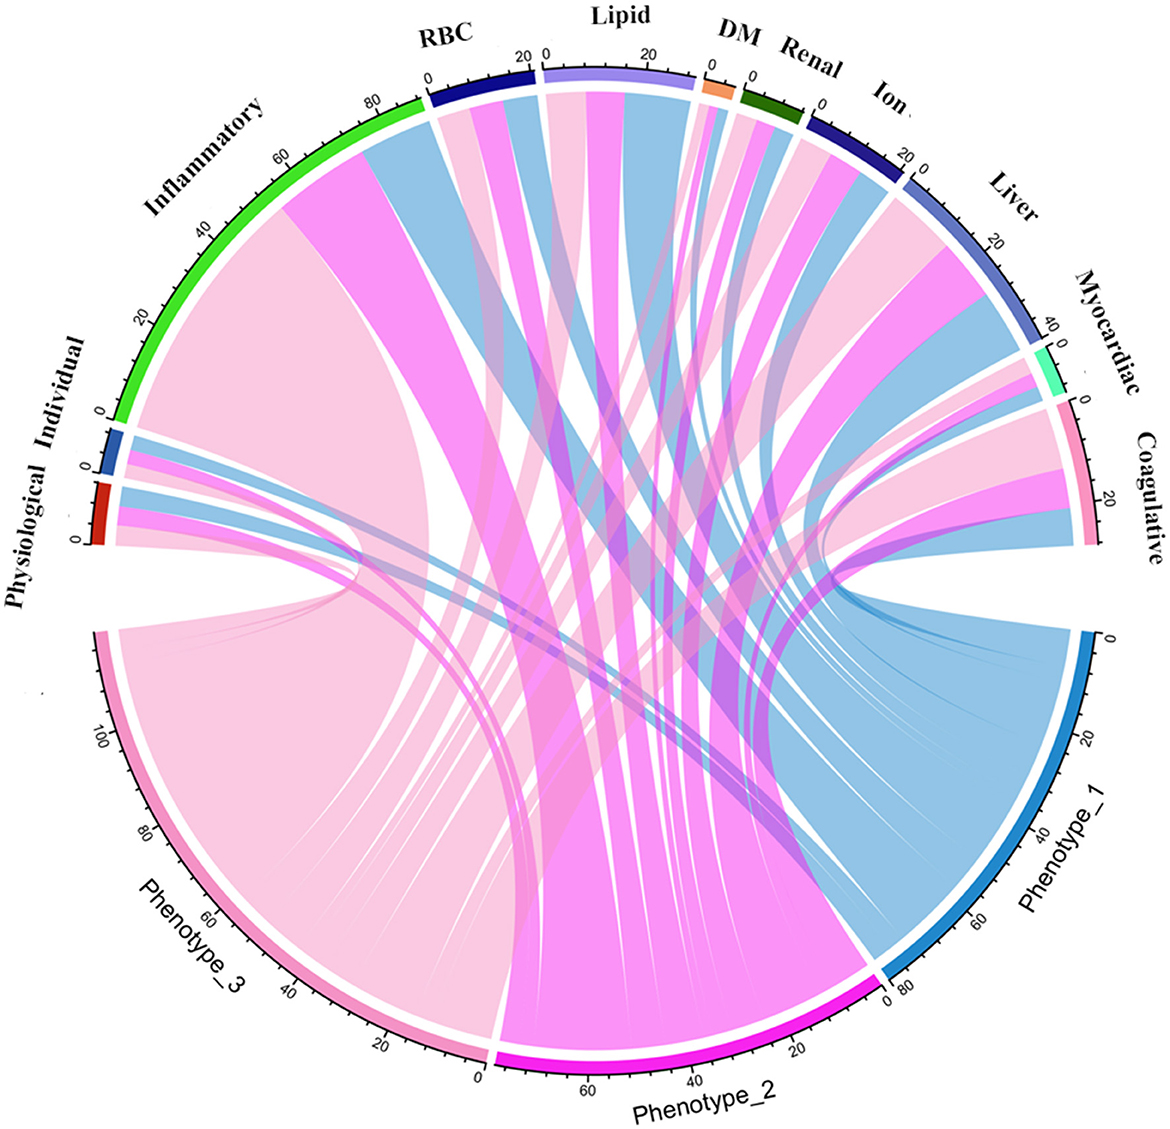
Figure 3. Chord diagrams show the relationships between phenotypes and 11 domains. RBC, red blood cell; DM, diabetes mellitus.
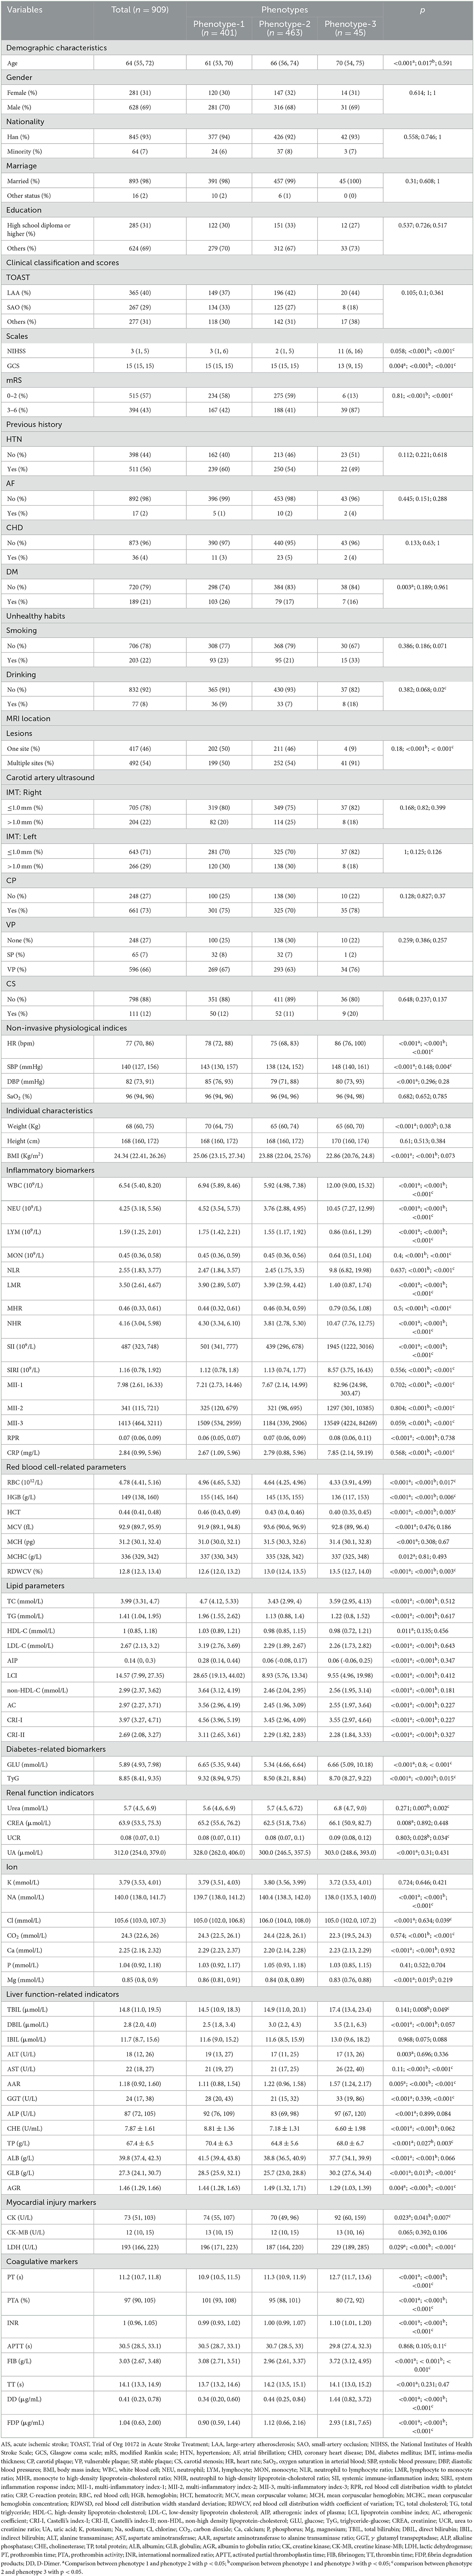
Table 2. Characteristics of three phenotypes based on the k-means clustering analysis.
In phenotype 1, the lipid parameters, including TC, TG, LDL-C, AIP, LCI, non-HDL-C, AC, CRI-I, and CRI-II, were significantly higher than the other two phenotypes (all p < 0.05). In phenotype 2, elevated levels of sodium (Na) and chloride (Cl) ions were found, compared to phenotype 1 and 3 (all p < 0.05). Nevertheless, patients in phenotype 3 had significant inflammation levels. They had abnormally increasing white blood cell (WBC), NEU, MON, NLR, MHR, NHR, SII, SIRI, MII-1, MII-2, MII-3, CRP, and lower levels of LYM and LMR inflammatory indicators, among the three phenotypes (all p < 0.05). Besides, phenotype 3 also had mild multiple-organ dysfunction, such as abnormal synthesis, secretion, coagulation, and excretion function occurring in the liver and renal, as well as myocardial injury. The basic characteristics of phenotypes and non-AIS control groups are displayed in Supplementary Table 1.
In the external validation dataset, 507 AIS patients were also divided into three clusters by the k-means cluster algorithm (Figures 2C, D), including clusters A (n = 251), B (n = 213), and C (n = 43). We compared the differences between the three groups in terms of clinical and laboratory data. Cluster A was characterized by abnormal ions, especially Na and Cl ions, corresponding to phenotype 2. Cluster B had high levels of lipid and BMI, which was equal to phenotype 1. Cluster C had mild organ dysfunction and severe levels of inflammation, with abnormal elevated and decreased inflammatory indicators, similar to phenotype 3. Supplementary Table 2 describes the detailed results.
Clinlabomics models of phenotypesWe used LASSO regression analysis to select 24 variables for the establishment of Clinlabomics model 1 of phenotype 1, including age, hypertension (HTN), smoking, systolic blood pressure (SBP), WBC, LYM, SII, MII-2, RPR, CRP, RBC, mean corpuscular volume (MCV), RDWCV, LDL-C, CRI-II, glucose (GLU), TyG, Cl, Ca, direct bilirubin (DBIL), alkaline phosphatase (ALP), cholinesterase (CHE), AGR, and PT (Figure 4A). For constructing predictive model 2 of phenotype 2 (Figure 4B), 23 variables, namely age, marriage, CHD, AF, drinking, HR, SBP, weight, LYM, NHR, SII, MII-2, RPR, CRP, TG, LCI, GLU, carbon dioxide (CO2), magnesium (Mg), ALB, AGR, INR, and TT were identified using a LASSO method. The predictive performance of the two phenotype classifiers established by the SVM algorithm was excellent, achieving high AUC values (ranging from 0.961 to 1.00), as shown in Figure 5 and Table 3. In particular, model 2 yielded higher accuracy (0.991 and 0.952), sensitivity (0.991 and 0.958), specificity (0.992 and 0.945), PPV (0.991 and 0.951), and NPV (0.992 and 0.952) both in training and testing datasets. Additionally, we selected a relatively important ranking of the top ten variables of models (Supplementary Figure 1). Notably, the inflammatory biomarkers CRP, RPR, and MII-2 were extremely important variables that ranked in the top three, both in model 1 and model 2. Furthermore, the calibration plots of the models showed a good agreement between the predicted probability and observed probability (Figure 6). Decision curve analysis (DCA) curves of two phenotype classifiers denoted optimal clinical efficacy (Figure 7).
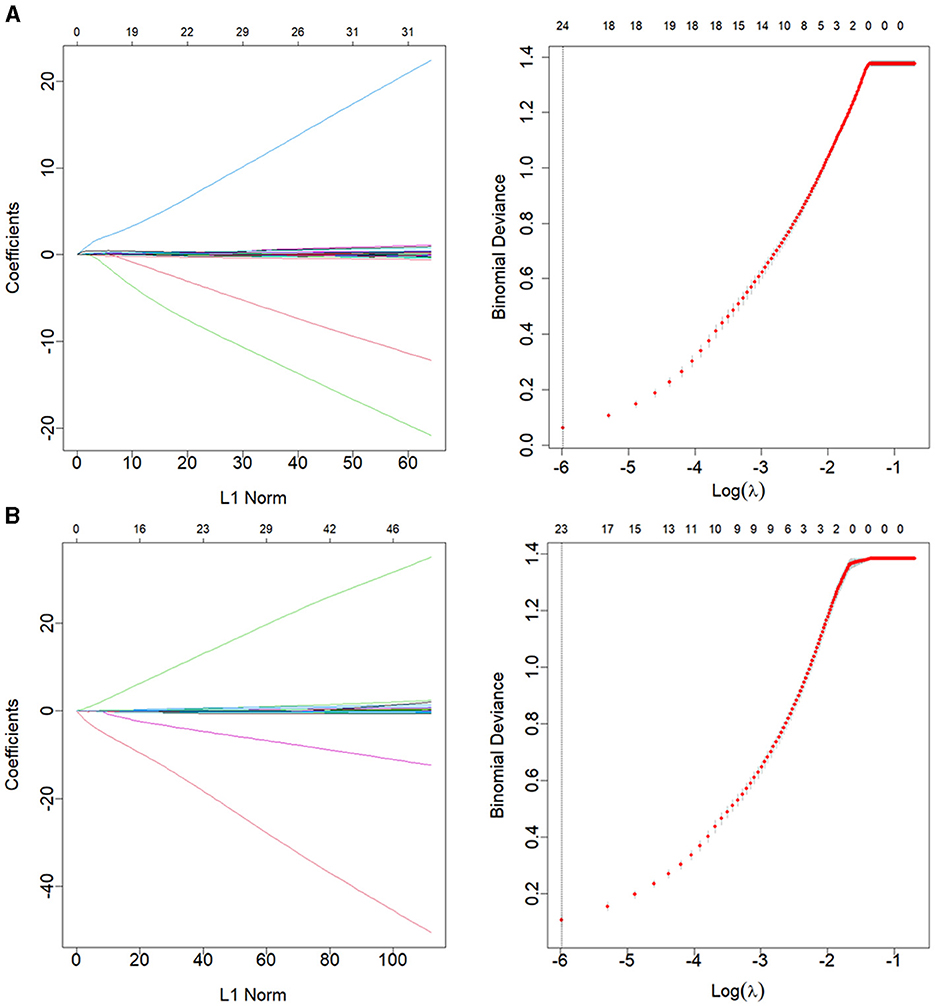
Figure 4. LASSO regression analysis for variable selection of (A) phenotype 1 and (B) phenotype 2. The LASSO coefficient profiles (left) and selection of the λ by 10-fold cross-validation in the LASSO analysis (right). LASSO, least absolute shrinkage, and selection operator.
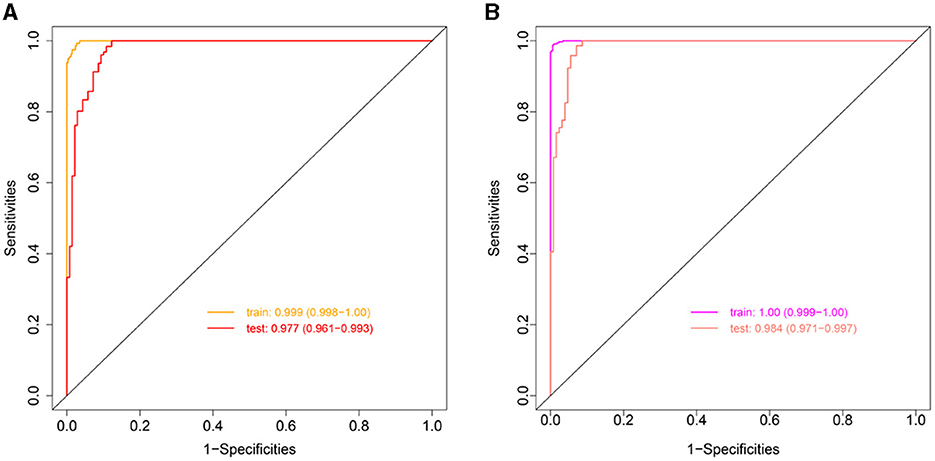
Figure 5. ROC curves of Clinlabomics (A) model 1 and (B) model 2. ROC, receiver-operating characteristic; AUC, the area under curve.
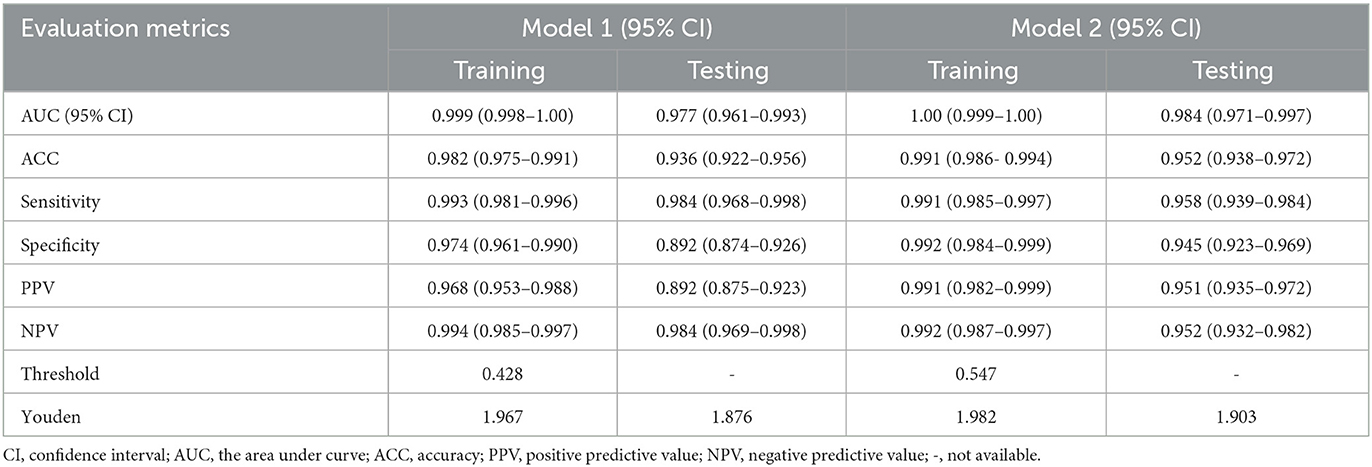
Table 3. Evaluation metrics assess the predictive performance of Clinlabomics models.
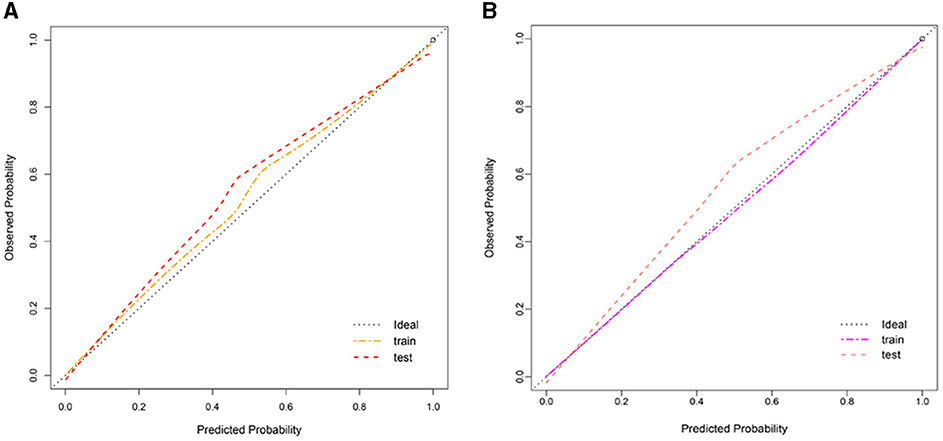
Figure 6. Calibration plot of Clinlabomics (A) model 1 and (B) model 2.
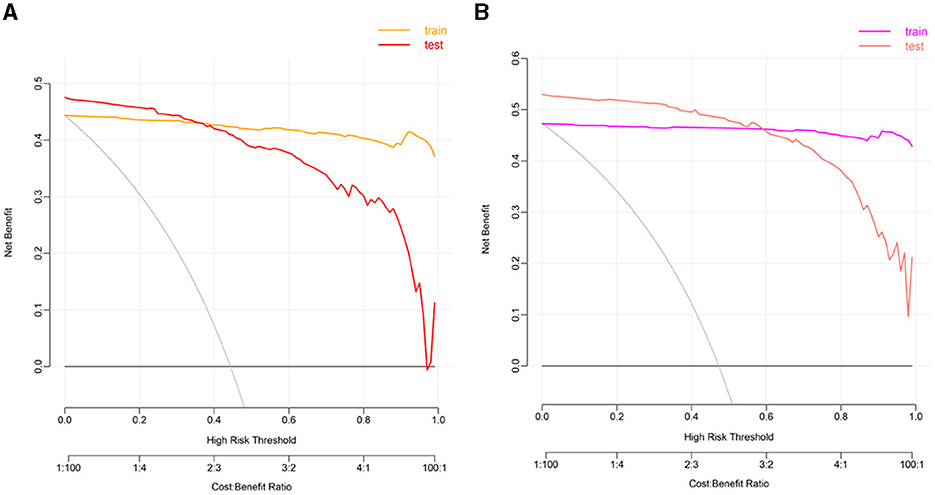
Figure 7. The DCA plots of Clinlabomics (A) model 1 and (B) model 2. DCA, decision curve analysis.
DiscussionIn this retrospective analysis of data from AIS patients, we classified them into three novel phenotypes with distinct clinical characteristics and significantly different laboratory data. This stratification of AIS patients may provide evidence of potential pathophysiology mechanisms of diseases and can help clinicians make clinical decisions about the intervention of stroke.
Of the three novel phenotypes, phenotype 3, which had only ~5% of the overall population sample size, was closely related to the older adult population and had the highest level of inflammation and mild multiple-organ dysfunction, containing abnormal liver, kidney function, and coagulative status. While phenotype 2 was characterized by a mild increase in inflammatory markers, it had the lowest lipid levels. Interestingly, the serum ions, such as potassium (K), NA, Cl, CO2, and phosphorus (P), were observed to be increased in phenotype 2. In contrast, phenotype 1 had a relatively young but high BMI population, who had significantly elevated levels of lipids.
We also compared with other phenotypes of ischemic stroke (Table 4). For instance, Chen and Chen (8) and Lattanzi et al. (10) revealed a clinical phenotype with dyslipidemia in embolic stroke of undetermined source (ESUS) and ischemic stroke with OSA, respectively. Likewise, Ding et al. (6, 7) also identified the phenotypes of abnormal inflammation and lipid metabolism of NCIS patients, which demonstrated that inflammatory and lipid alterations were closely associated with the occurrence of ischemic stroke. In our study, we found a distinct phenotype with abnormal ions for the first time, which may provide new insight into targeted treatments of AIS patients.
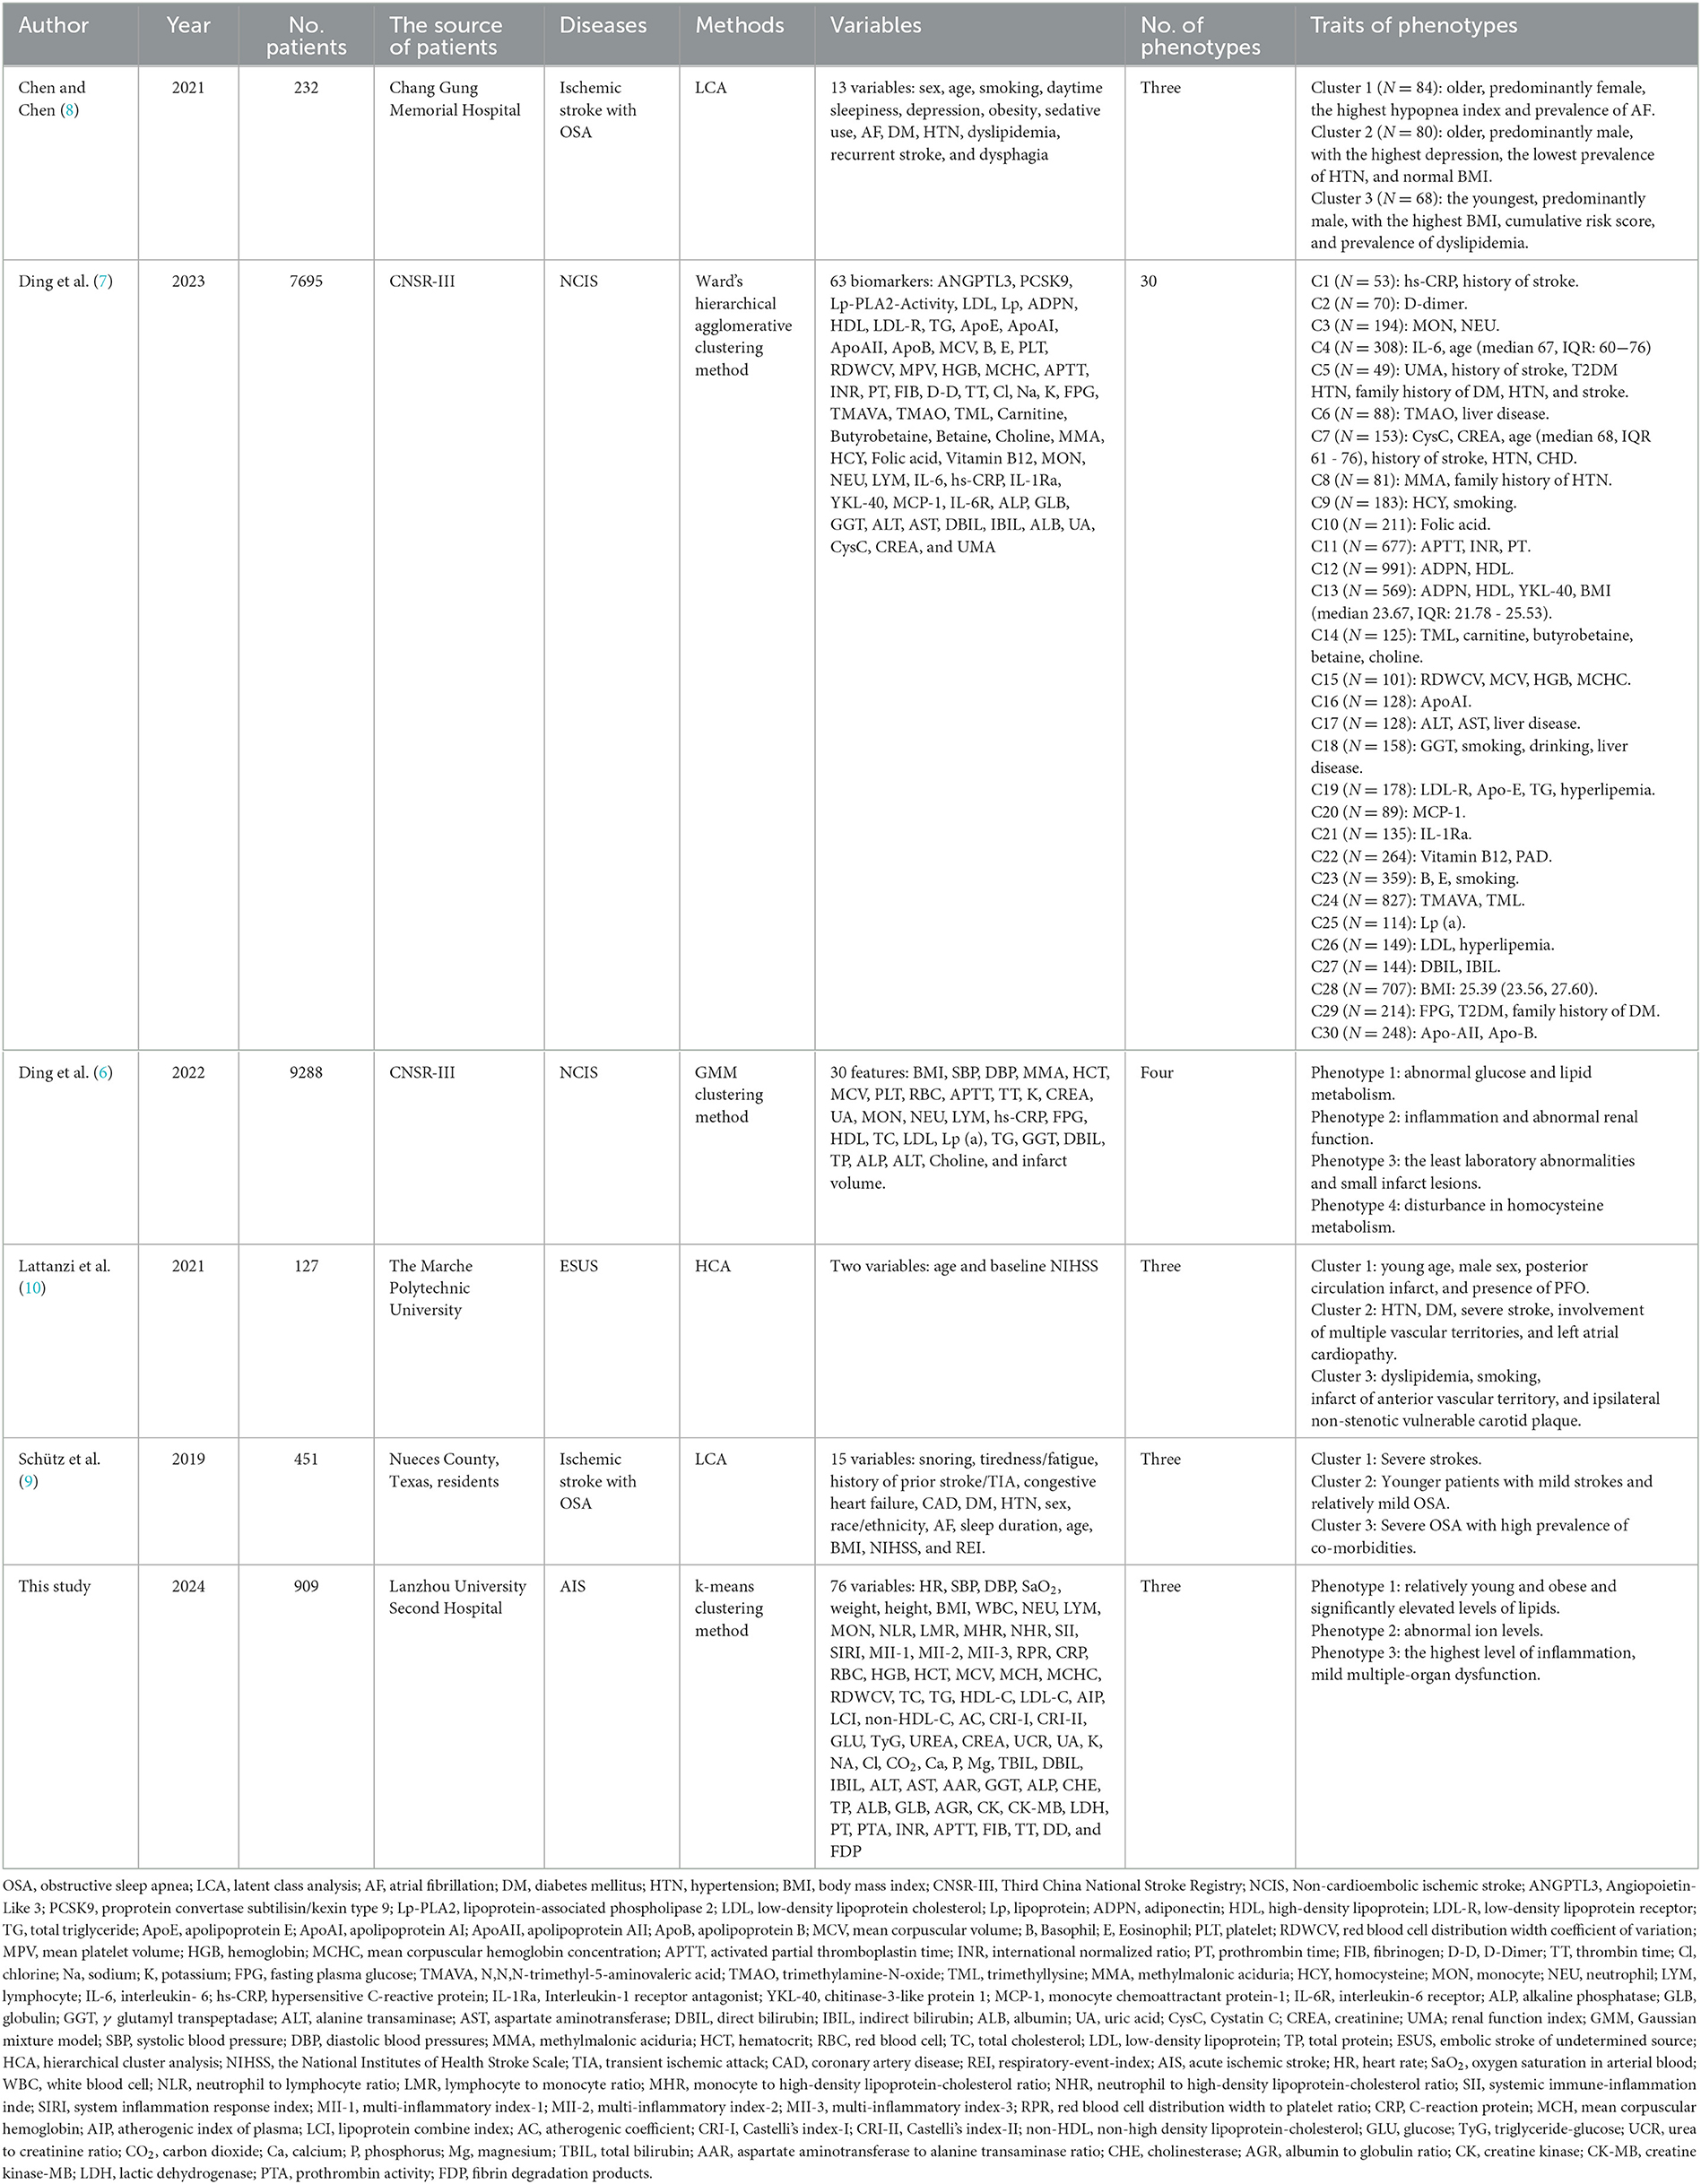
Table 4. Comparison with other phenotypes of ischemic stroke.
Recent works have shown that inflammation plays a vital role in the pathogenesis of AIS, which may increase the risk of stroke and exacerbate ischemic lesions (37–39). When ischemia occurs in the cerebrum, peripheral circulating leukocytes and their subsets, including neutrophils, monocytes, and lymphocytes, are recruited to the cerebral ischemic region. These cells produce, secrete, and activate inflammatory mediators, such as cytokines, chemokines, adhesion molecules, etc., and even interact with inflammatory cells to contribute to the progression and sustenance of inflammation (40, 41). Inflammatory responses participate in the process of thrombosis, which, in turn, can generate a thrombotic inflammatory response via the recruitment of leukocytes, leading to tissue organ damage and influencing the clinical outcome of AIS patients (42). One collaborative analysis of 31,245 patients who received statin therapy revealed that residual inflammatory risk (RIR), namely LDL-C <70 mg/dL and high-sensitivity C-reactive protein (hs-CRP) level ≥ 2 mg/L, can effectively predict cardiovascular events and death, and all-cause death (43). Similarly, RIR was strongly associated with the poor functional outcome of AIS patients and could predict the risk of recurrent stroke for AIS or TIA patients (44). Therefore, an anti-inflammatory strategy is recognized as a potential treatment to reduce the recurrence of stroke and other vascular events after the onset of IS (45, 46).
Furthermore, we found that the levels of traditional lipid parameters, including TC, TG, HDL-C, and LDL-C, and non-traditional lipid parameters, such as AIP, LCI, non-HDL-C, AC, CRI-I, and CRI-II, were significantly increased in the phenotype 1, which had 46% carotid plaque occurrence rate in all AIS population. Abnormal lipid metabolism and inflammatory responses are involved in the pathological progression of atherosclerosis, which is initiated by oxidation of LDL-C, activated by endothelium, and mediated by macrophages (47). Hyperlipidemia can recruit pro-inflammatory monocytes, which infiltrate into atherosclerotic lesions and ultimately form foam cells. They also can activate the innate immune response by triggering the production of many pro-inflammatory cytokines. Importantly, inflammation and hyperlipidemia had similar future atherothrombotic risks in the population without receiving statins (43). Thus, it is important to understand the vital roles of inflammation and lipids in the atherosclerosis process for better intervention of IS. Currently, statin therapy is recommended to reduce cardiovascular event risk among people with atherosclerosis in primary or secondary prevention, based on the randomized trials that demonstrated the efficacy of statin to decline the occurrence of cardiovascular events in patients with high levels of LDL-C (48) and hs-CRP (49). In addition, other lipid-lowering therapies, including ezetimibe, bempedoic acid, proprotein convertase subtilisin-kexin type 9 (PCSK9) inhibitors, angiopoietin-like 3 protein (ANGPTL3) inhibitors, and inclisiran were also observed to reduce cardiovascular event rates (50–52). A parallel-group trial elucidated that a target LD-L cholesterol <70 mg/dL in IS or TIA patients with atherosclerosis had lower cardiovascular risk (53).
Interestingly, both inflammation biomarkers and lipid levels were found to be the lowest in phenotype 2, but the levels of K, NA, Cl, and P ions were increased. After the onset of cerebral ischemia, endogenous Na+/K+-ATPase (NKA) inhibitors that damaged the innate NKA activity were released to the peripheral circulation (54), leading to ATP depletion, which in turn exacerbated anoxic damage (55, 56). Besides, abnormal metabolic changes occurred in extracellular and intracellular environments, namely, reductions in ATP and cytosolic K+, as well as increases in ROS produced by mitochondria and intracellular Ca2+. These changes activated the nucleotide-binding oligomerization domain (NOD)-like receptor (NLR) family pyrin domain-containing 3 (NLRP3) inflammasome and subsequent pro-caspase-1 self-cleaved into caspase-1, mediating pyroptosis and ultimately causing neuronal death (57). In addition, the decline of intracellular K+ could also stimulate the activation of NLRP3 inflammasome and trigger inflammation cascades (58). Therefore, restoring the activity of NKA may reduce inflammasome activation, relieve neuronal death, and attenuate ischemic injury (59), which may be a distinct therapeutic target for AIS.
In this study, a total of 24 and 23 variables were selected to construct Clinlabomics models of phenotype 1 and phenotype 2, respectively. The SVM generally presented a similar or superior ability to the logistic regression (LR) method in the classification of diseases (60). We tried to use the LR algorithm to construct the Clinlabomics models of phenotypes, but the results were disappointing with the fitted probabilities numerically 0 or 1. Thus, we established the phenotype classifiers using the SVM algorithm, which showed excellent predictive performance for phenotypes of AIS patients. Both in models 1 and 2, CRP, RPR, and MII-2 inflammatory biomarkers were the most important predictors. Kitagawa et al. (61) revealed that a low level of CRP (<1 mg/L) reduced 32% recurrent stroke and TIA compared to patients with CRP ≥ 1 mg/L. In addition, elevated CRP was observed to be strongly correlated to a 3-month worse outcome of stroke patients without infection (62). The RPR, as a new inflammatory index, was closely related to the risk of mortality among AIS patients (63, 64). Furthermore, an increase in RPR could also predict early neurological deterioration after intravenous thrombolysis in patients with AIS (65). It remains unclear whether any relationship exists between the MII-2 indicator and AIS patients, but a recent study elucidated that the MII-1 and MII-2 inflammatory markers were capable of predicting the occurrence of acute symptomatic seizures after IS (66). With advances in algorithms to develop prediction models by combining multiple variables, we can optimize models to identify the hidden complex relationships among variables, which may be of great utility in clinical practice.
However, we should consider limitations on the interpretation of our findings. First, this is a single-center, small sample-size study that needs further validation in a large-scale study. Second, we also need to investigate more advanced ML algorithms to better predict the phenotypes of AIS patients based on multicenter and large-scale research. Third, due to the small population (n = 45), we did not establish the predictive phenotype classifiers of phenotype 3, which is required to explore the underlying mechanism of mild organ damage and dysfunction in the future. Interestingly, although a large quantity of ML-based models exists to predict AIS, they are not effectively utilized in clinical practice, which is ascribed to the complicated data mining algorithms and abstruse formulas. Therefore, it is imperative to solve this problem to better apply these models by clinicians.
ConclusionIn conclusion, we identified three novel phenotypes that connected with different clinical variables using k-means clustering analysis. We constructed the Clinlabomics models of phenotypes in AIS patients that are conducive to clinical decision-making and personalized medicine.
Data availability statementThe raw data supporting the conclusions of this article will be made available by the authors, without undue reservation.
Ethics statementThe studies involving humans were approved by the Ethics Committee of the Lanzhou University Second Hospital (IRB number: 2022A-710). The studies were conducted in accordance with the local legislation and institutional requirements. The participants provided their written informed consent to participate in this study.
Author contributionsYJ: Data curation, Formal analysis, Methodology, Writing—original draft, Visualization, Writing—review & editing. YD: Formal analysis, Investigation, Methodology, Validation, Visualization, Writing—original draft. QW: Methodology, Validation, Visualization, Writing—review & editing. BY: Software, Supervision, Writing—review & editing. LG: Funding acquisition, Writing—review & editing. CY: Conceptualization, Writing—review & editing.
FundingThe author(s) declare that financial support was received for the research, authorship, and/or publication of this article. This study was supported by the Cuiying Scientific and Technological Innovation Program of Lanzhou University Second Hospital (CY2020-BJ05).
AcknowledgmentsThe authors would like to thank the participants of the study.
Conflict of interestThe authors declare that the research was conducted in the absence of any commercial or financial relationships that could be construed as a potential conflict of interest.
Publisher's noteAll claims expressed in this article are solely those of the authors and do not necessarily represent those of their affiliated organizations, or those of the publisher, the editors and the reviewers. Any product that may be evaluated in this article, or claim that may be made by its manufacturer, is not guaranteed or endorsed by the publisher.
Supplementary materialThe Supplementary Material for this article can be found online at: https://www.frontiersin.org/articles/10.3389/fneur.2024.1366307/full#supplementary-material
References1. GBD 2016 Stroke Collaborators. Global, regional, and national burden of stroke, 1990-2016: a systematic analysis for the Global Burden of Disease Study 2016. Lancet Neurol. (2019) 18:439–58. doi: 10.1016/S1474-4422(19)30034-1
PubMed Abstract | Crossref Full Text | Google Scholar
2. Wang YJ Li ZX, Gu HQ, Zhai Y, Jiang Y, Zhao XQ, et al. China Stroke Statistics 2019: A report from the national center for healthcare quality management in neurological diseases, china national clinical research center for neurological diseases, the Chinese stroke association, national center for chronic and non-communicable disease control and prevention, Chinese center for disease control and prevention and institute for global neuroscience and stroke collaborations. Stroke Vasc Neurol. (2020) 5:211–39. doi: 10.1136/svn-2020-000457
Crossref Full Text | Google Scholar
3. Fan J, Li X, Yu X, Liu Z, Jiang Y, Fang Y, et al. Global burden, risk factor analysis, and prediction study of ischemic stroke, 1990-2030. Neurology. (2023) 101:e137–e50. doi: 10.1212/WNL.0000000000207387
PubMed Abstract | Crossref Full Text | Google Scholar
4. Powers WJ, Rabinstein AA, Ackerson T, Adeoye OM, Bambakidis NC, Becker K, et al. Guidelines for the early management of patients with acute ischemic stroke: 2019 update to the 2018 guidelines for the early management of acute ischemic stroke: a guideline for healthcare professionals from the American heart association/American stroke association. Stroke. (2019) 50:e344–418. doi: 10.1161/STR.0000000000000211
Crossref Full Text | Google Scholar
5. Wang Y. Residual recurrence risk of ischaemic cerebrovascular events: concept, classification and implications. Stroke Vasc Neurol. (2021) 6:155–7. doi: 10.1136/svn-2021-000885
PubMed Abstract | Crossref Full Text | Google Scholar
6. Ding L, Mane R, Wu Z, Jiang Y, Meng X, Jing J, et al. Data-driven clustering approach to identify novel phenotypes using multiple biomarkers in acute ischaemic stroke: a retrospective, multicentre cohort study. EClinicalMedicine. (2022) 53:101639. doi: 10.1016/j.eclinm.2022.101639
PubMed Abstract | Crossref Full Text | Google Scholar
7. Ding L, Liu Y, Meng X, Jiang Y, Lin J, Cheng S, et al. Biomarker and genomic analyses reveal molecular signatures of non-cardioembolic ischemic stroke. Sig Trans Targ Ther. (2023) 8:222. doi: 10.1038/s41392-023-01465-w
PubMed Abstract | Crossref Full Text | Google Scholar
8. Chen CY, Chen CL. Recognizable clinical subtypes of obstructive sleep apnea after ischemic stroke: a cluster analysis. Nat Sci Sleep. (2021) 13:283–90. doi: 10.2147/NSS.S301668
PubMed Abstract | Crossref Full Text | Google Scholar
9. Schütz SG, Lisabeth LD, Shafie-Khorassani F, Case E, Sanchez BN, Chervin RD, et al. Clinical phenotypes of obstructive sleep apnea after ischemic stroke: a cluster analysis. Sleep Med. (2019) 60:178–81. doi: 10.1016/j.sleep.2019.04.004
PubMed Abstract | Crossref Full Text | Google Scholar
10. Lattanzi S, Rinaldi C, Pulcini A, Corradetti T, Angelocola S, Zedde ML, et al. Clinical phenotypes of embolic strokes of undetermined source. Neurol Sci. (2021) 42:297–300. doi: 10.1007/s10072-020-04700-2
PubMed Abstract | Crossref Full Text | Google Scholar
11. Hennig C, Meila M, Murtagh F, Rocci RE. Handbook of Cluster Analysis, 1st Edn. New York, NY: Chapman and Hall/CRC (2015).
12. Ren Z, Fu X. Stroke risk factors in United States: an analysis of the 2013-2018 national health and nutrition examination survey. Int J Gen Med. (2021) 14:6135–47. doi: 10.2147/IJGM.S327075
PubMed Abstract | Crossref Full Text | Google Scholar
13. Miller JB, Nowak RM, Reed BP, DiSomma S, Nanayakkara P, Moyer M, et al. Hemodynamic characteristics of suspected stroke in the emergency department. Am J Emerg Med. (2017) 35:1915–8. doi: 10.1016/j.ajem.2017.08.017
PubMed Abstract | Crossref Full Text | Google Scholar
14. Seymour CW, Kennedy JN, Wang S, Chang CH, Elliott CF, Xu Z, et al. Derivation, validation, and potential treatment implications of novel clinical phenotypes for sepsis. JAMA. (2019) 321:2003–17. doi: 10.1001/jama.2019.5791
PubMed Abstract | Crossref Full Text | Google Scholar
15. Guo F, Zhu X, Wu Z, Zhu L, Wu J, Zhang F. Clinical applications of machine learning in the survival prediction and classification of sepsis: coagulation and heparin usage matter. J Transl Med. (2022) 20:265. doi: 10.1186/s12967-022-03469-6
PubMed Abstract | Crossref Full Text | Google Scholar
16. Pollet M, Skrobala E, Lopes R, Kuchcinski G, Bordier C, Rollin-Sillaire A, et al. A multimodal, longitudinal study of cognitive heterogeneity in early-onset Alzheimer's disease. Eur J Neurol. (2021) 28:3990–8. doi: 10.1111/ene.15097
PubMed Abstract | Crossref Full Text | Google Scholar
17. Sri-Iesaranusorn P, Sadahiro R, Murakami S, Wada S, Shimizu K, Yoshida T, et al. Data-driven categorization of postoperative delirium symptoms using unsupervised machine learning. Front Psychiatry. (2023) 14:1205605. doi: 10.3389/fpsyt.2023.1205605
PubMed Abstract | Crossref Full Text | Google Scholar
18. Sriprasert I, Mack WJ, Hodis HN, Allayee H, Brinton RD, Karim R. Effect of ApoE4 genotype on the association between metabolic phenotype and subclinical atherosclerosis in postmenopausal women. Am J Cardiol. (2019) 124:1031–7. doi: 10.1016/j.amjcard.2019.06.022
留言 (0)