
記住我


Overweight and obesity are known to be important contributors to adverse health consequences (1, 2). At an individual level, they are associated with various physical diseases, including cardiovascular diseases (3), several types of cancers, and diabetes mellitus (4). Consequently, at the population level, having excessive body weight not only affects an individual’s physical health but could also lead to poor mental health (5), lowers one’s quality of life and reduces life expectancy (6). At the population level, overweight and obesity are a public health concern, resulting in excessive health care costs to society.
The Global Burden of Disease Study Report (7) showed that the global prevalence of overweight increased from 26.5 to 39.0% from 1980 to 2015. The global prevalence of obesity likewise rose from 7 to 12.5% from 1980 to 2015, representing an estimated increase of 50% in the global prevalence of overweight and 80% in the global prevalence of obesity, with the American and European regions having the highest prevalence. In North America, the prevalence of overweight increased from 45.3 to 64.2% from 1980 to 2015, and the prevalence of obesity increased from 12.9 to 28.3% from 1980 to 2015. While in South East Asia, Wang et al. and Chooi et al. reported the prevalence of overweight increased from 10.9 to 24.3% from 1980 to 2015, and the prevalence of obesity increased from 1.7 to 6.2% from 1980 to 2015 (8, 9).
In relation to gender and socioeconomic status, the same report (9) found that the prevalence of overweight and obesity is higher in females than in males and this gender difference remained persistent across time. Obesity is also more common among middle-aged adults, especially wealthy females in low-income countries, while obesity affects both genders among the disadvantaged groups, those who experience a higher risk of poverty, social exclusion, discrimination, and violence in high-income countries (10).
However, Asians generally have a higher percentage of body fat than Caucasians of the same gender and age, and the risk of developing type 2 diabetes and cardiovascular diseases is higher among Asians than among Caucasians with the same body mass index (BMI) score (cut-off score at 25) (11). Thus, the current global cut-off points do not provide an adequate basis for many populations in Asia in relation to understanding or giving recommendations for those in the overweight and obese category. Thus, studies have suggested different categories for Asians which are at lower cut-offs (12).
Singapore has a unique multi-ethnic composition, comprising Chinese (74.3%), Malays (13.4%), Indians (9.0%), and other ethnic groups (3.3%) (13). With evidence suggesting a different relationship between ethnic groups and body fat percentage (14, 15). The Singapore Health Promotion Board-Ministry of Health Clinical Practice Guidelines indicate significant variations in obesity prevalence among different ethnic groups within Singapore, with Malays having the highest prevalence of obesity at 20.7%, followed by Indians at 14.0%, and Chinese at 5.9% (12). Another cross-sectional study conducted in Singapore found significant ethnic variations in body fat distribution, with Indian females showing the highest body fat percentage (38.2%) and Chinese males the lowest among the groups studied (24.4%) (16). These differences in obesity rates among ethnic groups may be attributed to a combination of various factors, namely genetic, cultural, dietary, and lifestyle (17). A higher proportion of body fat, regardless of body weight or BMI, can significantly increase various health issues, including cardiovascular diseases and diabetes (18). Given the ethnic differences, it is important to examine the changes in BMI across time in each ethnic group as it could have public health implications.
The current study aims to compare the distribution of prevalence of various BMI categories using Asian BMI cut-offs between 2010 and 2016 using self-reported height and weight measurements using data from the Singapore Mental Health Study 2010 (SMHS 2010) and Singapore Mental Health Study 2016 (SMHS 2016) (19, 20) to explore the changes and the socio-demographic risk factors in the Singapore adult population.
2 Materials and methods 2.1 Respondents and proceduresBoth SMHS 2010 and SMHS 2016 were conducted using the same procedures (20, 21). Both studies were cross-sectional, population-based epidemiological studies conducted among Singaporeans and Permanent residents aged 18 years and above living in Singapore. The sample was drawn from an administrative database of all citizens and permanent residents in Singapore and updated regularly.
An invitation letter was sent to each randomly selected participant/resident, followed by a personal home visit by a trained interviewer from the designated survey company to obtain their agreement to participate in the survey. Once participants agree, a trained interviewer will conduct face-to-face interviews at participants’ preferred time and venue. The survey was available in English, Chinese, and Malay languages, and each participant was asked to select the language in which they were comfortable speaking before commencing any study procedures. Residents who were having severe physical or mental conditions, were living in institutions or hospitals, were not able to speak the above-mentioned languages, or living overseas at the point of the survey, and those who were not contactable due to incomplete or incorrect addresses, were considered ineligible cases and were excluded from the study.
Ethics approval for this study was obtained from the National Healthcare Group Domain Specific Review Board (DSRB No.: 2015/01035). Written informed consent was obtained from all participants prior to the survey, participants could also choose their preferred language (English, Mandarin, or Malay) for the consent as well as the survey. Parental consent was also obtained for minors, i.e., those aged 18–20 years. All study procedures were performed in accordance with DSRB’s ethical guidelines and regulations.
2.2 Data collection 2.2.1 Anthropometric measurementsSelf-reported height and weight were collected from respondents as part of the data collected in the sociodemographic questionnaire.
2.2.2 Sociodemographic informationData on gender (female, male), age, ethnicity (Chinese, Malay, Indian, and Others), marital status (single, married, divorced/ separated, or widowed), educational level (primary and below, secondary, vocational institute, pre-university/ junior college, diploma, and university), employment status (employed, unemployed and economically inactive) was collected.
2.2.3 Body mass indexBMI is defined as the weight in kilograms divided by the square of the height in meters (BMI = body mass/(height)2). The BMI classification scores were categorized according to World Health Organization (WHO) guidelines. Those having BMI scores of 30 and above were classified as obese, those with BMI of 25–29.9 were defined as overweight, 18.5–24.9 were considered to be in the normal range, and BMI below 18.5 was classified as underweight (WHO, 2000).
2.3 Statistical analysisAll estimates were weighted to ensure the results represented Singapore’s general population. To examine the associations between BMI categories and socio-demographic variables, chi-square (χ2) tests were used, followed by multinomial logistic regressions. A significant change in BMI categories between two surveys in sociodemographic groups was further tested in the pooled multinomial logistic regression analyses by adding interaction terms between the year of the study and each demographic variable with adjustment of sociodemographic factors. Year of survey (SMHS-2010 = 0, SMHS-2016 = 1), age groups, gender, ethnicity, marital status, education, and employment status were predictors in the regression model. Statistical significance was evaluated at the <0.05 level using two-sided tests. All statistical analyses were performed using the Statistical Analysis Software (SAS) System version 9 (SAS Institute Inc., 2011).
The non-response rates for SMHS 2010 and 2016 were 24.1 and 31.0%, respectively (20, 21).
3 ResultsTable 1 summarizes the prevalence in 2010 and 2016 according to BMI categories. Table 2 presents the changes in BMI categories between 2010 and 2016 and the association between each category and socio-demographic characteristics.
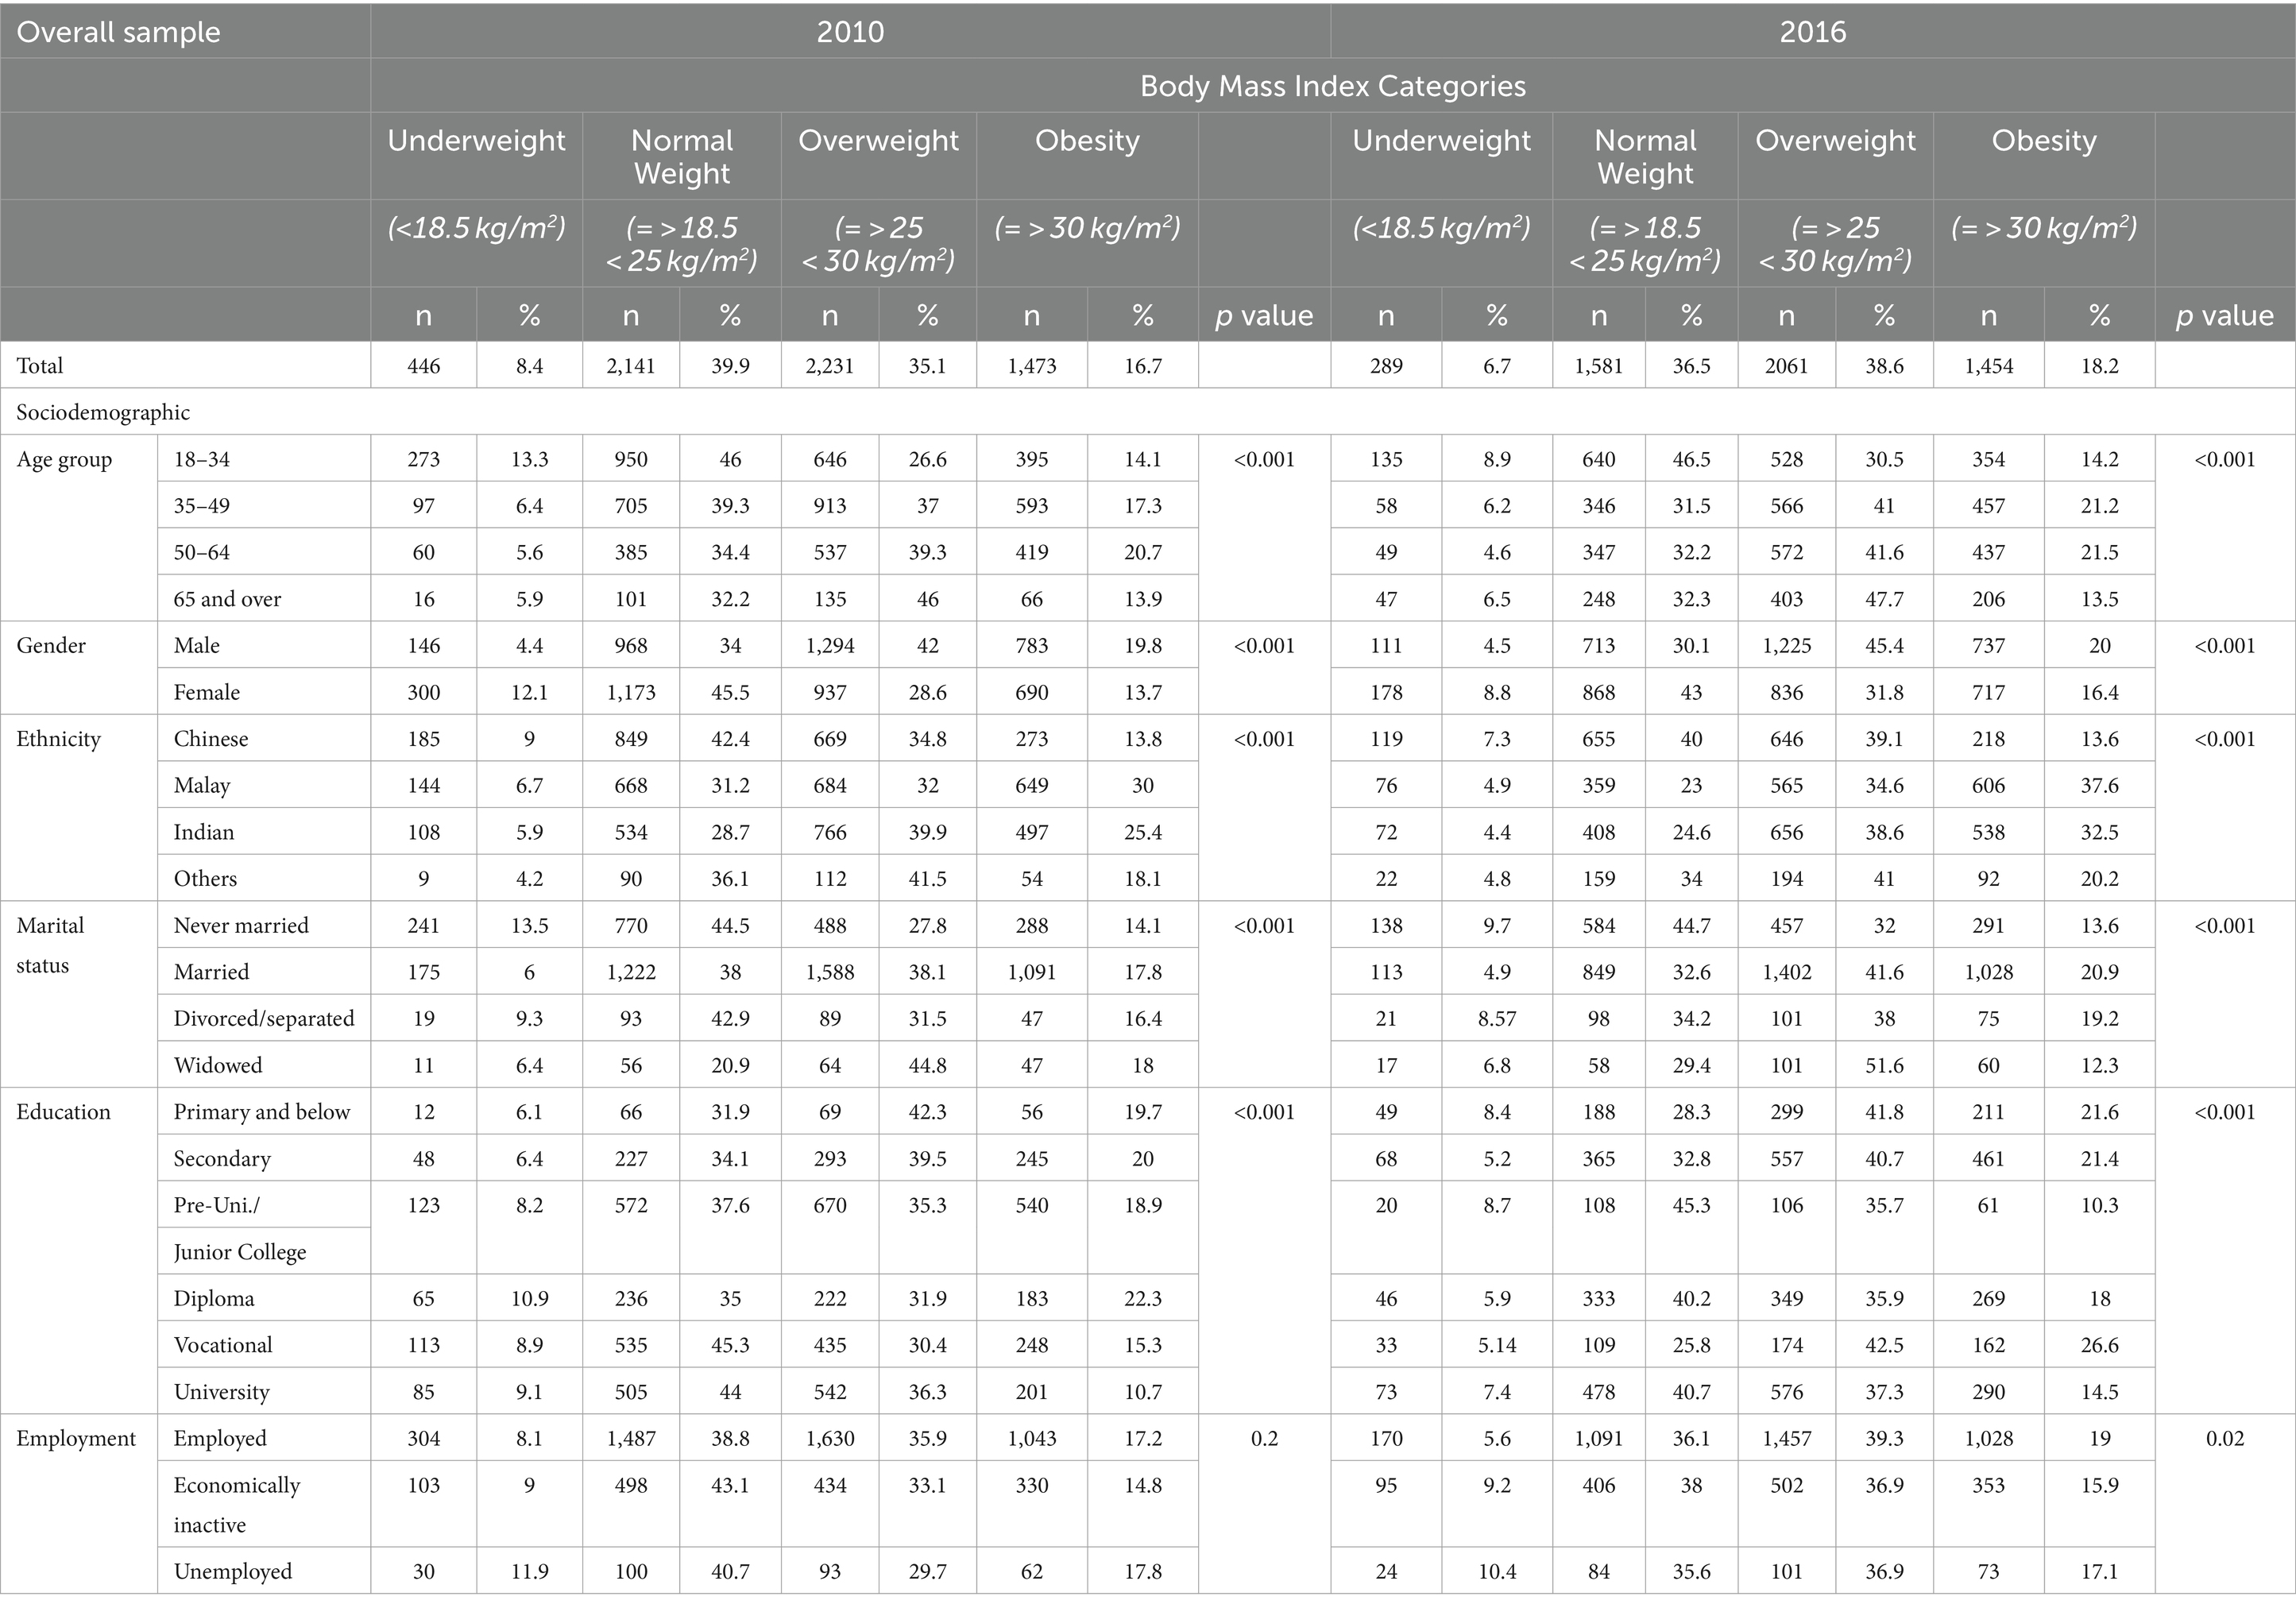
Table 1. Sociodemographic characteristics and body mass index (BMI) categories in 2010 and 2016.
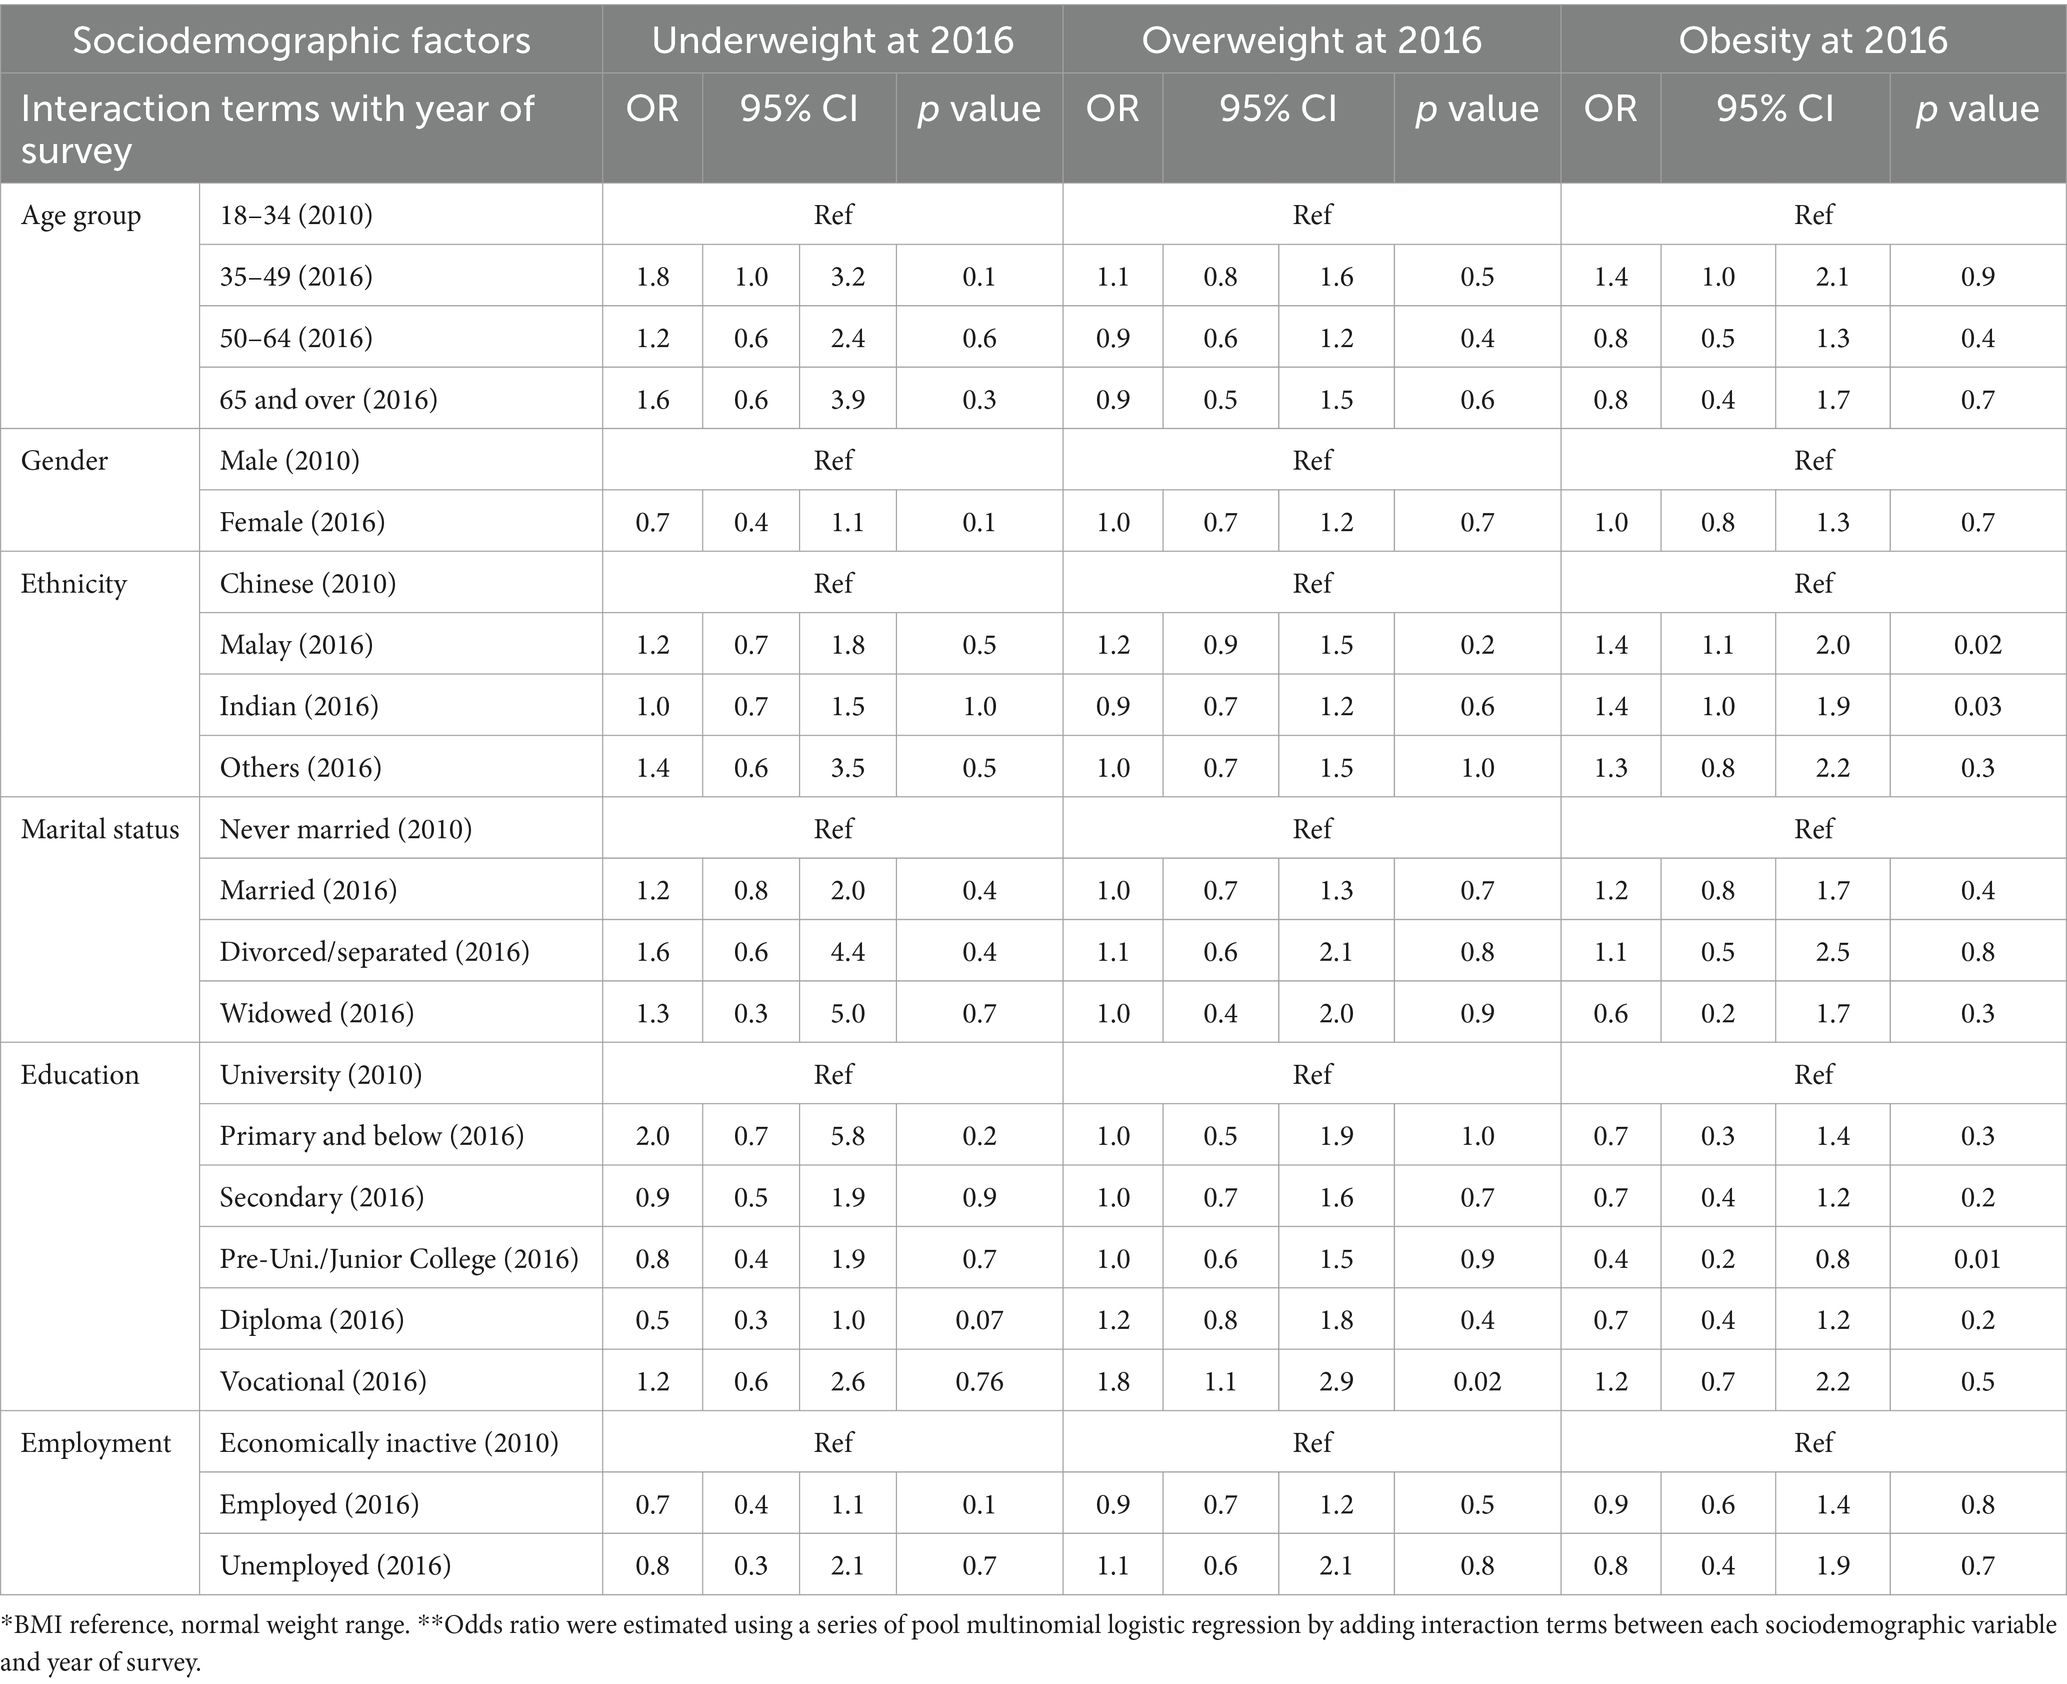
Table 2. Pooled multinomial logistic regression models for changes in BMI categories* between 2010 and 2016 periods (Interaction**).
3.1 Overall prevalenceOverall, 6.7% were underweight in 2016 vs. 8.4% in 2010, 36.5% were in the normal range in 2016 vs. 39.9% in 2010, 38.6% were overweight in 2016 vs. 35.1% in 2010, while 18.2% were obese in 2016 vs. 16.7% in 2010.
3.2 BMI and associated factors across the two surveys 3.2.1 Age groupsBMI was significantly associated with age in both 2010 and 2016 (p < 0.001; Table 1). However, no statistically significant associations were observed between BMI categories and age across the two cohorts (Table 2).
3.2.2 GenderBMI was significantly associated with gender in both 2010 and 2016 (p < 0.001; Table 1). However, no statistically significant associations were observed between BMI categories and gender across the two cohorts (Table 2).
3.2.3 EthnicityBMI was significantly associated with ethnicity in both 2010 and 2016 (p < 0.001; Table 1). Compared to Chinese ethnicity, those of Malay ethnicity were 1.4 times more likely to be in the obese category in 2016 than in 2010 (p = 0.02; OR = 1.4, 95% CI:1.1, 2.0; Table 2). In addition, those of Indian ethnicity were 1.4 times more likely to be in the obese category in 2016 than in 2010 (p = 0.03; OR = 1.4, 95% CI:1.04, 1.9; Table 2).
3.2.4 Marital statusBMI was significantly associated with marital status in both 2010 and 2016 (p < 0.001; p < 0.001; Table 1). However, no statistically significant associations were observed between BMI categories and marital status across the two cohorts.
3.2.5 Education levelBMI was significantly associated with education level in both 2010 and 2016 (p < 0.001; Table 1). As compared to respondents with a university degree, respondents with vocational education were 1.8 times more likely to be overweight in 2016 than in 2010 (p = 0.02; OR = 1.8, 95% CI:1.1, 2.9; Table 2); for those with pre-university/junior college certifications, they were 0.4 times less likely to become obese in 2016 than in 2010 (p = 0.01; OR = 0.4, 95% CI:0.2, 0.8; Table 2).
4 DiscussionOur findings showed an overall decrease in the underweight category (from 8.4% in 2010 to 6.7% in 2016) and in the normal weight category (from 39.9% in 2010 to 36.5% in 2016) and an increase in the overweight category (from 35.1% in 2010 to 38.6% in 2016) and obese category (from 16.7% in 2010 to 18.7% in 2016) in the Singapore adult population, which is consistent with the global trend that has been observed in other studies. In 2008, about 1·5 billion adults globally were overweight, and 502 million adults were obese. While the epidemic started in high income-countries later, a similar increase was seen in middle and low-income countries (mostly in high socioeconomic countries) (10). In 2014, 39% of adults were overweight. 11% of men and 15% of women worldwide were obese. In the South East Asia region, the prevalence of overweight and obese were 22 and 5%, respectively (6).
From a systemic perspective, rising socio-economic status affects the population’s lifestyle. People tend to be more sedentary due to longer working hours and are less able to devote time to vigorous physical activities, especially as jobs have become more office-based (22). Furthermore, the convenience of transportation also plays a part in encouraging sedentary behavior (10). A study conducted in China found that obesity prevalence is likely to increase among families that own auto-motor vehicles (23). In Singapore, the car population, has increased from 2010 to 2016 (24) suggests that this could be another contributing factor.
Increased calorie content of food has been used to explain the global rise in body weight and obesity (25). Overconsumption of food is promoted in the form of increased portion size and more affordable fast food that are high in energy but poor in nutrition (26). Unhealthy food is more accessible than healthy and nutritious food in the market (27). Singapore’s active night-life culture, including late-night suppers, might also be associated with the current increasing trend (28). Emerging literature suggests feeding times may have an effect on metabolism rate and hence influence the development of obesity (29, 30).
The current study found that age was significantly associated with BMI in both 2010 and 2016. With the economic growth in Singapore in the past couple of decades, people have more access to more nutrition-dense food resulting in changes in their health status (31). Many studies suggest that the direct reason being human basal metabolism decreases with age due to muscle loss and an increase in body fat (32, 33).
Gender was also found to be significantly associated with BMI in both 2010 and 2016. This finding is in line with other studies conducted on differences in body mass index and body weight perceptions between the two genders (34, 35). One explanation could be that females generally have a higher body fat composition than males (36). A locally based population study found that females, compared to males, are less likely to exercise regularly (22). Few other studies also found that young females are more sedentary than males because they enjoy socializing more, such as sitting and talking, which could be another possible explanation for current findings on the gender difference (37, 38).
Compared to Chinese ethnicity, Malay ethnicity and Indian ethnicity were found to be more likely in the obese category in 2016 than in 2010. This finding is in line with a local study where they found Malay ethnic group and Indian ethnic group have higher BMI than the Chinese ethnic group. This could be due to different dietary practices among different ethnic groups. For instance, Malays also were shown to consume more of “confectionery and sweeteners” food groups relative to Chinese and Indians (24). However, there are more recent studies have shown the contrary where Chinese ethnic groups are reported to consume more western fast food than the other two ethnic groups. Additionally, more longitudinal study findings are needed to explain why within the same ethnic group, people are more likely to be in the obese category in 2016 than in 2010. One of the possible reason could be the increase of consumption of processed food.
Compared to degree holders, diploma holders were found less likely to be underweight in 2016 than in 2010, while those with vocational education were more likely to be overweight in 2016 than in 2010. Study findings also suggested that students with pre-university/junior college qualifications are less likely to become obese in 2016 than in 2010. While the findings are consistent with existing literature on the significant association between educational levels and obesity-related behavior (39), Results did not show a significant inverse relationship between the education levels and BMI categories. Changes between the two time periods for individuals with the same educational level might be explained due to the positive effects of ongoing national programs in local schools; for example, healthy eating guidelines are provided to help students choose healthy food and beverages (12). Information regarding healthy ingredients and their suppliers are complied on an official website for school canteen vendors’ reference (40).
4.1 LimitationsData were collected through self-report from the respondents, so the measurement was subjective, the weight could be under-reported due to embarrassment, and both height and weight could be misreported due to inaccurate recollection. However, the mean differences between self-reported and measured anthropometric values were insignificant in this population (39). Thus, the use of self-reported anthropometric values should not affect the validity of the conclusions drawn in this study. Data did not include those below 18 years of age, which may be an important group to explore.
To mitigate these limitations in future studies, strategies should be implemented to minimize reporting bias. This can be done by stressing the importance of objective measures of weight and height, and interviewers presenting themselves professionally which may reduce the embarrassment felt by participants who are in the overweight or obese BMI categories. Future studies could consider longitudinal design which can track changes over time, in the same cohort which can help avoid some of the confounders. Further research is needed to identify which indicators or combination of indicators would provide the best estimation of excess body fat in population surveys (41).
5 ConclusionObesity has become a serious public health concern globally and locally, resulting in multiple chronic diseases affecting an individual’s quality of life. Hence, the increasing prevalence of obesity in Singapore is burdening the healthcare system, costing the nation approximately 260 million per year on disease-related treatments and comorbidities (42). In 2016, obesity-related expenditure rose to at least 400 million (12). To alleviate the burden, several agencies have ramped up their efforts and rolled out ongoing national campaigns to promote an active lifestyle among the local residents (43, 44). However, more needs to be done, such that agencies should develop programs that are culturally sensitive for each ethnic as well as educational group.
Data availability statementThe original contributions presented in the study are included in the article/supplementary material, further inquiries can be directed to the corresponding author.
Ethics statementThe studies involving humans were approved by the National Healthcare Group Domain Specific Review Board (DSRB No.: 2015/01035). The studies were conducted in accordance with the local legislation and institutional requirements. The participants provided their written informed consent to participate in this study.
Author contributionsYZ: Conceptualization, Investigation, Methodology, Writing – original draft, Writing – review & editing. EA: Data Curation, Formal Analysis, Writing – review & editing. RS: Writing – review & editing. SS: Writing – review & editing. KR: Writing – review & editing. JV: Funding Acquisition, Writing – review & editing. SC: Funding Acquisition, Writing – review & editing. MS: Conceptualization, Funding Acquisition, Supervision, Writing – review & editing.
FundingThe author(s) declare financial support was received for the research, authorship, and/or publication of this article. The study was supported by funding from the Ministry of Health, Singapore and Temasek Foundation.
Conflict of interestThe authors declare that the research was conducted in the absence of any commercial or financial relationships that could be construed as a potential conflict of interest.
Publisher’s noteAll claims expressed in this article are solely those of the authors and do not necessarily represent those of their affiliated organizations, or those of the publisher, the editors and the reviewers. Any product that may be evaluated in this article, or claim that may be made by its manufacturer, is not guaranteed or endorsed by the publisher.
References1. Collaboration PS. Body-mass index and cause-specific mortality in 900 000 adults: collaborative analyses of 57 prospective studies. Lancet. (2009) 373:1083–96. doi: 10.1016/S0140-6736(09)60318-4
PubMed Abstract | Crossref Full Text | Google Scholar
2. Ezzati, M, Lopez, AD, Rodgers, A, Vander Hoorn, S, and Murray, CJL. Comparative risk assessment collaborating group. Selected major risk factors and global and regional burden of disease. Lancet Lond Engl. (2002) 360:1347–60. doi: 10.1016/S0140-6736(02)11403-6
Crossref Full Text | Google Scholar
3. Czernichow, S, Kengne, AP, Stamatakis, E, Hamer, M, and Batty, GD. Body mass index, waist circumference and waist-hip ratio: which is the better discriminator of cardiovascular disease mortality risk?: evidence from an individual-participant meta-analysis of 82 864 participants from nine cohort studies. Obes Rev Off J Int Assoc Study Obes. (2011) 12:680–7. doi: 10.1111/j.1467-789X.2011.00879.x
PubMed Abstract | Crossref Full Text | Google Scholar
4. Singh, GM, Danaei, G, Farzadfar, F, Stevens, GA, Woodward, M, Wormser, D, et al. The age-specific quantitative effects of metabolic risk factors on cardiovascular diseases and diabetes: a pooled analysis. PLoS One. (2013) 8:e65174. doi: 10.1371/journal.pone.0065174
PubMed Abstract | Crossref Full Text | Google Scholar
5. Anstey, KJ, Cherbuin, N, Budge, M, and Young, J. Body mass index in midlife and late-life as a risk factor for dementia: a meta-analysis of prospective studies. Obes Rev Off J Int Assoc Study Obes. (2011) 12:e426–37. doi: 10.1111/j.1467-789X.2010.00825.x
Crossref Full Text | Google Scholar
7. Chooi, YC, Ding, C, and Magkos, F. The epidemiology of obesity. Metabolism. (2019) 92:6–10. doi: 10.1016/j.metabol.2018.09.005
Crossref Full Text | Google Scholar
8. Wang, H, Wang, J, Liu, MM, Wang, D, Liu, YQ, Zhao, Y, et al. Epidemiology of general obesity, abdominal obesity and related risk factors in urban adults from 33 communities of Northeast China: the CHPSNE study. BMC Public Health. (2012) 12:967. doi: 10.1186/1471-2458-12-967
PubMed Abstract | Crossref Full Text | Google Scholar
9. Chooi, YC, Ding, C, Chan, Z, Choo, J, Sadananthan, SA, Michael, N, et al. Moderate weight loss improves body composition and metabolic function in metabolically unhealthy Lean subjects. Obesity. (2018) 26:1000–7. doi: 10.1002/oby.22185
PubMed Abstract | Crossref Full Text | Google Scholar
10. Swinburn, BA, Sacks, G, Hall, KD, McPherson, K, Finegood, DT, Moodie, ML, et al. The global obesity pandemic: shaped by global drivers and local environments. Lancet Lond Engl. (2011) 378:804–14. doi: 10.1016/S0140-6736(11)60813-1
PubMed Abstract | Crossref Full Text | Google Scholar
13. Deurenberg, P, and Deurenberg-Yap, M. Validation of skinfold thickness and hand-held impedance measurements for estimation of body fat percentage among Singaporean Chinese, Malay and Indian subjects. Asia Pac J Clin Nutr. (2002) 11:1–7. doi: 10.1046/j.1440-6047.2002.00258.x
PubMed Abstract | Crossref Full Text | Google Scholar
14. Wang, J, Thornton, J, Russell, M, Burastero, S, Heymsfield, S, and Pierson, R. Asians have lower body mass index (BMI) but higher percent body fat than do whites: comparisons of anthropometric measurements. Am J Clin Nutr. (1994) 60:23–8. doi: 10.1093/ajcn/60.1.23
PubMed Abstract | Crossref Full Text | Google Scholar
15. Gurrici, S, Hartriyanti, Y, Hautvast, J, and Deurenberg, P. Relationship between body fat and body mass index: differences between Indonesians and Dutch Caucasians. Eur J Clin Nutr. (1998) 52:779–83. doi: 10.1038/sj.ejcn.1600637
PubMed Abstract | Crossref Full Text | Google Scholar
16. Deurenberg-Yap M. Body Composition and Diet of Chinese, Malays and Indians in singapore: And their influnce on cardiovascular risk factors. Wageningen University and Research. (1998).
17. Shuger, SL, Barry, VW, Sui, X, McClain, A, Hand, GA, Wilcox, S, et al. Electronic feedback in a diet- and physical activity-based lifestyle intervention for weight loss: a randomized controlled trial. Int J Behav Nutr Phys Act. (2011) 8:41. doi: 10.1186/1479-5868-8-41
PubMed Abstract | Crossref Full Text | Google Scholar
18. Powell-Wiley, TM, Poirier, P, Burke, LE, Després, JP, Gordon-Larsen, P, Lavie, CJ, et al.Obesity and cardiovascular disease: a scientific statement from the American Heart Association. Circulation. (2021) May 25; 143:e984–1010.
19. Chong, SA, Abdin, E, Vaingankar, JA, Heng, D, Sherbourne, C, Yap, M, et al. A population-based survey of mental disorders in Singapore. Ann Acad Med Singap. (2012) 41:49–66. doi: 10.47102/annals-acadmedsg.V41N2p49
Crossref Full Text | Google Scholar
20. Subramaniam, M, Abdin, E, Vaingankar, JA, Shafie, S, Chua, BY, Sambasivam, R, et al. Tracking the mental health of a nation: prevalence and correlates of mental disorders in the second Singapore mental health study. Epidemiol Psychiatr Sci. (2019) 29:1–10. doi: 10.1017/S2045796019000179
Crossref Full Text | Google Scholar
21. Subramaniam, M, Vaingankar, J, Heng, D, Kwok, KW, Lim, YW, Yap, M, et al. The Singapore mental health study: an overview of the methodology. Int J Methods Psychiatr Res. (2012) 21:149–57. doi: 10.1002/mpr.1351
PubMed Abstract | Crossref Full Text | Google Scholar
22. Win, AM, Yen, LW, Tan, KHX, Lim, RBT, Chia, KS, and Mueller-Riemenschneider, F. Patterns of physical activity and sedentary behavior in a representative sample of a multi-ethnic south-east Asian population: a cross-sectional study. BMC Public Health. (2015) 15:318. doi: 10.1186/s12889-015-1668-7
PubMed Abstract | Crossref Full Text | Google Scholar
23. Bell, AC, Ge, K, and Popkin, BM. The road to obesity or the path to prevention: motorized transportation and obesity in China. Obes Res. (2002) 10:277–83. doi: 10.1038/oby.2002.38
Crossref Full Text | Google Scholar
25. Rodgers, A, Woodward, A, Swinburn, B, and Dietz, WH. Prevalence trends tell US what did not precipitate the US obesity epidemic. Lancet Public Health. (2018) 3:e162–3. doi: 10.1016/S2468-2667(18)30021-5
Crossref Full Text | Google Scholar
26. Young, LR, and Nestle, M. Expanding portion sizes in the US marketplace: implications for nutrition counseling. J Am Diet Assoc. (2003) 103:231–40. doi: 10.1053/jada.2003.50027
PubMed Abstract | Crossref Full Text | Google Scholar
27. Bray, GA, Nielsen, SJ, and Popkin, BM. Consumption of high-fructose corn syrup in beverages may play a role in the epidemic of obesity. Am J Clin Nutr. (2004) 79:537–43. doi: 10.1093/ajcn/79.4.537
PubMed Abstract | Crossref Full Text | Google Scholar
29. Wang, W, Wu, Z, Dai, Z, Yang, Y, Wang, J, and Wu, G. Glycine metabolism in animals and humans: implications for nutrition and health. Amino Acids. (2013) 45:463–77. doi: 10.1007/s00726-013-1493-1
PubMed Abstract | Crossref Full Text | Google Scholar
31. Freedman, DS, Khan, LK, Dietz, WH, Srinivasan, SR, and Berenson, GS. Relationship of childhood obesity to coronary heart disease risk factors in adulthood: the Bogalusa heart study. Pediatrics. (2001) 108:712–8. doi: 10.1542/peds.108.3.712
PubMed Abstract | Crossref Full Text | Google Scholar
32. Shimokata, H, and Kuzuya, F. Aging, basal metabolic rate, and nutrition. Nihon Ronen Igakkai Zasshi Jpn J Geriatr. (1993) 30:572–6. doi: 10.3143/geriatrics.30.572
Crossref Full Text | Google Scholar
33. Rezuş, E, Burlui, A, Cardoneanu, A, Rezuş, C, Codreanu, C, Pârvu, M, et al. Inactivity and skeletal muscle metabolism: a vicious cycle in old age. Int J Mol Sci. (2020) 21:592. doi: 10.3390/ijms21020592
PubMed Abstract | Crossref Full Text | Google Scholar
34. Veggi, AB, Lopes, CS, Faerstein, E, and Sichieri, R. Body mass index, body weight perception and common mental disorders among university employees in Rio de Janeiro. Rev Bras Psiquiatr São Paulo Braz 1999. (2004) 26:242–7. doi: 10.1590/s1516-44462004000400007
Crossref Full Text | Google Scholar
35. Yan, AF, Zhang, G, Wang, MQ, Stoesen, CA, and Harris, BM. Weight perception and weight control practice in a multiethnic sample of US adolescents. South Med J. (2009) 102:354–60. doi: 10.1097/SMJ.0b013e318198720b
Crossref Full Text | Google Scholar
36. Deurenberg-Yap, M, Schmidt, G, van Staveren, WA, and Deurenberg, P. The paradox of low body mass index and high body fat percentage among Chinese, Malays and Indians in Singapore. Int J Obes Relat Metab Disord J Int Assoc Study Obes. (2000) 24:1011–7. doi: 10.1038/sj.ijo.0801353
PubMed Abstract | Crossref Full Text | Google Scholar
37. Marshall, SJ, Biddle, SJH, Sallis, JF, McKenzie, TL, and Conway, TL. Clustering of sedentary Behaviors and physical activity among youth: a cross-National Study. Pediatr Exerc Sci. (2002) 14:401–17. doi: 10.1123/pes.14.4.401
Crossref Full Text | Google Scholar
38. Rousea, PC, and Biddle, SJ. An ecological momentary assessment of the physical activity and sedentary behaviour patterns of university students. Health Education Journal. (2010) Mar; 69:116–25.
39. Ball, K, and Crawford, D. Socioeconomic status and weight change in adults: a review. Soc Sci Med. (2005) 60:1987–2010. doi: 10.1016/j.socscimed.2004.08.056
Crossref Full Text | Google Scholar
41. Peeters, A, Tanamas, S, Gearon, E, Al-Gindan, Y, and Lean, MEJ. Beyond BMI: how to capture influences from body composition in health surveys. Curr Nutr Rep. (2016) 5:286–94. doi: 10.1007/s13668-016-0183-5
Crossref Full Text | Google Scholar
42. Khoo, J, Eng, SK, and Foo, CS. Recommendations for obesity management from Singapore. J ASEAN Fed Endocr Soc. (2011) 26:110–6. doi: 10.15605/jafes.026.02.05
留言 (0)