The relative rarity and biological heterogeneity of soft tissue sarcoma (STS), especially in retroperitoneal sarcoma (RPS) (1), contributes to the potential diversity and complexity of the disease, thereby limiting the development of robust histiotype-specific or site-specific evidence to guide clinical management. However, the increasing recognition of RPS over the past few decades has led to standard classification, grading and staging systems (2).
The most commonly used grading system is the (Fédération Nationale des Centres de Lutte Contre le Cancer) FNCLCC grading system for STS, and the most commonly used nomograms are derived from Sarculator, Memorial Sloan-Kettering Cancer Center (MSKCC) (3), and Gronchi A (4). However, all of these nomograms are not specific for retroperitoneal liposarcoma (RPLS), as only 13% of patients in the development and validation cohorts of the MSKCC database were RPLS patients (5, 6), whereas primary extremity sarcomas in Sarculator (7) and RPS in Gronchi A (4). Notably, STS with different pathologic types and anatomic sites exhibit an extremely high degree of tumour heterogeneity and biological behavior (8). Furthermore, most of these models have not been included in the TNM staging system, and the external validation power of these models is limited (9, 10). Therefore, histology-type-specific clinical staging and nomograms are needed to stratify patients with STS, especially for RPLS.
At the same time, the latest 8th edition of the AJCC STS staging system recognizes the importance of the anatomic location of the sarcoma and establishes a site-specific staging system that distinguishes RPS from other sarcomas (11), based primarily on tumour size without any clinical experience or published evidence, but completely ignoring the important predictive information tumour invasion of adjacent organs (12), tumour multifocality (13), and histologic subtype (14). A recent evaluation of the performance of the 8th edition of the AJCC staging system for RPS using a large national database showed that its overall prognostic performance remains unsatisfactory (12). Therefore, the ability of the new staging system to risk stratify specific types (e.g., liposarcoma) among RPS needs to be investigated.
The aim of this study was to compare the clinical presentation of AJCC 7th TNM staging system and AJCC 8th TNM staging system in RPLS using data extracted from the SEER database in conjunction with the Fudan University database. Meanwhile, we aimed to propose a revised T staging algorithm based on our clinical experience and also to construct a novel nomogram incorporating several indispensable clinical factors for personalized risk assessment in RPLS.
MethodsRetrospective patient cohortPatients undergoing radical resection for RPLS were identified retrospectively from the SEER and Fudan databases. This is a population-based study of subjects from a publicly available de-identified patient database that does not require institutional review board approval. This study was reviewed and approved by the Institutional Review Board (ID: B2022-586R) of Zhongshan Hospital, Shanghai, China. All studies were guided by the principles of the Declaration of Helsinki.
Variables downloaded from the SEER database (www.seer.cancer.gov) included age, sex, year of diagnosis, tumour site, tumour diameter, lymph node metastasis, distant metastasis, histological subtype of sarcoma, histological grade, survival information, and follow-up data.
For the sarcoma centre at the ZSFD, a dynamically updated big data database has been developed includes daily electronic medical record data. Sarcoma patients treated at the ZSFD since September 2009 were included in the database. Each patient’s data were collected from 10 electronic health record systems, including the outpatient work system, pathology system, electronic medical record, the follow-up system, laboratory information system, electrocardiogram system, anaesthesia information management system, hospital information system, physical examination information system, tumour tissue biobank.
Inclusion criteria included the following: (1) RPLS on pathologic examination; (2) complete TNM staging information (Supplementary Table 1); (3) complete clinical information; (4) no history of other malignant tumours; (5) effective postoperative follow-up information.
Clinical end point and follow-upThe endpoint of the current study was OS, defined as the time from surgery to death from any cause (15). OS was prospectively collected from the sarcoma centre database. Patients were followed up over time through medical records and telephone calls. Follow-up time was defined as the interval between the date of surgery and the time of the last follow-up or death.
Follow-up consisted of a physical examination, laboratory tests, and at least one radiological imaging test [abdominal computed tomography (CT) and/or magnetic resonance imaging (MRI)] every 3 months for the first 2 years after surgery, then every 6 months, and once a year after 5 years, depending on the specific pathological subtype. PET-CT was not routinely performed. Patients were also contacted by telephone if necessary.
nTNM staging systemPatients were restaged based on pathological tumour size, nodal status and metastatic spread to distant sites according to the 7th (16) and 8th edition staging systems (11). The nTNM system incorporated a modified T-stage (21cm, the median value from tumour diameter in the ZSFD database) into the 7th and 8th editions, respectively, and patients were also restaged according to sub-stage re-grouping based on prognostic performance on surveillance.
Statistical analysisContinuous variables were expressed as mean with standard deviation (SD). Categorical variables were expressed as frequencies and percentages. Fisher’s exact test and chi-squared test were used for categorical data. All tests were 2-tailed.
Kaplan-Meier curves were plotted to estimate median OS. Cox proportional hazards regression models were applied to identify OS-related prognostic factors The assumptions of the Cox model were tested by partial residual analysis.
The accuracy of the 7th TNM and 8th TNM staging systems in predicting postoperative OS was compared using concordance index, ROC and AUC.
The nomogram predicting postoperative OS was generated from the results of Cox regression analysis. The corresponding calibration curves were used to compare the predicted probabilities of the nomograms with the agreement between the observations.
This study was conducted using statistical software including SPSS (version 26.0), R software (version 4.0.3), and GraphPad Prism (version 8.0), and a two-sided p-value of less than 0.05 was considered statistically significant. All methods followed relevant guidelines and regulations.
ResultsBaseline characteristicsA total of 497 consecutive RPLS were retrospectively included in the follow-up analysis, with 277 patients from the SEER database and 220 patients from the ZSFD database (Supplementary Figure 1). Baseline and tumour characteristics are demonstrated in Table 1. 282 (56.7%) were male and the median age at diagnosis was 48 years (range, 19-85 years). The median tumour size was 21 cm (IQR, 15-30 cm). Of note, only 1% of patients had lymph node metastases in the overall cohort and 1.8% had distant metastases.
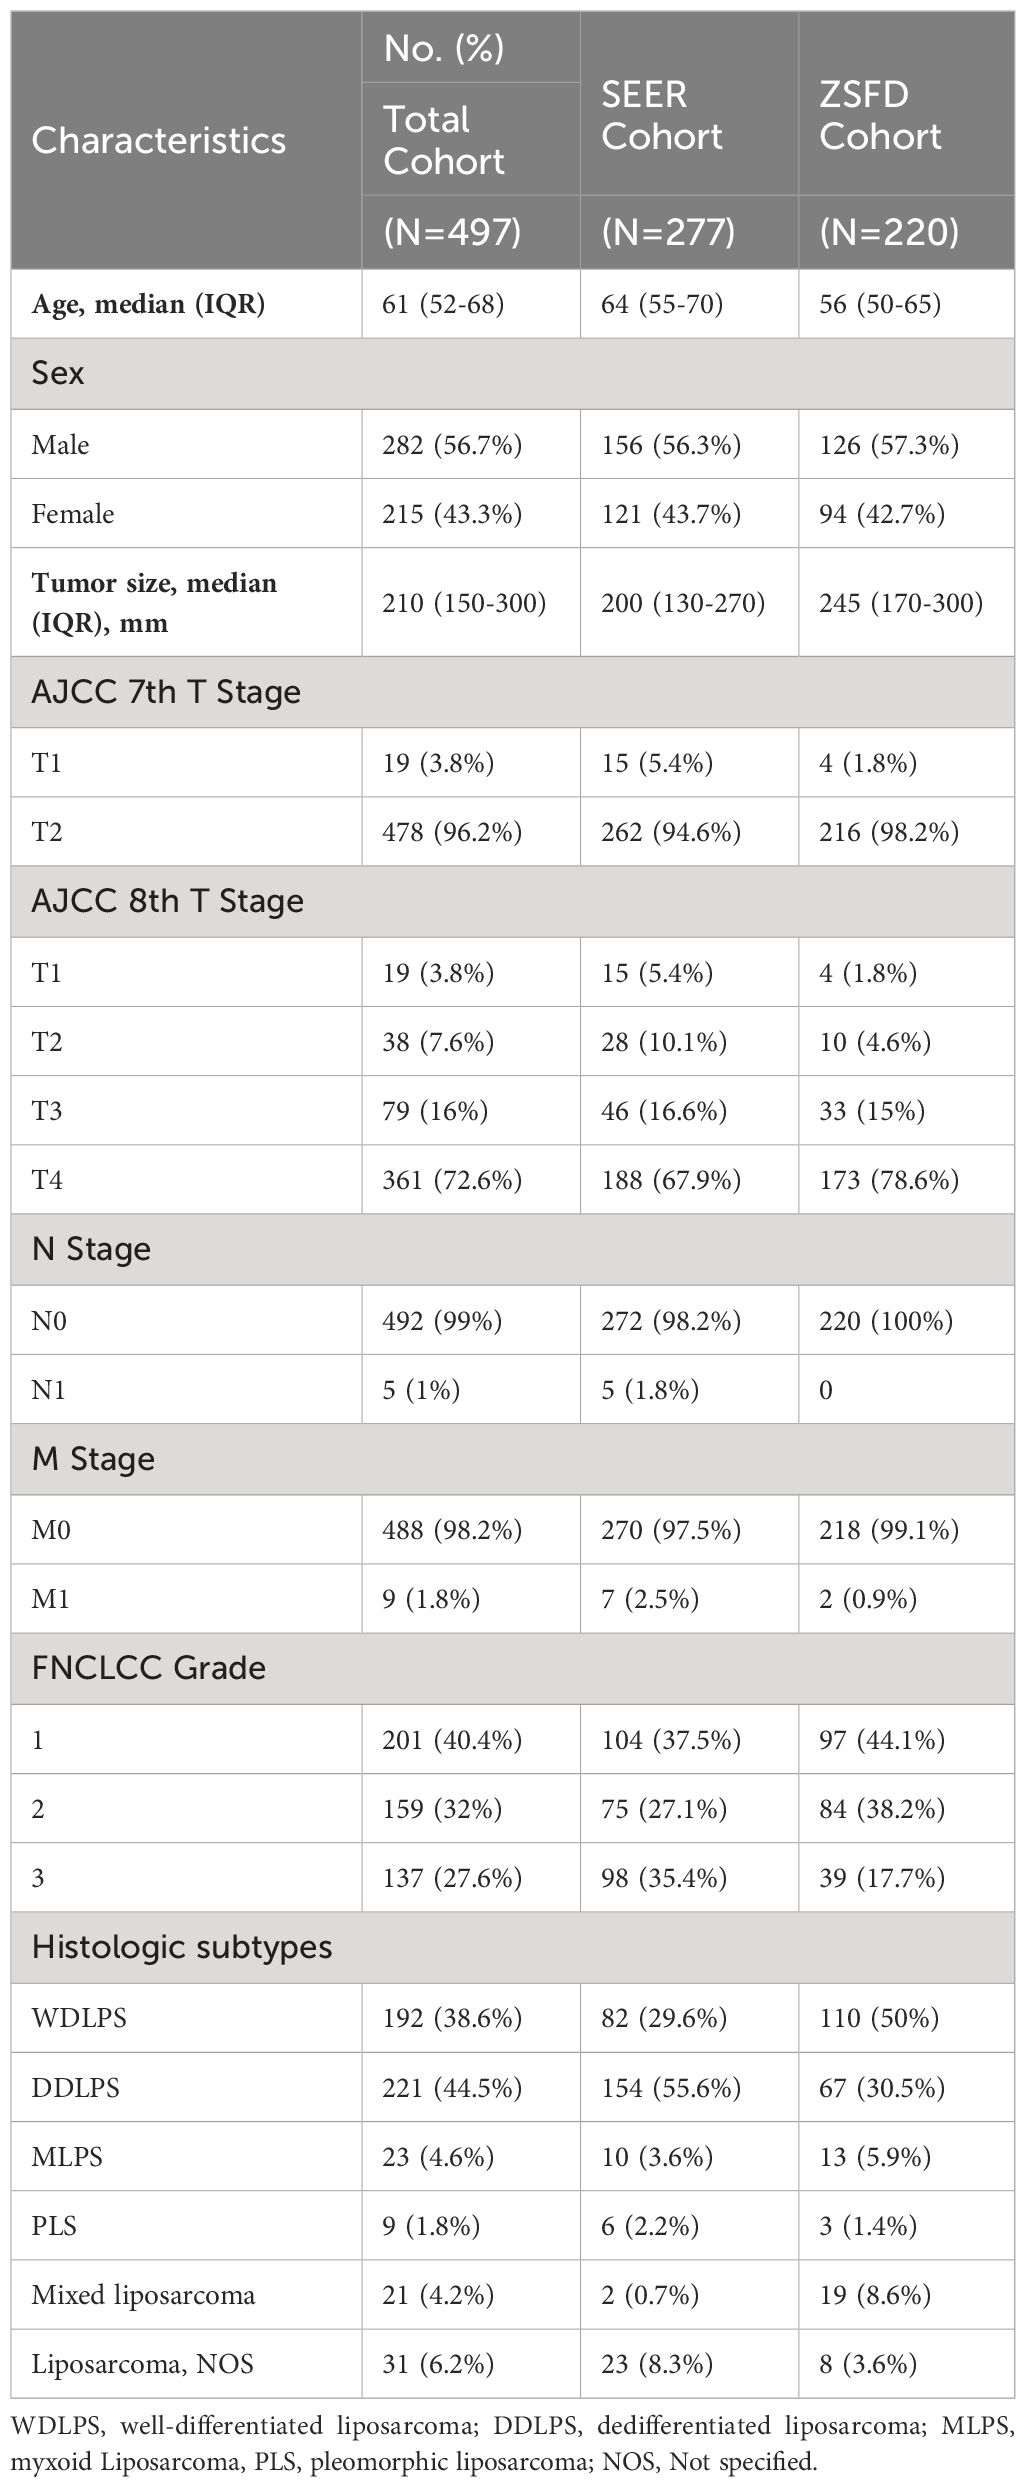
Table 1 Baseline characteristics of SEER and ZSFD cohorts.
Due to the time span of the study, 7th or even 6th edition of AJCC TNM staging was applied before 2017 and 8th edition after 2017, in order to effectively evaluate the usability of 7th and 8th edition, therefore all patients were restaged to obtain their respective 7th and 8th edition staging. As shown in Table 2, when the 7th edition of the TNM staging system was applied, the numbers of patients with stage IA, IB, IIA, IIB, III, and IV were 6 (1.2%), 189 (38%), 12 (2.4%), 150 (30.1%) 131 (26.3%) and 9 (1.8%), respectively. This distribution changed after the application of the 8th edition of the classification: 6 patients (1.2%) were in stage IA, 189 patients (38%) were in stage IB, 12 patients (2.4%) were in stage II, 24 patients (4.8%) were in stage IIIA, 257 patients (51.7%) were in stage IIIB, and 9 patients (1.8%) were in stage IV. Using the 8th edition classification, 293 patients (58.9%) were reclassified to another stage.
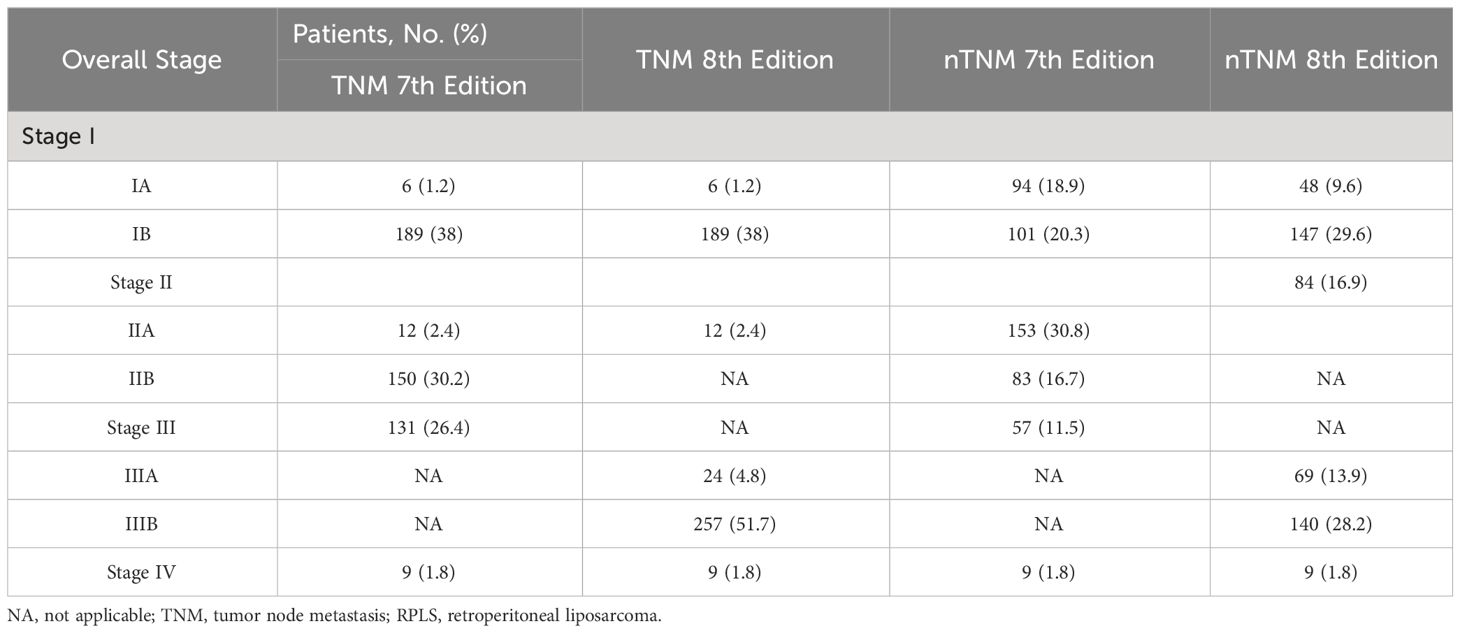
Table 2 Staging reclassification by the 7th and 8th Edition of the TNM and nTNM staging system for RPLS.
Due to the time span of the study, 7th or even 6th edition of AJCC TNM staging was used before 2017 and 8th edition after 2017, in order to effectively evaluate the performance of 7th and 8th edition, therefore all patients were restaged to obtain their respective 7th and 8th edition staging.
Regarding other pathological variables, a total of 201 patients had a G1 tumour (40.4%), 159 patients had a G2 tumour (31.9%) and 137 patients had a G3 tumour (27.5%). The proportion of each histological subtype was 38.6% (WDLPS), 44.5% (DDLPS) and other LPS (16.9%).
Clinical outcomes by TNM staging systemAt the last follow-up, 336 patients (67.6%) were alive and the median follow-up for the entire cohort was 51 (IQR, 23-83) months. The median OS for the entire cohort was 85 (95%CI, 73-97) months, with the 1-, 3-, and 5-year OS estimates of 87.9%, 75.3%, and 64.9%, respectively. Kaplan-Meier curves for OS were examined according to the 7th and 8th editions of the AJCC TNM (Figure 1).
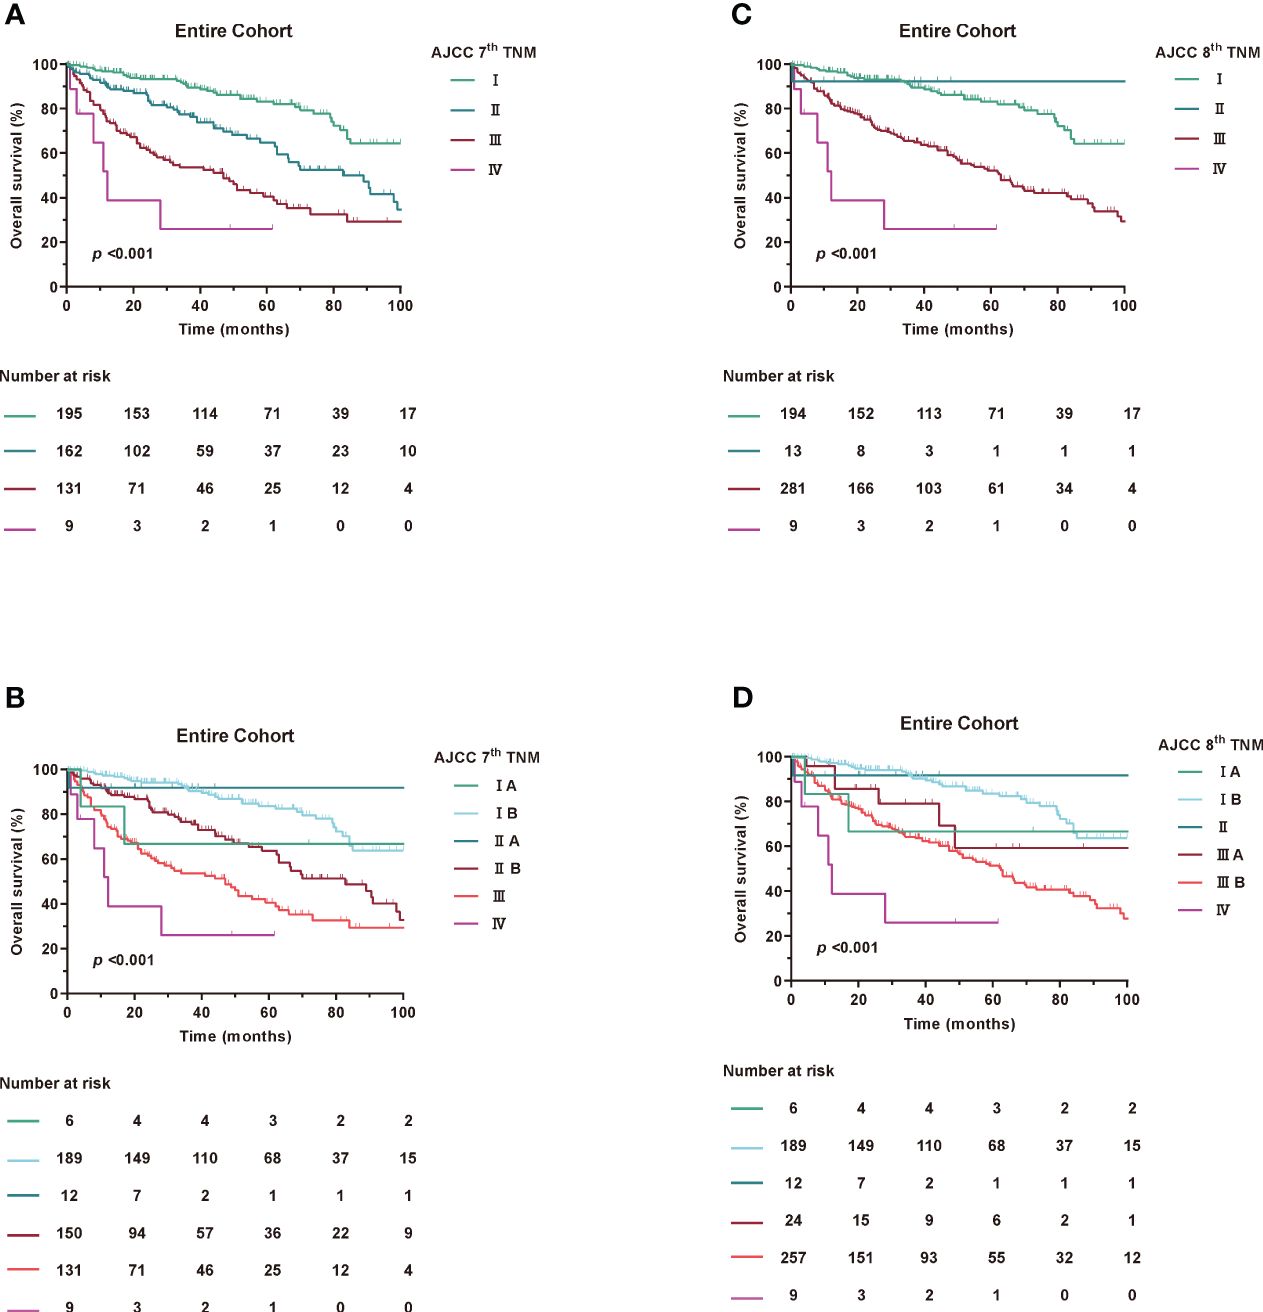
Figure 1 Kaplan-Meier curves of OS in Entire Cohort according to AJCC TNM staging. (A, B) AJCC 7th TNM staging, (C, D) AJCC 8th TNM staging.
Based on Kaplan-Meier survival analysis, the 5-year survival rates changed from 83.2% for stage I, 64.7% for stage II, 40.5% for stage III and <25.9% for stage IV (log-rank, p<0.001) under the 7th AJCC TNM to 83.1% for stage I, NA for stage II, 52.2% for stage III and <25.9% for stage IV (log-rank, p<0.001) under the 8th AJCC TNM. Similar results were found in the SEER and ZSFD cohorts (Supplementary Figure 2).
In the subgroup of patients, neither 7th or 8th edition T stage was discriminative for survival (Supplementary Figure 3). Furthermore, no significant changes in N and M stage were observed between the 7th and 8th editions (data not shown).
When assessing the prognostic accuracy for OS, the C-index reached 0.694 (95% CI, 0.673-0.715) for 7th AJCC TNM and 0.654 (95% CI, 0.635-0.672) for 8th AJCC TNM staging system (Table 3). The AUC value at 1, 3 and 5 years were 74.5%, 72% and 70.7% for the 7th edition and 70.2%, 68.5% and 67.7% for the 8th edition for OS as shown in Supplementary Figure 4. The time-dependent AUCs indicated that 7th has higher AUCs compared to 8th of the OS. Consistent with the overall cohort, similar results were found in the SEER and ZSFD cohorts, respectively (Supplementary Figure 5).
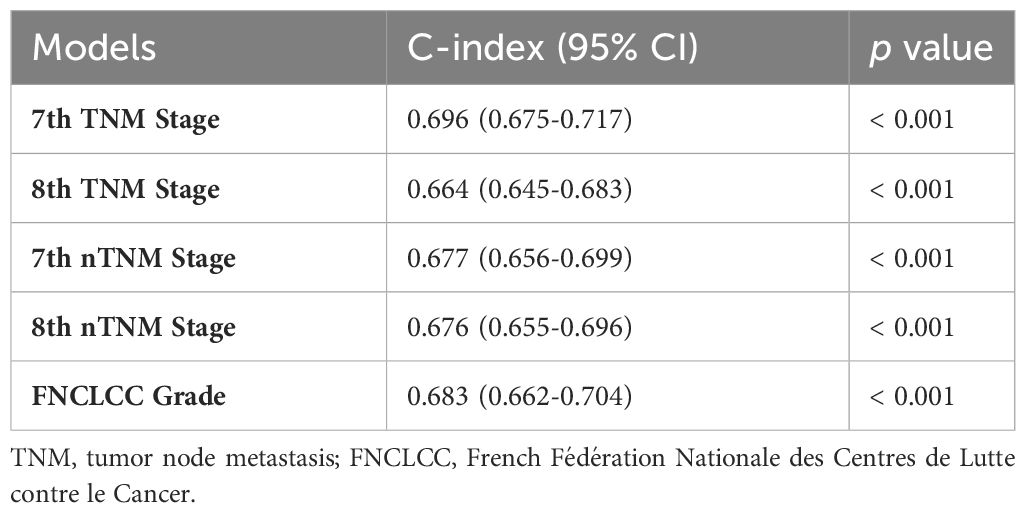
Table 3 Summary of the C-index of prognostic models for OS in patients with RPLS.
Taken together, these results demonstrate that the 7th edition has a more even staging distribution and a slightly improved prognostic accuracy for RPLS compared to the 8th edition.
Proposed modifications to the 7th and 8th editionAccumulating evidence has shown that RPLS, unlike other solid tumours, is located in the retroperitoneal space without any obvious clinical features during tumour progression (17, 18). In addition, patients were always diagnosed with a large tumour volume and an overloaded tumour burden (2). We then estimated the value of T stage in prognostic accuracy for OS. Interestingly, patients with tumour diameters of less than 5 cm were extremely rare, both in the 7th edition of stage IA and IIA and the 8th edition of stage IA and II (Figure 2), which had greatly attracted our attention.
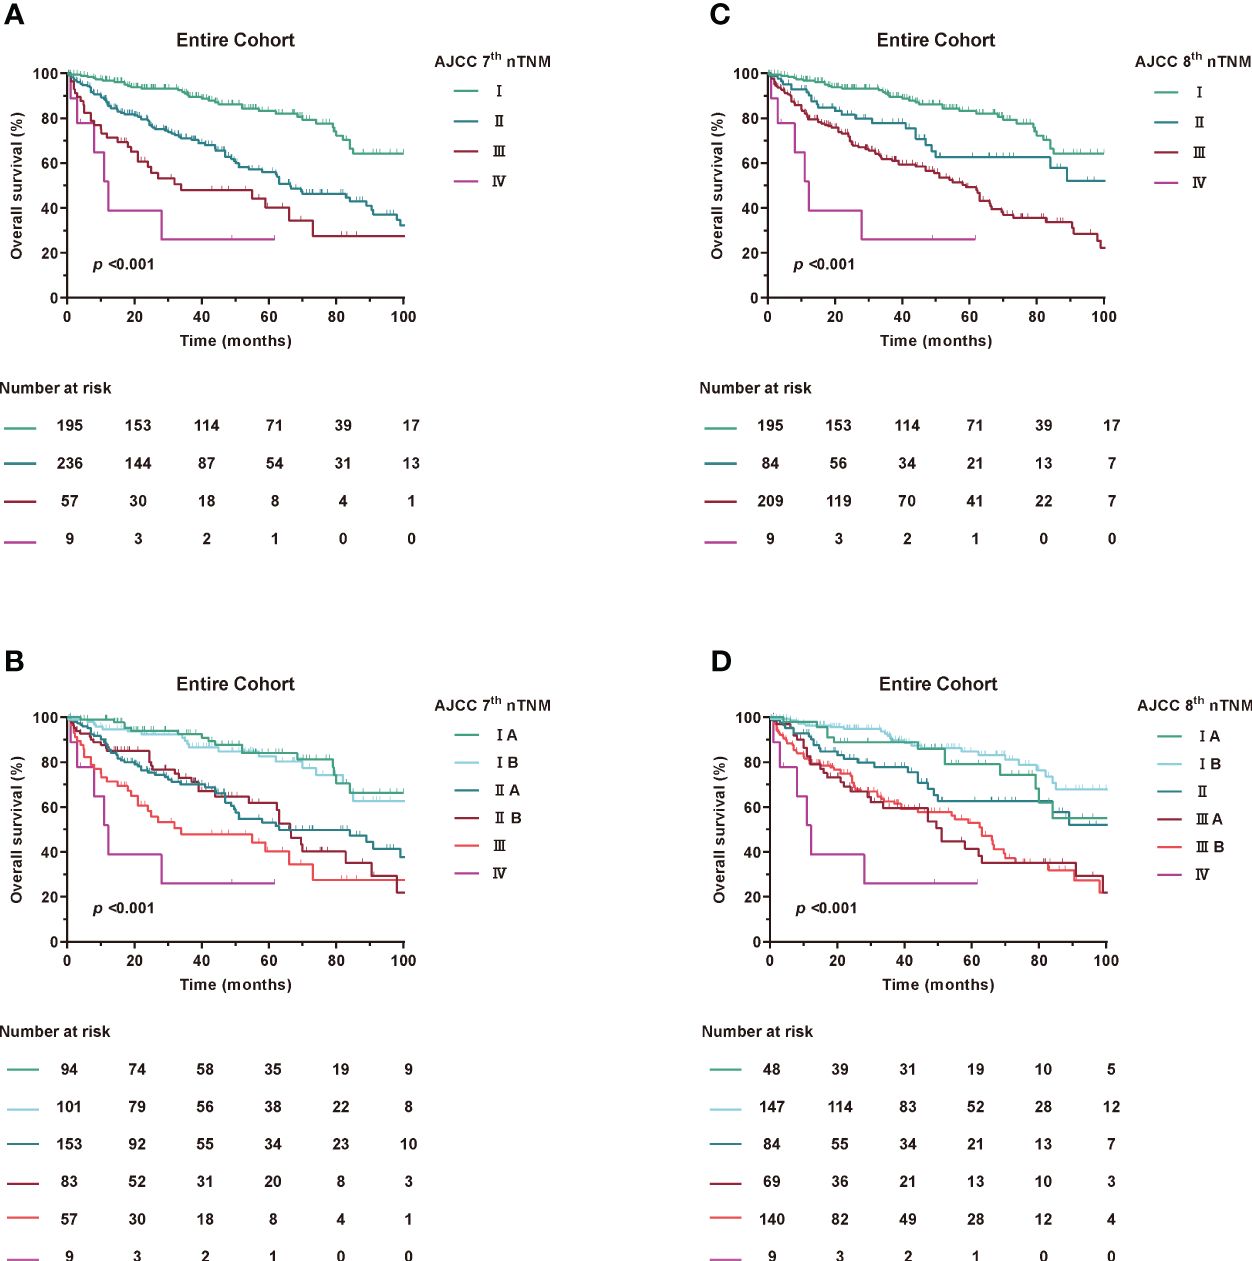
Figure 2 Kaplan-Meier curves of OS in Entire Cohort according to modified AJCC TNM staging. (A, B) AJCC 7th nTNM staging, (C, D) AJCC 8th nTNM staging.
Patients were restaged according to the newly proposed tumour size staging, which is based on median and quartile of the entire cohort. For the 8th edition staging criteria, T1: ≤15 cm maximum diameter, T2: >15 to 21 cm maximum diameter, T3: >21 cm to 30 cm maximum diameter, and T4: >30 cm. Meanwhile, for the 7th edition staging criteria, T1: ≤21 cm maximum diameter, T2: >21 cm maximum diameter.
Using the new modified T-stage classification and regrouping the TNM staging, the distribution of patients was optimised for stage IA in 48 patients (9.6%), stage IB in 147 (29.5%), stage II in 84 (16.9%), stage IIIA in 69 (13.8%), stage IIIB in 140 (28.1%) and stage IV in 9 (1.8%) in the 8th edition. Meanwhile, according to the AJCC 7th TNM, stage IA was found in 94 patients (18.9%), stage IB in 101 (20.3%), stage IIA in 153 (30.7%), stage IIB in 83 (16.7%), stage III in 57 (11.4%), and stage IV in 9 (1.8%) (Supplementary Table 2).
When assessing the prognostic accuracy of the new T stage on OS, the C-index was 0.675 (95% CI, 0.655-0.696) for the modified 7th edition and 0.673 (95% CI, 0.653-0.693) for the modified 8th edition (Table 3). The ROC curve for predicting OS at 1, 3 and 5 years showed an AUC of 73.3%, 70.7% and 69% for the modified 7th edition and an AUC of 72.6%, 69.5% and 68.4% for the modified 8th edition, as shown in Supplementary Figure 6.
To further explore the prognostic predictive power of the nTNM staging in different histological subtypes of RPLS, we performed further analyses. Since the main component was on WDLPS and DDLPS, we empirically divided the WDLPS, mixed liposarcoma and ‘liposarcoma, NOS’ into a group named H1, and the remaining into a group named H2. The results of the study showed that the C-indexes of H1 in 7th nTNM and 8th nTNM staging 0.632 and 0.643, whereas the C-indexes of H2 were 0.607 and 0.590. The ROC curves for the 7th nTNM and 8th nTNM staging in H1 and H2 predicting 1-, 3-, and 5-year postoperative survival are shown in the Supplementary Figure 7.
Taken together, these results suggest that the overall model fit of the nTNM staging is better compared with 7th TNM and 8th TNM staging and that the new T staging can be used as a powerful tool for RPLS risk stratification.
FNCLCC grade in prognosisSince histologic grading has been shown to be one of the factors most strongly associated with postoperative prognosis in patients with RPLS (12, 19, 20), we also examined the association between the modified 7th and 8th edition histological grades. Notably, histological grade analysis based on FNCLCC grading remained unchanged. In addition, the C-index for FNCLCC grade alone was 0.683 (95% CI, 0.662-0.704) for prognostic accuracy (Table 3). Furthermore, the FNCLCC grade showed a statistically significant survival difference in risk stratification compared with the TNM staging system (Figure 3), as confirmed by the results of the SEER and ZSFD cohorts. However, when assessing the prognostic accuracy for OS in the combination of FNCLCC grade and TNM, the C-index reached 0.710 (95% CI, 0.688-0.732).
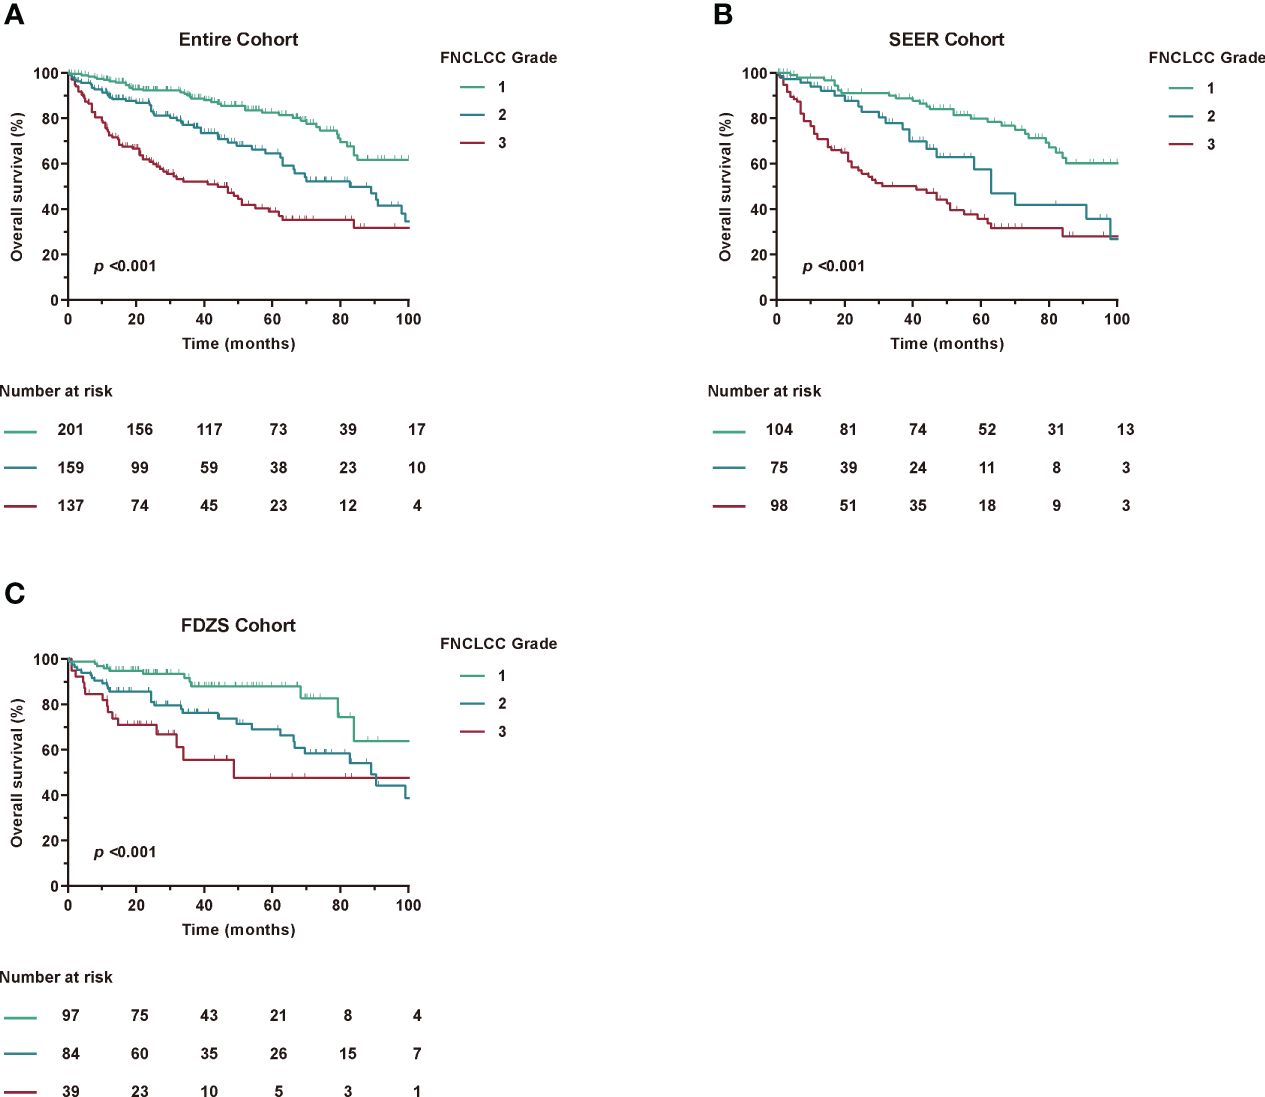
Figure 3 Kaplan-Meier curves of OS according to FNCLCC Grade among different cohorts. (A) Entire Cohort, (B) SEER Cohort, (C) FDZS Cohort.
Taken together, these results showed that the TNM staging system had some advantages over FNCLCC grade alone, but needed to be improved in a larger RPLS cohort.
Nomogram development and validationNomogram is a concise graphical model that integrates multiple prognostic-related factors and is an effective tool for personalized risk assessment of cancer patients (21, 22). To further explore the significant differences in baseline variables and tumour characteristics, we constructed the OS-related nomogram, including sex, age, tumour size, FNCLCC grade pathological subtypes, lymph node metastasis and distant metastasis (Figure 4A). Of note, the C-index reached 0.726 (95% CI, 0.705-0.748) and the AUC values at 1, 3, and 5 years postoperatively were 77.2%, 75%, and 77.1%, respectively (Figure 4B). The calibration curve showed that the actual OS rate was highly consistent with the nomogram estimated OS rate (Figure 4C).
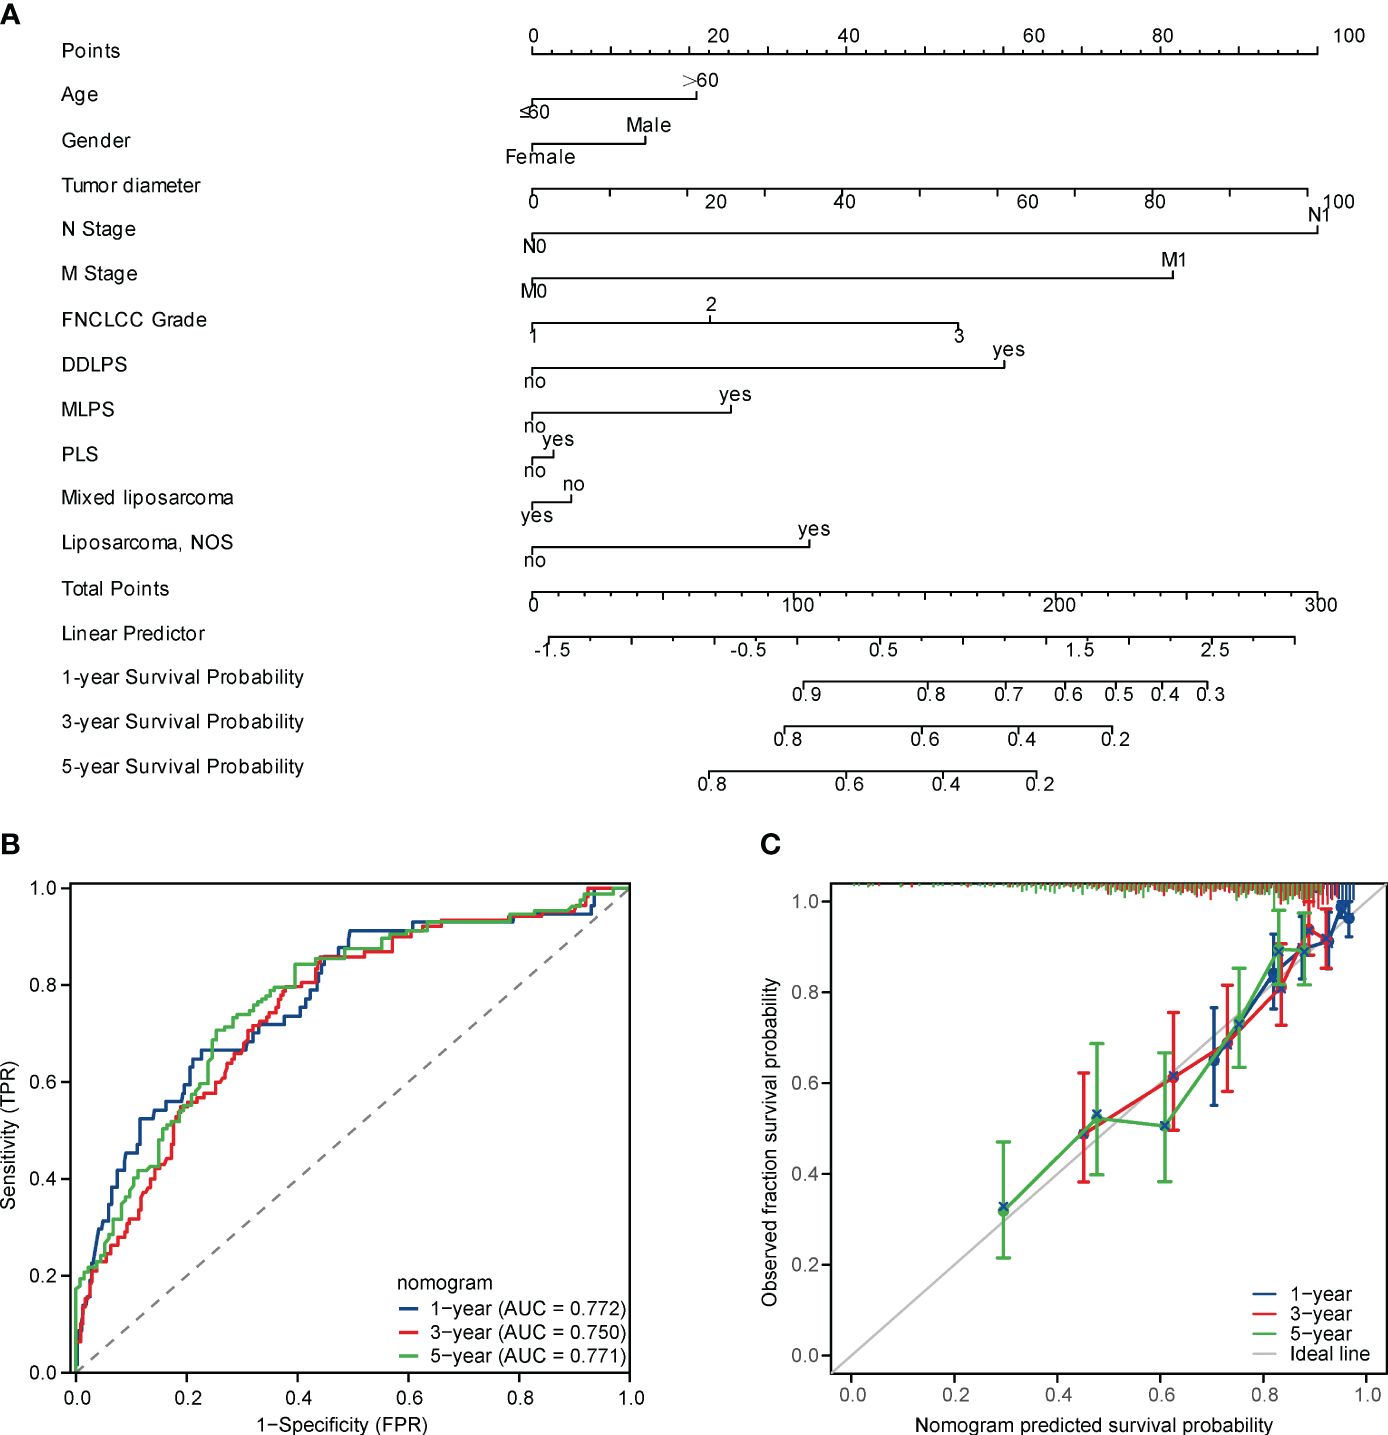
Figure 4 (A) A nomogram for predicting the 1-, 3-, 5-year OS in RPLS after resection, (B) Receiver operating characteristic (ROC) curves of the nomogram in predicting 1-, 3-, 5-year OS in RPLS after resection, (C) Calibration plots of the nomogram in predicting 1-, 3-, 5-year OS in RPLS after resection.
DiscussionTumour heterogeneity requires personalised cancer therapy (23–26). However, RPLS is one of the most heterogeneous types of solid tumours (27). Determining a patient’s postoperative risk can assist oncologists in developing the most appropriate personalized treatment plan (28). However, the broad nature of the TNM staging system and the heterogeneity of patients with tumours in the same stage make its widespread use for risk stratification still imperfect.
Furthermore, RPLS was particularly influenced by anatomical location, tumour biological behaviour, histological grade and pathological subtype (12, 29–31). Given its rarity, heterogeneity and heterogeneous therapeutic response, the true predictors of survival and staging system for RPLS are still under investigation.
Relative to the 7th AJCC TNM, the 8th AJCC TNM addresses this issue by providing separate staging algorithms according to the anatomic location of the sarcoma, such as limbs and trunk, retroperitoneum, or head and neck (11). However, no significant improvement was found, which may be related to the behaviour of different histological types of sarcomas (32).
Several studies have now evaluated the 8th AJCC TNM staging system (33, 34). However, categorizing continuous data generates regression coefficients that are weighted according to the distribution of data within each category, which almost always fails to capture the true nonlinear relationship between a continuous variable and its log hazard (35). In any case, risk stratification for lymph node metastasis (LNM) is unlikely to play a major determining role in prognostic model performance, as less than 5% of sarcoma patients develop nodal metastases (32).
To the best of our knowledge, studies that have modified the T-staging in the TNM staging system and developed a comprehensive nomogram for estimating OS are lacking. This study proposes a nomogram that combines the TNM staging system and other widely assessed clinical characteristics to accurately assess the optimal stratification of patients with RPLS.
Compared with the widely used Sarculator (3) and the multicentre nomogram proposed by Gronchi A (4), the nomogram proposed in this study has comparable predictive performance and is unique to RPLS. The C index of the sarculator and the multicentre nomogram proposed by Gronchi A in RPS is 0.73 (6) and 0.68 (4), respectively. The nomogram proposed in this study had excellent discriminatory power (C index 0.726; 95% CI 0.705-0.748) and the actual OS was highly consistent with the probability of OS estimated by the nomogram, which was confirmed by the calibration curves, which represents a reliable model with strong predictive performance for OS estimation in RPLS.
A number of nomograms for predicting survival in STS or RPLS have been available in the published literature since 2002 (36–38), but unfortunately most of them were not covered by the TNM staging system. To fill this gap, we conducted a large real-world study including 220 primary RPLS patients from the ZSFD database and 277 RPLS from the SEER database to develop and validate a nomogram for estimating OS.
LimitationsThere exist some limitations of the research that cannot be ignored. Firstly, selection bias may be unavoidable due to the retrospective cohort study design. Second, although the internal validation cohort of the SEER database showed excellent discriminatory power with a high degree of concordance between the actual OS and the estimated OS probability of the nomogram, which was confirmed by the calibration curves, we did not perform external validation in China or the United States (Unite State of America). Third, this study was conducted in a high-flow sarcoma centre and may not be generalizable to a small population of RPLS patients.
ConclusionsCompared with 8th AJCC TNM, 7th AJCC TNM staging system showed a more homogeneous staging distribution and a slight improvement in the prognostic accuracy of RPLS. The revised T-stage and nTNM systems showed better risk stratification performance. The FNCLCC stage was found to have high prognostic value, further emphasising histological grade is the least negligible prognostic factor in predicting patient survival. The constructed nomogram model enables individualized prognostic analysis and helps to develop risk-adapted therapy for RPLS patients.
Data availability statementThe data that support the findings of this study are available on request from corresponding author.
Ethics statementThe studies involving humans were approved by Institutional Review Board of Zhongshan Hospital, Shanghai, China (ID: B2022-586R). The studies were conducted in accordance with the local legislation and institutional requirements. Written informed consent for participation was not required from the participants or the participants’ legal guardians/next of kin in accordance with the national legislation and institutional requirements.
Author contributionsPF: Conceptualization, Data curation, Formal analysis, Methodology, Validation, Writing – original draft, Writing – review & editing. PT: Conceptualization, Formal analysis, Methodology, Validation, Writing – original draft. ZW: Conceptualization, Data curation, Formal analysis, Investigation, Methodology, Writing – original draft. JW: Conceptualization, Data curation, Supervision, Writing – original draft. YH: Supervision, Writing – review & editing. WL: Resources, Supervision, Writing – review & editing. LM: Conceptualization, Formal analysis, Methodology, Resources, Supervision, Writing – original draft, Writing – review & editing. YZ: Conceptualization, Methodology, Resources, Supervision, Writing – review & editing. HT: Conceptualization, Formal analysis, Methodology, Resources, Supervision, Validation, Writing – original draft, Writing – review & editing.
FundingThe author(s) declare financial support was received for the research, authorship, and/or publication of this article. This work was supported by grants from Scientific Research Project of Shanghai Municipal Health Commission (20214Y0087, 20204Y0409); Hongkou District "Outstanding Young Talents in Clinical Medicine" Training Program (No. HKLCYQ2024-01); "Young Talents" Training Plan of Shanghai TCM-integrated Hospital (No. RCPY0063); Scientific Research Project of Shanghai TCM-integrated Hospital (No. 18-01-03); Scientific Research Project of Hongkou District Health Committee (No. 2003-02); Fujian Natural Science Foundation (No. 2023J011698); Xiamen Natural Science Foundation (No. 3502Z20227280).
Conflict of interestThe authors declare that the research was conducted in the absence of any commercial or financial relationships that could be construed as a potential conflict of interest.
Publisher’s noteAll claims expressed in this article are solely those of the authors and do not necessarily represent those of their affiliated organizations, or those of the publisher, the editors and the reviewers. Any product that may be evaluated in this article, or claim that may be made by its manufacturer, is not guaranteed or endorsed by the publisher.
Supplementary materialThe Supplementary Material for this article can be found online at: https://www.frontiersin.org/articles/10.3389/fonc.2024.1373762/full#supplementary-material
References1. Gamboa AC, Gronchi A, Cardona K. Soft-tissue sarcoma in adults: an update on the current state of histiotype-specific management in an era of personalized medicine. CA Cancer J Clin. (2020) 70(3):200-29. doi: 10.3322/caac.21605
PubMed Abstract | CrossRef Full Text | Google Scholar
2. Improta L, Tzanis D, Bouhadiba T, Abdelhafidh K, Bonvalot S. Overview of primary adult retroperitoneal tumours. Eur J Surg Oncol. (2020) 46:1573–9. doi: 10.1016/j.ejso.2020.04.054
PubMed Abstract | CrossRef Full Text | Google Scholar
3. Squires MH, Ethun CG, Donahue EE, Benbow JH, Anderson CJ, Jagosky MH, et al. A multi-institutional validation study of prognostic nomograms for retroperitoneal sarcoma. J Surg Oncol. (2021) 124:829–37. doi: 10.1002/jso.26586
PubMed Abstract | CrossRef Full Text | Google Scholar
4. Gronchi A, Miceli R, Shurell E, Eilber FC, Eilber FR, Anaya DA, et al. Outcome prediction in primary resected retroperitoneal soft tissue sarcoma: histology-specific overall survival and disease-free survival nomograms built on major sarcoma center data sets. J Clin Oncol. (2013) 31:1649–55. doi: 10.1200/JCO.2012.44.3747
PubMed Abstract | CrossRef Full Text | Google Scholar
5. Eilber FC, Brennan MF, Eilber FR, Dry SM, Singer S, Kattan MW. Validation of the postoperative nomogram for 12-year sarcoma-specific mortality. Cancer-Am Cancer Soc. (2004) 101:2270–5. doi: 10.1002/cncr.20570
CrossRef Full Text | Google Scholar
6. Wong RX, Koh YS, Ong F, Farid M, Tay TKY, Teo M. Applicability of the Sarculator and MSKCC nomograms to retroperitoneal sarcoma prognostication in an Asian tertiary center. Asian J Surg. (2020) 43:1078–85. doi: 10.1016/j.asjsur.2020.01.005
PubMed Abstract | CrossRef Full Text | Google Scholar
7. Callegaro D, Miceli R, Bonvalot S, Ferguson P, Strauss DC, Levy A, et al. Development and external validation of two nomograms to predict overall survival and occurrence of distant metastases in adults after surgical resection of localised soft-tissue sarcomas of the extremities: a retrospective analysis. Lancet Oncol. (2016) 17:671–80. doi: 10.1016/S1470-2045(16)00010-3
PubMed Abstract | CrossRef Full Text | Google Scholar
8. Subbiah V, Meyer C, Zinner R, Bernstam F, Zahurak ML, O'Connor A, et al. Phase ib/II study of the safety and efficacy of combination therapy with multikinase VEGF inhibitor pazopanib and MEK inhibitor trametinib in advanced soft tissue sarcoma. Clin Cancer Res. (2017) 23:4027–34. doi: 10.1158/1078-0432.CCR-17-0272
PubMed Abstract | CrossRef Full Text | Google Scholar
9. Callegaro D, Miceli R, Mariani L, Raut CP, Gronchi A. Soft tissue sarcoma nomograms and their incorporation into practice. Cancer-Am Cancer Soc. (2017) 123:2802–20. doi: 10.1002/cncr.30721
CrossRef Full Text | Google Scholar
10. Tattersall HL, Callegaro D, Ford SJ, Gronchi A. Staging, nomograms and other predictive tools in retroperitoneal soft tissue sarcoma. Chin Clin Oncol. (2018) 7:36. doi: 10.21037/cco
PubMed Abstract | CrossRef Full Text | Google Scholar
11. Amin MB, Greene FL, Edge SB, Compton CC, Gershenwald JE, Brookland RK, et al. The Eighth Edition AJCC Cancer Staging Manual: Continuing to build a bridge from a population-based to a more "personalized" approach to cancer staging. CA Cancer J Clin. (2017) 67:93–9. doi: 10.3322/caac.21388
PubMed Abstract | CrossRef Full Text | Google Scholar
12. Cates J. Performance analysis of the american joint committee on cancer 8th edition staging system for retroperitoneal sarcoma and development of a new staging algorithm for sarcoma-specific survival. Ann Surg Oncol. (2017) 24:3880–7. doi: 10.1245/s10434-017-6116-8
PubMed Abstract | CrossRef Full Text | Google Scholar
13. Anaya DA, Lahat G, Liu J, Xing Y, Cormier JN, Pisters PW, et al. Multifocality in retroperitoneal sarcoma: a prognostic factor critical to surgical decision-making. Ann Surg. (2009) 249:137–42. doi: 10.1097/SLA.0b013e3181928f2f
PubMed Abstract | CrossRef Full Text | Google Scholar
14. Huggett BD, Cates J. The Vanderbilt staging system for retroperitoneal sarcoma: a validation study of 6857 patients from the National Cancer Database. Mod Pathol. (2019) 32:539–45. doi: 10.1038/s41379-018-0166-8
PubMed Abstract | CrossRef Full Text | Google Scholar
15. Kim KD, Lee KW, Lee JE, Hwang JA, Jo SJ, Kim J, et al. Postoperative outcomes of distal pancreatectomy for retroperitoneal sarcoma abutting the pancreas in the left upper quadrant. Front Oncol. (2021) 11:792943. doi: 10.3389/fonc.2021.792943
PubMed Abstract | CrossRef Full Text | Google Scholar
17. Miao RC, Wan Y, Zhang XG, Zhang X, Deng Y, Liu C, et al. Devascularization of the superior mesenteric vein without reconstruction during surgery for retroperitoneal liposarcoma: A case report and review of literature. World J Gastroenterol. (2018) 24:2406–12. doi: 10.3748/wjg.v24.i22.2406
PubMed Abstract | CrossRef Full Text | Google Scholar
18. Yamashita Y, Kurisu K, Kimura S, Ueno Y. Successful resection of a huge metastatic liposarcoma in the pericardium resulting in improvement of diastolic heart failure: a case report. Surg Case Rep. (2015) 1:74. doi: 10.1186/s40792-015-0079-4
PubMed Abstract | CrossRef Full Text | Google Scholar
20. Lahat G, Tuvin D, Wei C, Anaya DA, Bekele BN, Lazar AJ, et al. New perspectives for staging and prognosis in soft tissue sarcoma. Ann Surg Oncol. (2008) 15:2739–48. doi: 10.1245/s10434-008-9970-6
PubMed Abstract | CrossRef Full Text | Google Scholar
21. Weiser MR, Chou JF, Keshinro A, Chapman WC Jr, Bauer PS, Mutch MG, et al. Development and assessment of a clinical calculator for estimating the likelihood of recurrence and survival among patients with locally advanced rectal cancer treated with chemotherapy, radiotherapy, and surgery. JAMA Netw Open. (2021) 4:e2133457. doi: 10.1001/jamanetworkopen.2021.33457
PubMed Abstract | CrossRef Full Text | Google Scholar
22. Jin S, Liu H, Yang J, Zhou J, Peng D, Liu X, et al. Development and validation of a nomogram model for cancer-specific survival of patients with poorly differentiated thyroid carcinoma: A SEER database analysis. Front Endocrinol (Lausanne). (2022) 13:882279. doi: 10.3389/fendo.2022.882279
PubMed Abstract | CrossRef Full Text | Google Scholar
23. Gerlinger M, Rowan AJ, Horswell S, Math M, Larkin J, Endesfelder D, et al. Intratumor heterogeneity and branched evolution revealed by multiregion sequencing. N Engl J Med. (2012) 366:883–92. doi: 10.1056/NEJMoa1113205
PubMed Abstract | CrossRef Full Text | Google Scholar
24. Ciriello G, Miller ML, Aksoy BA, Senbabaoglu Y, Schultz N, Sander C. Emerging landscape of oncogenic signatures across human cancers. Nat Genet. (2013) 45:1127–33. doi: 10.1038/ng.2762
PubMed Abstract | CrossRef Full Text | Google Scholar
25. Kandoth C, McLellan MD, Vandin F, Ye K, Niu B, Lu C, et al. Mutational landscape and significance across 12 major cancer types. Nature. (2013) 502:333–9. doi: 10.1038/nature12634
PubMed Abstract | CrossRef Full Text | Google Scholar
26. Wheler J, Lee JJ, Kurzrock R. Unique molecular landscapes in cancer: implications for individualized, curated drug combinations. Cancer Res. (2014) 74:7181–4. doi: 10.1158/0008-5472.CAN-14-2329
PubMed Abstract | CrossRef Full Text | Google Scholar
27. Yan L, Wang Z, Cui C, Guan X, Dong B, Zhao M, et al. Comprehensive immune characterization and T-cell receptor repertoire heterogeneity of retroperitoneal liposarcoma. Cancer Sci. (2019) 110:3038–48. doi: 10.1111/cas.14161
PubMed Abstract | CrossRef Full Text | Google Scholar
28. Raoul JL, Faivre S, Frenel JS, Rimassa L. Medical oncologists must get more involved in systemic treatment of hepatocellular carcinoma. Ann Oncol. (2019) 30:6–8. doi: 10.1093/annonc/mdy471
CrossRef Full Text | Google Scholar
29. Tan MC, Brennan MF, Kuk D, Agaram NP, Antonescu CR, Qin LX, et al. Histology-based classification predicts pattern of recurrence and improves risk stratification in primary retroperitoneal sarcoma. Ann Surg. (2016) 263:593–600. doi: 10.1097/SLA.0000000000001149
PubMed Abstract | CrossRef Full Text | Google Scholar
30. Park JO, Qin LX, Prete FP, Antonescu C, Brennan MF, Singer S. Predicting outcome by growth rate of locally recurrent retroperitoneal liposarcoma: the one centimeter per month rule. Ann Surg. (2009) 250:977–82. doi: 10.1097/SLA.0b013e3181b2468b
PubMed Abstract | CrossRef Full Text | Google Scholar
31. Tucci JJ, Dashti NK, Cates J. A proposed staging system for improved prognostication of MDM2-amplified liposarcoma. Am J Surg Pathol. (2021) 45:101–7. doi: 10.1097/PAS.0000000000001554
留言 (0)