
記住我


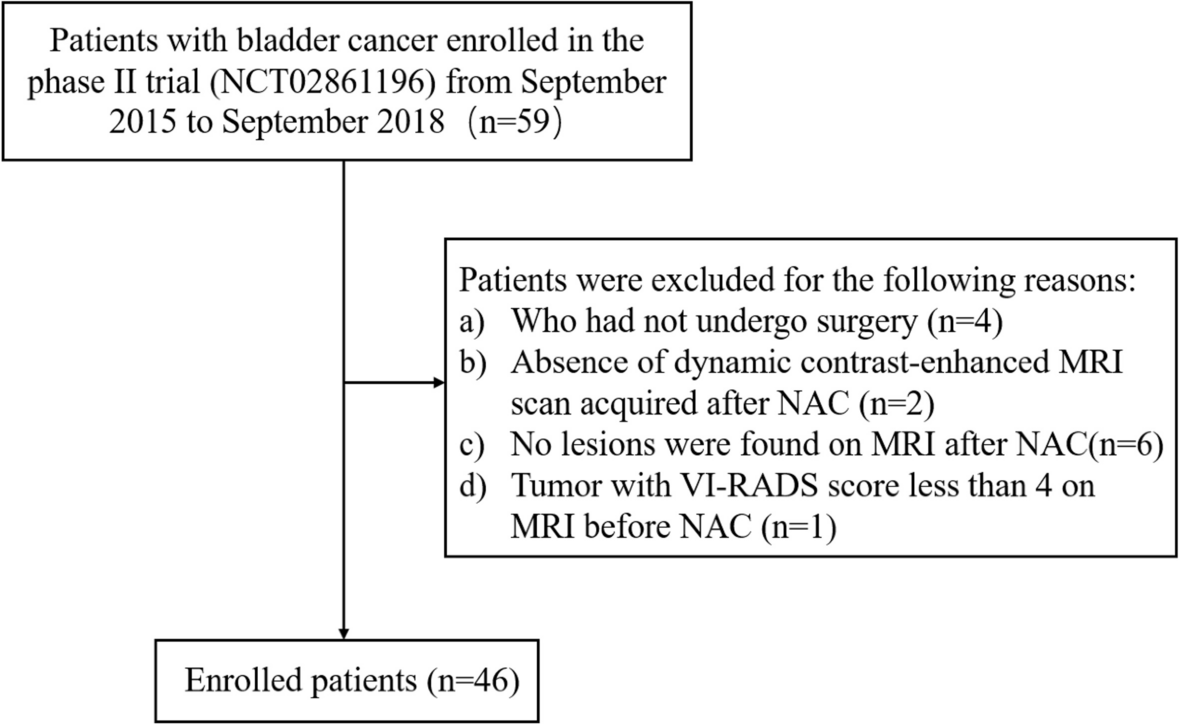


Due to the retrospective nature of this study, patient informed consent was waived. We included 233 consecutive CRC patients with lung metastases who underwent initial RFA between August 2016 and June 2019. Inclusion criteria were: (1) confirmed CRC through histology; (2) lung metastases treated with RFA, ≤ 3 cm in maximum diameter; (3) comprehensive medical records with clinical variables and CT data from procedure and follow-up; (4) technically successful ablation; (5) adequate normal organ function. Exclusion criteria were: (1) receiving other local treatments like radiotherapy or re-ablation; (2) inability to tolerate RFA; (3) concurrent malignant tumors or extrapulmonary metastasis. Patients with multiple nodules were included, analyzing each nodule individually [10, 23, 24]. A cohort of 515 lung metastases in 233 CRC patients who underwent RFA was enrolled and randomly divided into training and test cohorts at a 4:1 ratio (Fig. 1). Supplementary data 1 provided detailed RFA equipment and procedure information.
Fig. 1
Flow diagram of the enrolment patients
The clinical variables including age, gender, serum tumor markers (carcinoembryonic antigen (CEA) and cancer antigen 19–9 (CA19–9)), lymphadenopathy at diagnosis, concomitant systemic treatment, and primary tumor location were collected within 1 week before RFA. Radiological data from intraoperative CT scans included pulmonary metastases size, location, proximity to vital structures like the heart or major blood vessels (> 3 mm in diameter), distance to the pleura or diaphragm (within 1 cm), electrode type, and complications such as IAH or pneumothorax.
CT examination protocol and local efficacy assessmentPre- and immediate post-ablation CT scans were conducted using the United Imaging uCT 760 (United Imaging Medical Technology Inc.) and Philips Brilliance 64 slice (Philips Medical Systems Inc.) machines. Settings were: 200 mA, 120 kVp, 0.5 s/round, with 1 mm or 1.5 mm section thickness. The images were reconstructed using iterative reconstruction, and the resulting CT data was stored in the. DICOM format.
A contrast-enhanced chest CT was conducted as the baseline 1 month after ablation [25], followed by additional scans every 2 to 3 months. The treatment’s local efficacy was assessed by two experienced radiologists who were unaware of clinical data. Evaluation was grounded in chest-enhanced CT scans performed at least 6 months after RFA, adhering to the modified response evaluation criteria in solid tumors (mRECIST) criteria [11, 26]. Should there be differences in interpretation between the radiologists, consultation with a senior expert boasting over 20 years of experience was pursued. Complete response (CR) was determined by the presence of cavity, fibrosis, or nodule without enhancement. In contrast, the presence of irregular nodular, scattered, or eccentric patterns of peripheral enhancement within 1 cm of the ablation area in two consecutive CT scans denoted a non-complete response (non-CR).
Workflow of radiomics analysisThe radiomics analysis was executed through a series of steps: image segmentation, feature extraction, feature selection, signature construction, and evaluation (Fig. 2).
Fig. 2
Workflow of radiomics analysis
Advanced image processing and mask segmentationTo enhance the robustness of medical image analysis, preprocessing techniques were applied. The CT images were uniformed to a common resolution of 1 mm × 1 mm × 1 mm by the B-spline interpolation algorithm, and then the window width was adjusted within the range of - 1200 Hu to 600 Hu and the intensity was scaled within the range of 0 ~ 255.
Recently, numerous studies have demonstrated that the improved methods based on U-Net performed well in the segmentation of pulmonary nodules, which were trained on the Image Database Resource Initiative (IDRI) created by the US Institutes of Health based on the Lung Image Database Consortium (LIDC) [27,28,29,30,31]. We also have trained a 3D UNet model based on the open-source dataset to segment the target lesions and immediate ablation regions from pre- and postoperative CT images, with a Dice coefficient of 83.04% [32]. These masks were subsequently verified by two junior radiologists (HZH and HC, 8 years of specialized chest imaging) and the necessary adjustments have been made to guarantee accuracy and repeatability using the ITK-SNAP (version 3.8.0, http://www.itksnap.org). If they had disagreements, it would be determined in consultation with the senior expert (WTL, 30 years of specialized chest imaging).
Peritumoral region dilationThe regions of interest (ROI) were expanded using the mask padding toolkit provided by the Onekey AI platform. We evaluated the impact of different peritumoral sizes on model predictability by applying dilation intervals of 5 mm. Any ROIs extending beyond the lungs or overlapping with the heart, major blood vessels, or diaphragm were manually adjusted.
Habitat generationLocal features, including local entropy and energy values, were extracted from each voxel within VOI. These feature vectors represented diverse aspects of voxel properties. A 77-dimensional feature vector (Supplementary data 2) was generated for each block using a 3 × 3 × 3 non-overlapping moving window. The Calinski-Harabasz (CH) value selection method [33] was used to determine the optimal number of clusters. Subsequently, the K-means method was employed to cluster sub-regions for each sample.
Feature extraction and selectionHandcrafted features extracted using the Pyradiomics tool (version 3.0.1) were categorized into three groups: geometry, intensity, and texture (Supplementary data 2), following the guidelines of the imaging biomarker standardization initiative (IBSI). Unsupervised clustering yielded varying physical meanings for the habitat extracted from the subregions with identical centers. To mitigate this, mean feature values were computed.
Robustness was assessed through test-retest and inter-rater analyses, with the intraclass correlation coefficient (ICC) set at a threshold of ≥0.85. Nonetheless, ICC was not suitable for assessing the unsupervised habitat signature. All features were standardized using Z-scores to maintain a normal distribution, followed by a t-test to retain radiomic features with p-value < 0.05. Pearson’s correlation coefficient was computed to pinpoint highly consistent features with a coefficient > 0.9. The greedy recursive deletion strategy was then employed to filter out the highly redundant features. To curb overfitting, the minimum redundancy maximum relevance (mRMR) algorithm selected the top 8 features for each modality. The final features set was determined using the least absolute shrinkage and selection operator (LASSO) regression. LASSO adjusted parameter λ to assign zero regression coefficients to irrelevant features. Optimal λ value selection involved 10-fold cross-validation with minimum criteria, aiming for the lowest mean square error (MSE).
Signature constructionSeveral radiomics signatures were formulated based on distinct regions: intratumor and ablated area (Intra), intratumor with expanded tumor and ablated regions (5 mm and 10 mm, Peri-X), intratumor and ablated area subregions (Habitat), and intratumor combined with peritumoral regions. Additionally, the optimal peritumoral region was integrated with the tumor microenvironment habitat, termed Habitat + Peri-X. The Clinical signature was created from independent risk factors identified via multivariate logistic analysis. Commonly used machine learning models, including logistic regression (LR), support vector machine (SVM), K-nearest neighbor (KNN), random forest (RF), extremely randomized trees (ExtRa Trees), eXtreme gradient boosting (XGBoost), light gradient boosting machine (LightGBM), and multi-layer perceptron (MLP), were employed for model construction. Optimal hyperparameters for each model were determined using five-fold cross-validation and the Grid-search algorithm.
Performance evaluationThe performance of various signatures was verified using an independent test dataset, generating receiver operating characteristic (ROC) curves to calculate the corresponding area under the curve (AUC). The Delong test was used to compare predictive performance differences among the models [34]. Additionally, accuracy, sensitivity, specificity, positive predictive value (PPV), and negative predictive value (NPV) were computed. The Youden index determined the optimal cut-off value maximizing the sum of sensitivity and specificity [35]. Calibration curves were plotted to assess calibration accuracy, alongside the Hosmer-Lemeshow (HL) test [36] (A significant test statistic implies that the model does not calibrate perfectly.). Moreover, decision curve analysis (DCA) gauged the clinical utility of predictive signatures [37].
Statistical analysisStatistical analyses were performed using IBM SPSS (version 26.0). Continuous variables were presented as mean ± standard deviation (SD) and compared using the Man-Whitney U test. Categorical variables were expressed as counts with percentages and compared using the Chi-square or Fisher test. Variables with a P-value < 0.05 in univariate regression analysis were included in multivariable analysis. Variables with a P-value < 0.05 in multivariable analysis were considered independent predictors linked to immediate response. All statistical tests were two-sided with a significance level set at P < 0.05.
留言 (0)