
記住我


Background: Physician work hours directly influence patient access to health care services and play a vital role in physician human resource planning. We sought to evaluate long-term trends in hours worked by physicians in Canada, overall and by subgroup.
Methods: We used Statistics Canada’s Labour Force Survey to identify physicians via occupation and industry coding information. We estimated descriptive statistics and performed graphical analysis of the average weekly hours worked by physicians over the 1987–2021 period.
Results: Overall, weekly physician work hours remained stable from 1987 until 1997, after which they declined. Average weekly hours decreased by 6.9 hours (p < 0.001), from 52.8 in 1987–1991 to 45.9 in 2017–2021. Among male physicians, work hours declined notably after 1997, while those of female physicians remained relatively stable at around 45 per week. Hours worked by married physicians declined significantly, amounting to 7.4 fewer hours per week (p = 0.001). In contrast, unmarried physicians displayed a statistically insignificant decline of 2.2 hours (p = 0.3). The COVID-19 pandemic was associated with a sharp but brief disruption in weekly hours; by the end of 2020, physicians’ work hours had returned to prepandemic levels.
Interpretation: These findings may indicate a long-term shift in work preferences among Canadian physicians; male physicians may be seeking a better work–life balance, which, in turn, has narrowed the gap in hours worked by sex, with potential implications for pay equity. Policymakers and planners should carefully consider changes in hours worked, rather than just the total number of physicians, to ensure an accurate evaluation of the physician workforce.
Physician work hours directly influence patient access to health care services and play a vital role in physician human resource planning, but the current understanding of work hour trends among physicians in Canada is limited. Changes in the work patterns of physicians can affect the effective supply of physician services and, subsequently, patients’ access to care. Traditionally, physician workforce planning, and health workforce planning broadly, has focused on demographic considerations, evaluating the age and sex composition of the workforce to determine the supply required to replace retiring professionals.1 Examples of such planning models in Canada include the Canadian Medical Association’s Physician Resources Evaluation Template and the Ontario Ministry of Health’s Assessing Doctor Inventories and Net-Flows models.2,3
In absolute terms and adjusted for population, the existing physician supply is considered high compared with previous years, but people in Canada are encountering challenges in accessing physician services.4,5 As seen in the United States, current difficulties may not stem from changes in physicians per capita (i.e., extensive margin) but rather from decreases in physician labour supply (i.e., intensive margin), specifically, the number of hours worked per physician and its impact on service availability.6 Several explanations for the decline in hours have been posited, including that physicians may be seeking improved work–life balance6,7 or are reducing work hours in association with increased remuneration.8 Traditional planning models have primarily focused on the extensive margin. To enhance the effectiveness of these models, a broader range of behavioural factors that underpin labor market choices should be incorporated, including hours worked.7,9,10
Most of the available information on hours worked has derived from surveys conducted by the Canadian Medical Association and affiliated organizations.11 However, these surveys suffer from inconsistent survey instruments or methodologies and irregular or infrequent data collection, impeding rigorous analysis of trends. One notable study, focusing on direct patient care hours provided by family physicians, observed a secular decline in hours worked from 1982 to 2003.12
Incorporating work hour trends into planning models can provide insights to inform the medical profession, the public, and governments. We sought to evaluate long-term trends in work hours for physicians in Canada, overall and by subgroup, particularly by sex.
MethodsStudy design and settingWe employed annual cross-sectional data sets from Canada, spanning 1987 to 2021, to evaluate temporal trends in physician work hours. These data sets incorporated individual-level data on hours, alongside a range of physician characteristics.
Data sourcesOur analysis employed data on demographics and hours worked from Statistics Canada’s Labour Force Survey (LFS), a mandatory monthly survey that sampled about 54 000 households (110 000 people) in 2020. Respondents were interviewed in 6 successive months, typically mid-month; we employed the first interview for each respondent.13 We accessed and analyzed the confidential LFS master file (person-level data) through the Statistics Canada Research Data Centre (RDC) at McMaster University. We aggregated monthly files into annual ones. Hours of work were self-reported and collected in a consistent framework (Appendix 1, available at www.cmaj.ca/lookup/doi/10.1503/cmaj.231166/tab-related-content).
The first part of our analysis covered the period from 1987 to 2019. We also evaluated trends during the COVID-19 pandemic with quarterly data covering January to March 2020 (Q1) to October to December 2021 (Q4), compared with prepandemic data. We used corresponding quarters averaged over 2015–2019 for comparison rather than 2019 only to provide a more statistically stable basis for comparison. We employed sampling weights provided by Statistics Canada.
Using the LFS to analyze physicians is not common, but we are aware of 1 recent study using this rich data source.10
Trends in physician incomeTo study whether trends in hours worked were coincident with trends in physician incomes, we constructed indices based on annual data from the Canadian Institute for Health Information (CIHI) on physician payments and supply.14 We calculated annual average payments by dividing total physician payments by the number of physicians, and adjusted average payments for inflation using the all-item Consumer Price Index.4,15 We calculated hourly payment rates using data on hours worked from the LFS and assumed that physicians worked 48 weeks per year. Payment data from CIHI spanned 1990 to 2019, and did not disaggregate by sex.
Statistical analysisWe estimated descriptive statistics and performed graphical analysis of hours worked per week by physicians in Canada. We determined average hours worked in 4 5-year blocks during the 35-year study period (1987–1991, 1997–2001, 2007–2011, 2017–2021). We also created figures showing mean weekly hours worked, calculated annually and reported as 3-year centred moving averages to smooth idiosyncratic oscillations (e.g., the 2000 estimate is the average of 1999, 2000, and 2001). We estimated the overall trend and, to identify associated variables, trends for various subgroups by sex, specialty, work status, marital status, or region. We tested whether the mean hours worked during the latest 5-year period (2017–2021) were equal to those of the first 5-year period (1987–1991) using univariate ordinary least squares regression with heteroskedasticity-consistent standard errors and LFS weights. We performed statistical analyses using STATA version 17.0 SE.
Ethics approvalOur analysis did not require institutional review board approval because the microdata were handled within an RDC.
ResultsTable 1 depicts the characteristics of physicians in Canada over the past 3 decades. The proportion of female physicians doubled from 1987–1991 to 2017–2021, and that of self-employed and incorporated physicians tripled. The proportion of physicians with young children (aged ≤ 5 yr) declined, as did the percentage of married physicians. Mean hours worked per week by physicians — shown as a 3-year moving average in Figure 1 and reported at 5-year intervals in Table 2 — changed markedly during the sample period (p < 0.001). The 3-year moving average of physician weekly hours worked dropped 13.5%, from 52.7 (95% confidence interval [CI] 50.6–54.8) hours per week in 1988 to 45.6 (95% CI 44.3–46.9) hours per week in 2019. Weekly hours worked by female, and especially male, physicians remained fairly flat until the mid-1990s, although the overall average declined slightly as the proportion of female physicians increased (Figure 1). Starting around 1997, the average hours worked by male physicians declined markedly, although the rate of decrease fluctuated and the trend was not monotonic.
Table 1:Physician workforce characteristics in Canada, 1987–2021
Table 2:Mean hours worked per week by physicians in Canada, 1987–2021*
 Figure 1:
 Three-year moving average of physician weekly hours worked, by sex.
Table 2 provides data on mean weekly hours worked across several physician characteristics. Overall, the decline from 1987–1991 to 2017–2021 totaled 6.9 hours per week or 13.0% (p < 0.001). Declines were recorded for both family physicians and other specialists (p < 0.001). We observed no discernable differences in the declines in weekly hours for physicians in urban versus rural locations, those who were incorporated versus unincorporated, those aged 45 years or younger versus those older than 45 years, and those with versus without children aged 5 years or younger.
Trends by sex and marital statusNotable differences were evident in the work patterns of male and female physicians (Figure 1). Although the work hours of male physicians decreased markedly after 1997, no decline was observed among their female counterparts, whose hours remained relatively stable at around 45 hours per week. From 2003 onwards, female physicians’ work hours declined slightly to around 43 hours per week, a level that persisted until 2019. Overall, the mean weekly hours worked by male physicians decreased by 7.5 hours or 13.6% (p < 0.001), while females exhibited a statistically insignificant decline of 1.0 hour (p < 0.3). The decline in overall weekly hours worked represented a combination of the decline for each sex, and the changing sex composition of the workforce. We calculated that the overall decrease in work hours was predominantly driven by male physicians, accounting for 5.7 of the 6.9-hour decline or 83% of the reduction. Consequently, the gap in weekly hours worked by sex, which was around 10 hours in the mid-1990s, narrowed to about 4 hours by 2019.
We also observed diverging trends between married and unmarried physicians by sex (Table 2). The weekly work hours of married physicians declined significantly, amounting to 7.4 hours or 14.0% (p < 0.001). Within the subset of married physicians, the primary driver of the decline was male physicians, who exhibited a reduction of 7.8 hours or 14.8% (p < 0.001). The estimated 2.3-hour reduction in weekly hours among married females was not statistically significant.
Regional variation in trendsThe regional data revealed notable disparities in both average weekly hours worked at the beginning of the study period and the extent of declines observed until 2019. In 1987–1991, the average weekly hours worked varied considerably across regions, ranging from a low of 48.2 hours in Quebec to a high of 61.0 hours in Manitoba and Saskatchewan. However, this disparity narrowed significantly over time. By 2017–2021, the range spanned from 42.7 hours in British Columbia to 48.5 hours in the Atlantic region. All regions had double-digit percentage decreases in weekly hours, except for Quebec, where time worked declined by only 2.0 hours or 4.2% (p = 0.08). Other regions gradually converged toward the level of hours worked by physicians in Quebec and inter-regional differences declined over time.
Impact of the COVID-19 pandemicFigure 2 illustrates the weekly hours worked by physicians, by sex, following the onset of the COVID-19 pandemic. The overall reduction in hours worked in the second quarter of 2020 was about 15%, with a 20% decline observed among female physicians (p < 0.001) compared with the 11% (p < 0.001) decline observed for their male counterparts. However, this decline in hours worked was temporary. By the end of 2020, hours had fully recovered to prepandemic levels. Hours worked since the end of 2020 were not significantly different from the corresponding 2015–2019 levels for all physicians, male and female (Appendix 2, available at www.cmaj.ca/lookup/doi/10.1503/cmaj.231166/tab-related-content).
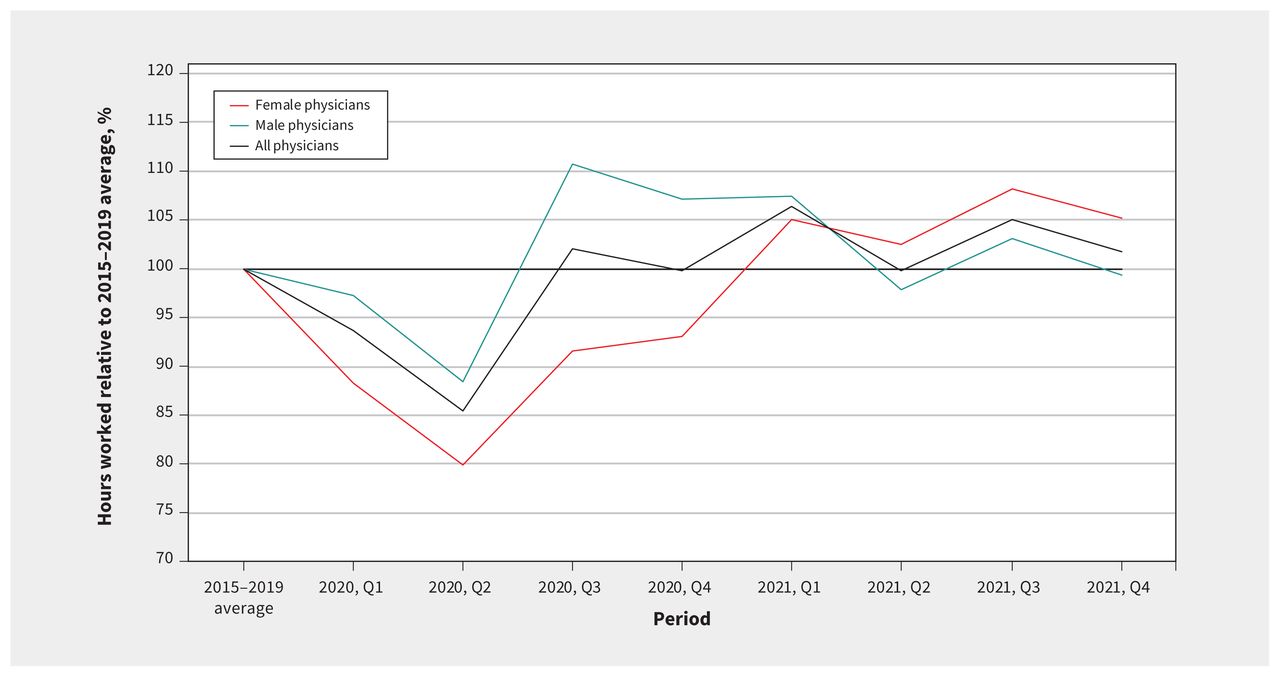 Figure 2:
 Physician weekly hours worked during the COVID-19 pandemic relative to 2015–2019 average. Note: Q1 = January–March, Q2 = April–June, Q3 = July–September, Q4 = October–December.
Trends in paymentDuring the 1990s, average physician payments on an hourly and annual basis were relatively stable, closely matching inflation (Figure 3). However, from about 2000 to 2010, physician payments showed rapid growth, increasing by about 65% on an inflation-adjusted hourly basis and about 45% on an inflation-adjusted annual basis. Since 2010, inflation-adjusted payments declined slightly on an annual basis and were close to flat on an hourly basis. The past 3 decades saw periods of both increased and stable average physician payments, even though the average weekly hours worked by physicians have consistently declined overall.
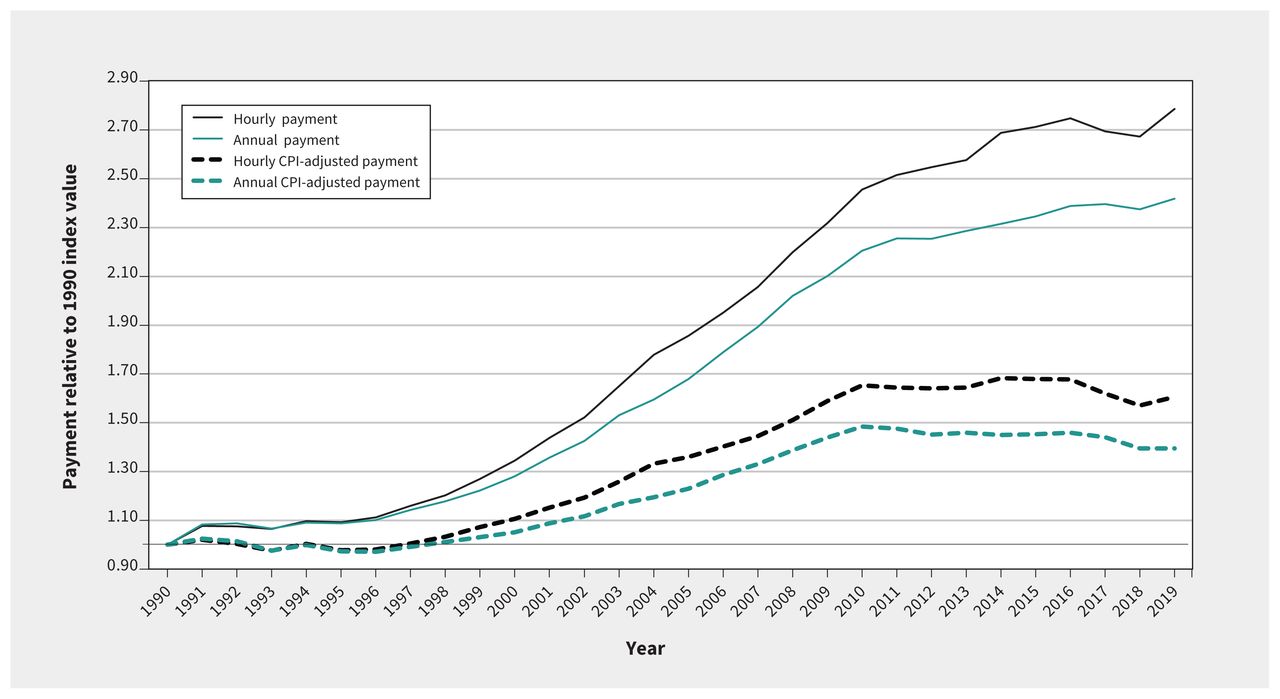 Figure 3:
 Average real annual and hourly payment per physician relative to 1990 index value. Note: CPI = Consumer Price Index.
InterpretationWe observed that male physicians have been working fewer hours per week over the last 3 decades, representing a change in the intensive margin of physician labour supply. In contrast, work hours among female physicians have declined non-significantly. Declining hours worked does not appear to coincide with a decline in earnings.
Medicine has historically exhibited a culture of long hours of work, with an expectation of round-the-clock availability, which has contributed to unhealthy work environments. Although we did not not attempt to determine the causes behind the decrease in physicians’ work hours, we propose that a shift in male physicians’ preferences toward achieving better work–life balance is an important contributing factor. The question of whether these trends are related to physician burnout is relevant. Characterized by emotional exhaustion, depersonalization, detachment from work, and reduced personal accomplishment,16–19 burnout can lead to negative effects on health, lower productivity, reduced work hours, and even exiting medical practice.20 A recent study of Ontario physicians cited improved work–life balance among the top 3 potential solutions to burnout.21 Even after the observed decline, compared with the entire Canadian workforce, physicians worked more hours per week. In 1987, workers aged 25 years and older who were employed full-time reported working 41.4 hours weekly in their main job; this declined by 4.6% to 39.5 hours by 2021.22 Relative to other full-time workers, in 2021, physicians worked about 20% more hours per week. We speculate that, in part, the decline in working hours may be a response to burnout.23
Declining physician work hours is not unique to Canada. Comparable trends exist in the United States,24 where average weekly physician hours dropped 7.6% between 2001 and 2021, predominantly because of the decline in hours worked by male physicians,6 and in the United Kingdom, where average hours for general practitioners and hospital-based physicians dropped by 25% and 21%, respectively, between 1998 and 2020.25 Similar observations in jurisdictions with different health care systems support our suggestion that these trends reflect a cultural shift, primarily among male physicians, toward more balanced home and work lives.
Another potential explanation for the decrease in physician hours could be the impact of payment increases exceeding target incomes.8 Like others, physicians make decisions regarding time allocation between work and other pursuits. The effect of hourly pay raises on these decisions can vary depending on individual preferences, resulting in either an increase in working hours (substitution effect) or a decrease in working hours (income effect).26 However, we found no evidence that increased physician payments and the resulting income effect contributed to reduced work hours. The decline in work hours occurred in periods of both rising and stable payments. The way forward will likely involve policy-makers increasing the size of the medical workforce — including physicians and other occupations involved in interdisciplinary care — faster than population growth to accommodate historical and potential future hour reductions (and increasing demand from an aging population).10
Evidence documents an earnings gap between female and male physicians; in Canada, female physicians earn about 10%–15% less than their male counterparts.27 The convergence in hours worked by sex will need to be considered in policies aimed at narrowing disparities in pay by sex. The gap in pay should have narrowed with the gap in hours.
More research is needed to establish the causes of declining hours and the resultant supply of physician services, as well as related changes in physician labour market behaviours, such as retirement ages.
LimitationsAlthough Statistics Canada’s LFS has the advantage of being consistently defined and implemented, it measures self-reported hours of work and does not allow direct patient care to be disaggregated from, for example, administration and research. Measuring hours worked does not account for technological advances that may have improved physician efficiency and offset any decrease in patient access. Although the LFS provides estimates from a sample, and therefore should not be expected to match CIHI’s counts exactly, it appears to systematically overestimate the share of physicians who are family physicians. For illustrative purposes, CIHI reported that 52% of all practising physicians were family physicians in 1987; this proportion was 50% in 2021.5 In contrast, the LFS estimates in the relevant periods were 55% and 60%, respectively. We speculate that physicians who responded to the relevant occupation question with full information were correctly coded. However, some respondents may have provided limited or incomplete information, in which case they were coded as family physicians. Furthermore, the LFS is limited to these 2 broad specialty categories whereas a finer specialty-level examination would be informative. More broadly, although we limited the sample to those who reported working as practising physicians, some misclassification may be present. We do not know how any such misclassification may have evolved over time or their effect on our trend estimates.
ConclusionPhysicians continue to work longer hours than the average of the Canadian workforce, but over the last 3 decades, work hours have decreased among male physicians. Policy-makers and health workforce planners should consider the hours worked by physicians, rather than relying on counts of practitioners. Given reasonable expectations regarding productivity, the medical workforce likely needs to increase in size to offset the decline in work hours while gender pay equity in medicine should be addressed. Policy-makers and health workforce planners can leverage the timely LFS time-series data to monitor physician work patterns.
FootnotesCompeting interests: None declared.
This article has been peer reviewed.
Contributors: All of the authors contributed to the conception and design of the work. Boris Kralj was responsible for the data analysis. All of the authors contributed to data interpretation. Boris Kralj drafted the manuscript. All of the authors revised it critically for important intellectual content, gave final approval of the version to be published, and agreed to be accountable for all aspects of the work.
Funding: The authors received no financial support for the research or authorship. Arthur Sweetman is partly funded by the Ontario Ministry of Health by virtue of holding the Ontario Research Chair in Health Human Resources. McMaster University provided support for article processing fees.
Data sharing: Labour Force Survey microdata are available directly from Statistics Canada via the Research Data Centre network (https://crdcn.ca/).
Accepted January 30, 2024.This is an Open Access article distributed in accordance with the terms of the Creative Commons Attribution (CC BY-NC-ND 4.0) licence, which permits use, distribution and reproduction in any medium, provided that the original publication is properly cited, the use is noncommercial (i.e., research or educational use), and no modifications or adaptations are made. See: https://creativecommons.org/licenses/by-nc-nd/4.0/
留言 (0)