Data source
Data from the Science and Technology Basic Resources Survey Special Project-China Maternal Nutrition and Health Scientific Survey (Northwest China Project Site) was used. This population-based prospective cohort study was conducted among pregnant women residing in Urumqi, northwest China, for an extended period. The cohort was established between August 2021 and April 2023, with pregnant women having an average age of (31.7 ± 4.0) years. Primiparous women constituted 64.1% of the sample.
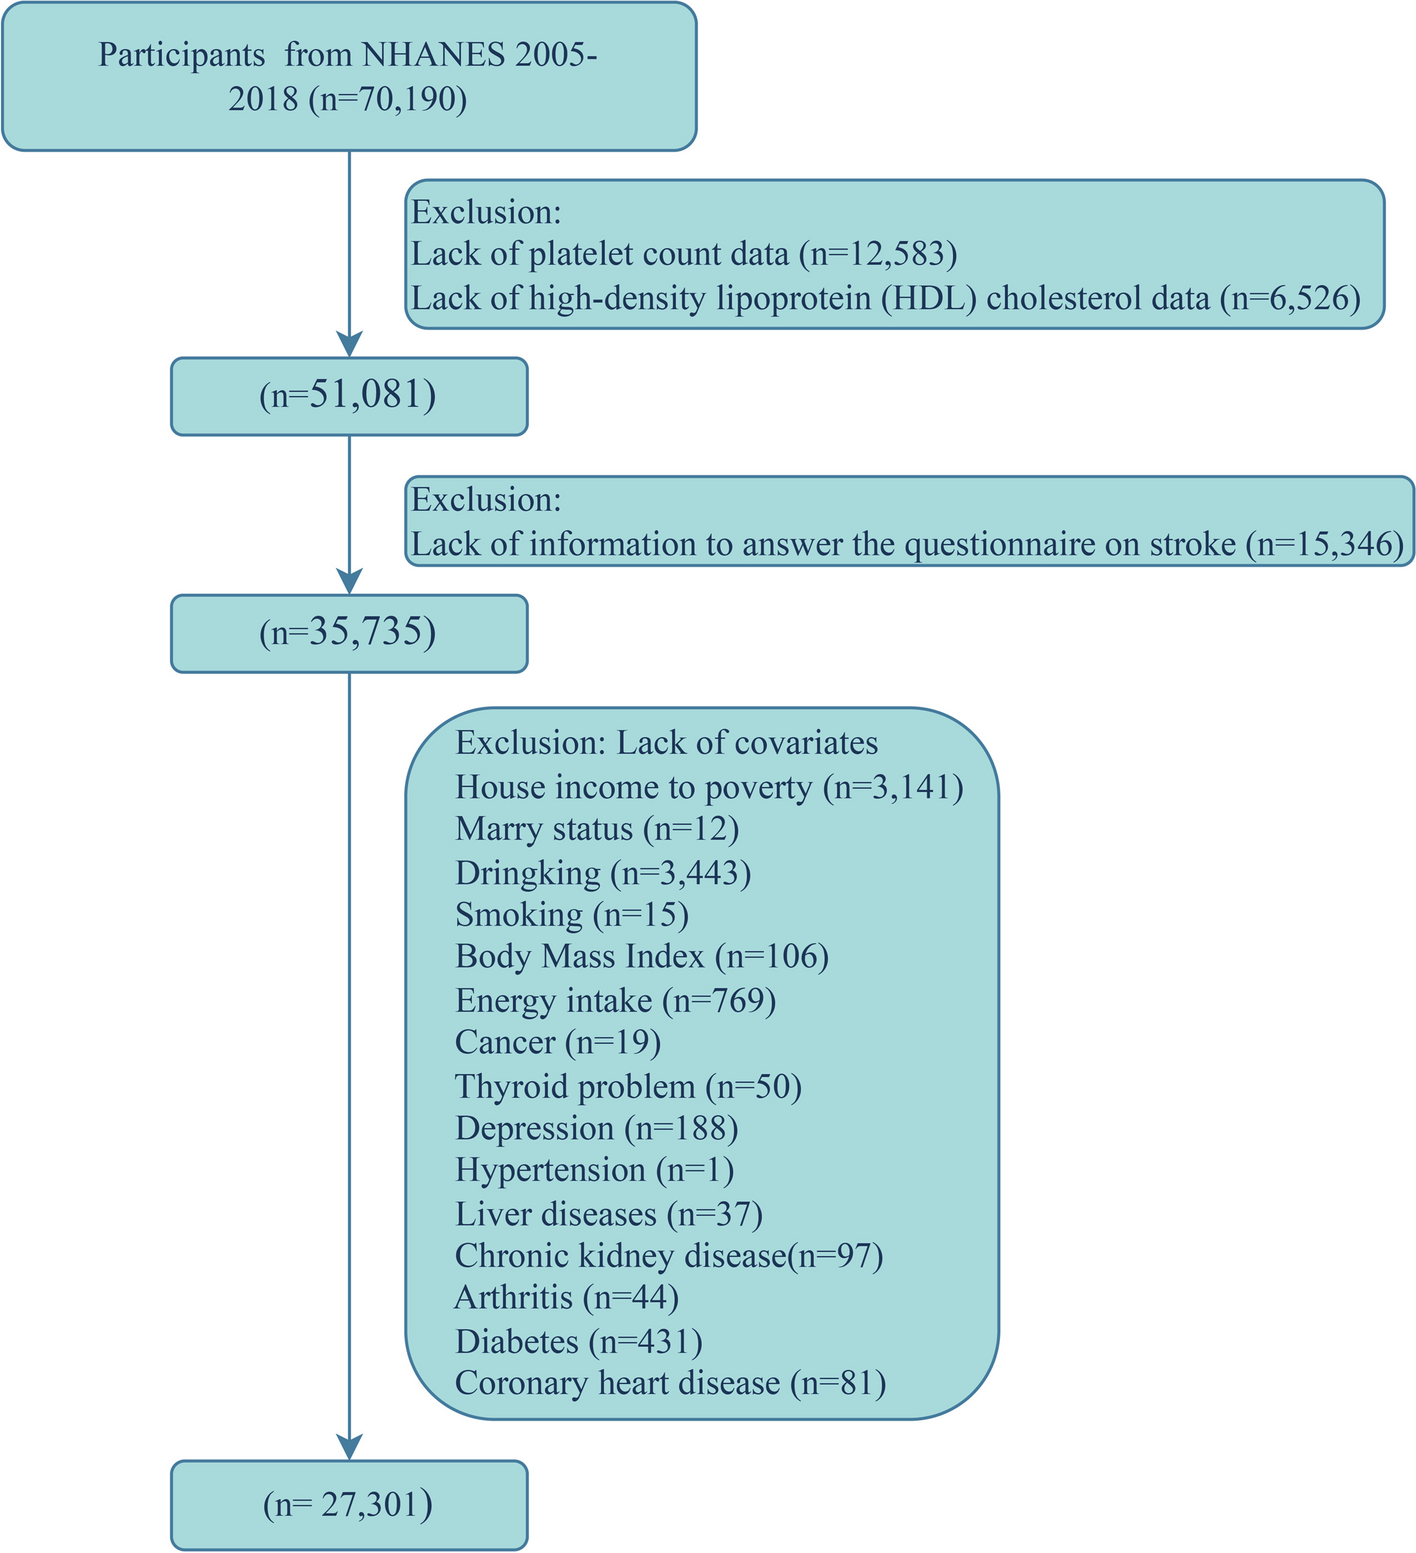
The inclusion criteria for this cohort study encompassed pregnant women aged 18 years or older, with a gestational age of less than 14 weeks, engaging in prenatal care for the first time, having signed an informed consent form, and demonstrating the ability to accurately understand and independently respond to the researchers’ questions. The exclusion criteria comprised women diagnosed with severe cardiovascular and cerebrovascular diseases, liver and kidney diseases, mental disorders, intellectual disabilities, or those unable to meet the study’s requirements independently. Additionally, women with pre-GDM were excluded based on medical history inquiry and blood glucose testing, following the guidelines of the International Association of the Diabetes and Pregnancy Study Groups. Similarly, pregnant women with hypertension before pregnancy or presenting with a systolic blood pressure (SBP) of ≥ 140 mmHg and/or a diastolic blood pressure (DBP) of ≥ 90 mmHg before 20 weeks of gestation, diagnosed as hypertension complicating pregnancy according to the definition provided by the International Society for the Study of Hypertension in Pregnancy, were also excluded from participation in the study. The final study population comprised 1,624 women with singleton pregnancies (Supplementary Fig. 1).
This study received approval from the Ethics Committee of the Institute of Nutrition and Health of the Chinese Centre for Disease Control and Prevention (Approval No. 2021-008) and adhered to the guidelines of the Declaration of Helsinki. The participants were adequately informed about the study’s objectives and procedures and provided written consent.
Measurements and definitionsData collection
During the first trimester of pregnancy (gestational age < 14 weeks), basic information questionnaires and biomarker measurements were collected. For women with regular menstrual cycles, fetal age was calculated from the first day of the last menstrual period to the current time. For those with irregular cycles, early pregnancy ultrasound examinations were conducted to estimate gestational age based on the size of the gestational sac and length of the embryonic bud. Based on this estimation, the last menstrual period can be inferred, and the fetal age can be calculated. Blood pressure was measured after a minimum 5-min rest in a sitting or lying position, using an upper arm blood pressure monitor to measure the right brachial artery blood pressure. Three measurements were taken, and the average was recorded. Blood samples were collected after a minimum 8-h fast for analysis of biomarkers including FPG (mg/dL), triglycerides (mg/dL), total cholesterol (TC, mg/dL), low-density lipoprotein cholesterol (LDL-C, mg/dL), high-density lipoprotein cholesterol (HDL-C, mg/dL), hemoglobin (g/L), uric acid (UA, μmoI/L), urine creatinine (μmoI/L), alanine aminotransferase (ALT, U/L), and aspartate aminotransferase (AST, U/L). The TyG index was also calculated. After delivery, data on pregnancy examinations and outcomes were collected.
Oral glucose tolerance test
The oral glucose tolerance test was conducted following the Chinese GDM diagnosis guidelines (2014). Pregnant subjects in their 24th–28th week of gestation maintained a normal diet for 3 days prior to their hospital visit, consuming no less than 150 g of carbohydrates daily and fasted for at least 8 h before the oral glucose tolerance test. During the examination, they remained seated and refrained from smoking. Subjects ingested 300 mL of a water solution containing 75 g of glucose within 5 min. Venous blood samples were collected before ingestion and at 1 and 2 h after ingestion (timing starts from the initial ingestion of the glucose solution) for glucose level measurement using the glucose oxidase method. A diagnosis of GDM was made if any of the following criteria were met or exceeded: a fasting blood glucose level of 5.1 mmol/L (91.90 mg/dL), a 1-h blood glucose level of 10.0 mmol/L (180.20 mg/dL), or a 2-h blood glucose level of 8.5 mmol/L (153.17 mg/dL). These criteria are consistent with the latest guidelines from the International Association of the Diabetes and Pregnancy Study Groups [20]. The definitions of gestational hypertension (GH) and preeclampsia are referred to the International Society for the Study of Hypertension in Pregnancy. The definitions of pregnancy-related complications (PRCs) other than GDM and hypertensive disorders were referred to International Classification of Diseases-10.
Other covariates
In addition to the primary variables, the study considered several other covariates known to impact outcome measures, including ethnicity, maternal age, pre-pregnancy BMI, assisted reproduction, abortion history, gravidity, parity, GWG, and gestational week of examination. Ethnicity and age were obtained from participants’ identification cards. Pre-pregnancy BMI was calculated by dividing pre-pregnancy weight (kg) by height squared (m). Fertility status was determined using information from participants’ questionnaires and obstetric/gynecological medical records.
According to the 2009 guidelines from the Institute of Medicine in the United States [21], recommended GWG is categorized as follows: for underweight individuals (BMI < 18.5 kg/m2), a weight gain of 12.5–18 kg during pregnancy; for normal weight individuals (18.5 ≤ BMI < 25 kg/m2), a weight gain of 11.5–16 kg during pregnancy; for overweight individuals (25 ≤ BMI < 30 kg/m2), a weight gain of 7–11.5 kg during pregnancy; and for obese individuals (BMI ≥ 30 kg/m2), a weight gain of 5–9 kg during pregnancy. Based on these guidelines, weight gain during pregnancy can be classified as: i) below the recommended range; ii) within the recommended range; or iii) above the recommended range.
Statistical analysis
The normal distribution of continuous variables was assessed using the Kolmogorov–Smirnov test. Continuous variables with a normal distribution were presented as mean ± standard deviation, while those not following a normal distribution were expressed as median (25th percentile, 75th percentile). Categorical variables were presented as frequencies and percentages. Differences in continuous variables between groups were compared using a one-way analysis of variance or the Kruskal–Wallis rank-sum test, while the chi-square test was employed to compare differences in categorical variables between groups.
To investigate the association between the TyG index and GDM, a multifactorial logistic regression analysis was conducted. The TyG index was evaluated both per unit and by quintile, with the lowest quintile serving as the reference. Two adjustments were made for potential confounding factors. Model 1 adjusted for ethnicity, pre-pregnancy BMI, maternal age, assisted reproduction, miscarriage history, gravidity, parity, gestational age at delivery, and GWG. Model 2 further adjusted for gestational age at examination, SBP, DBP, TC, LDL-c, HDL-c, hemoglobin, UA, urine creatinine, ALT, and AST. Subsequently, a linear trend assessment was performed on the model after evaluating the TyG index by quintiles.
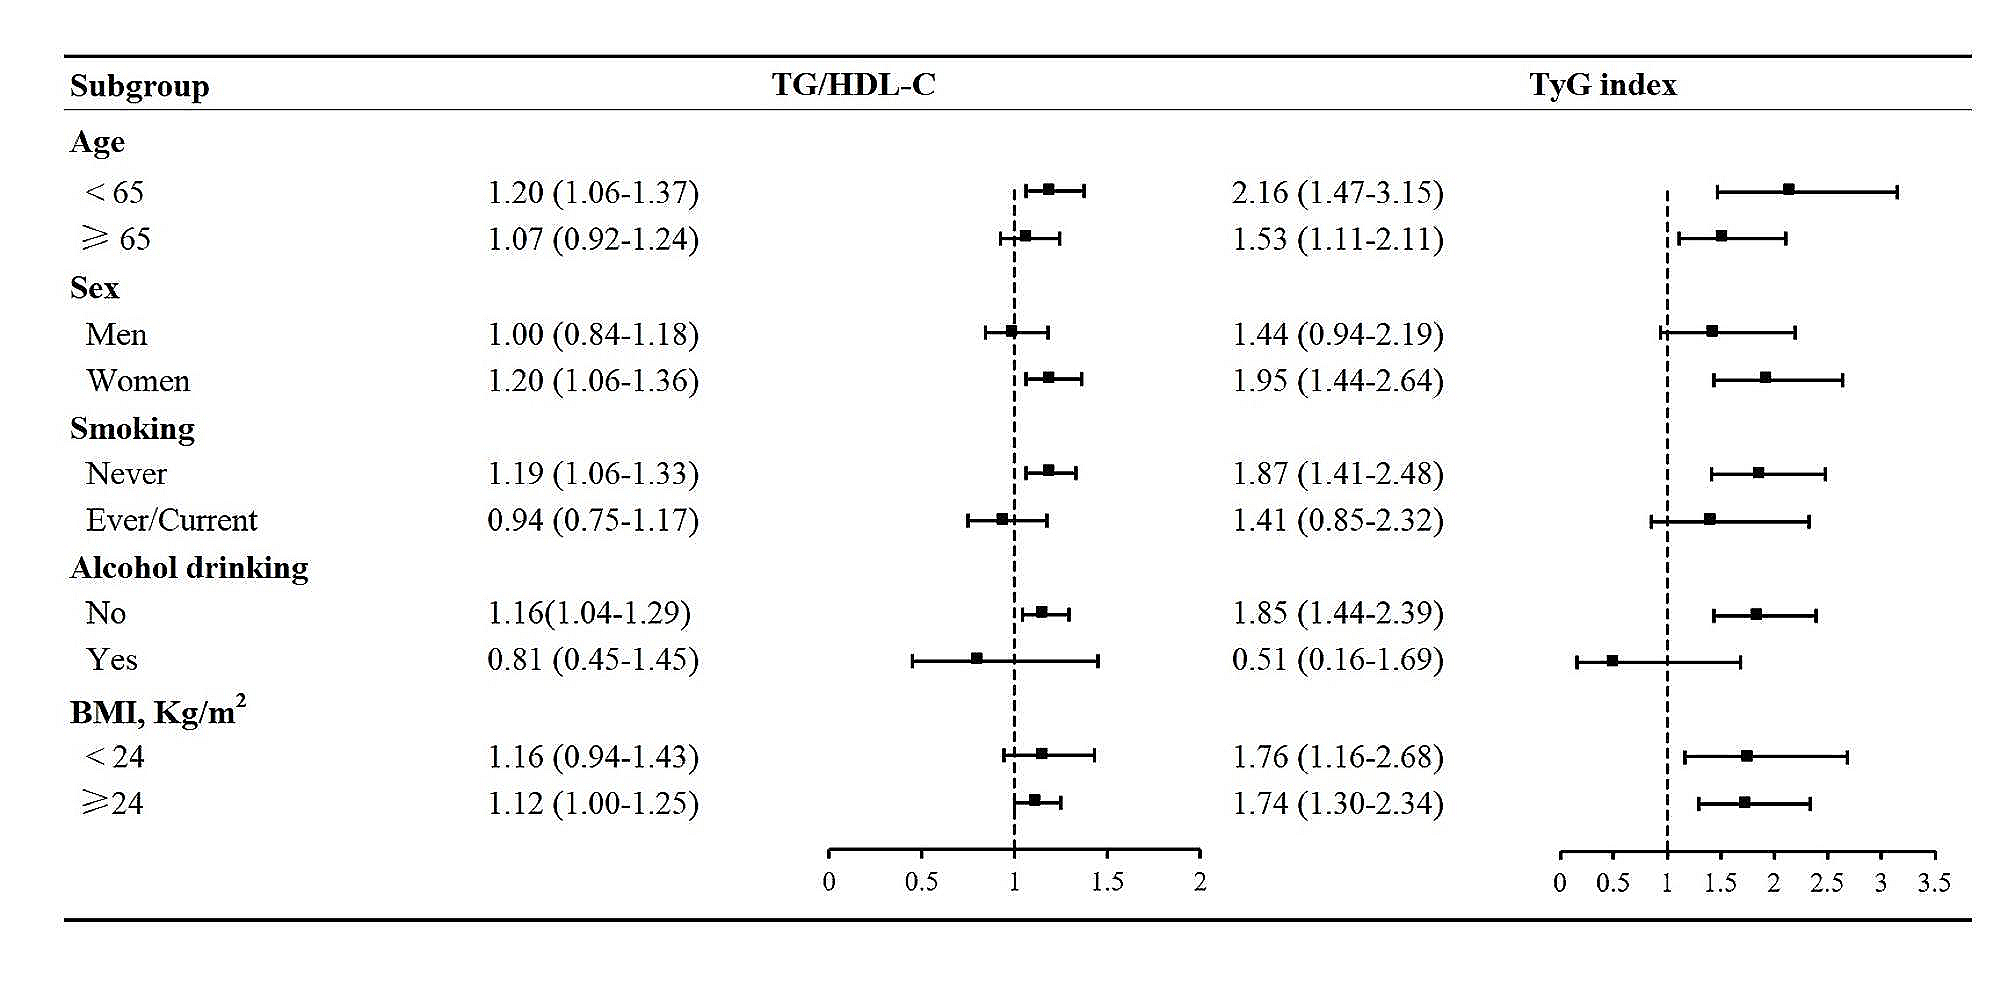
To expand the understanding of the association between the TyG index and GDM risk, subgroup analyses were conducted based on maternal age (< 30, 30–34, or ≥ 35 years), number of pregnancies (≤ 2, > 2), miscarriage history (no, yes), assisted reproduction (no, yes), pre-pregnancy BMI (underweight, normal weight, overweight, and obese), GWG (within or above recommended range), and preterm birth (no, yes). Interactions across these subgroups were evaluated using likelihood ratio tests to compare whether there were differences in effects among the subgroups.
Moreover, the possible nonlinear correlation between TyG index changes and PRCs was examined through restricted cubic spline analysis using the rms package in R software. Furthermore, to evaluate the predictive performance of the TyG index for PRCs, ROC curves were plotted, and AUC values were calculated using the pROC package in R software, with 95% confidence intervals (CI) computed using the bootstrap method. This study also compared the predictive ability of the “TyG index alone” and the “TyG index combined with maternal age and pre-pregnancy BMI” for GDM.
All statistical procedures were performed using SPSS 25.0, R 4.2.2, and MSTATA (https://www.mstata.com/). SPSS was utilized for descriptive statistics, regression analysis, and other statistical procedures, while R and MSTATA were employed for data visualization. A P-value of < 0.05 was considered statistically significant, while a P-value of < 0.01 was deemed highly statistically significant.


留言 (0)