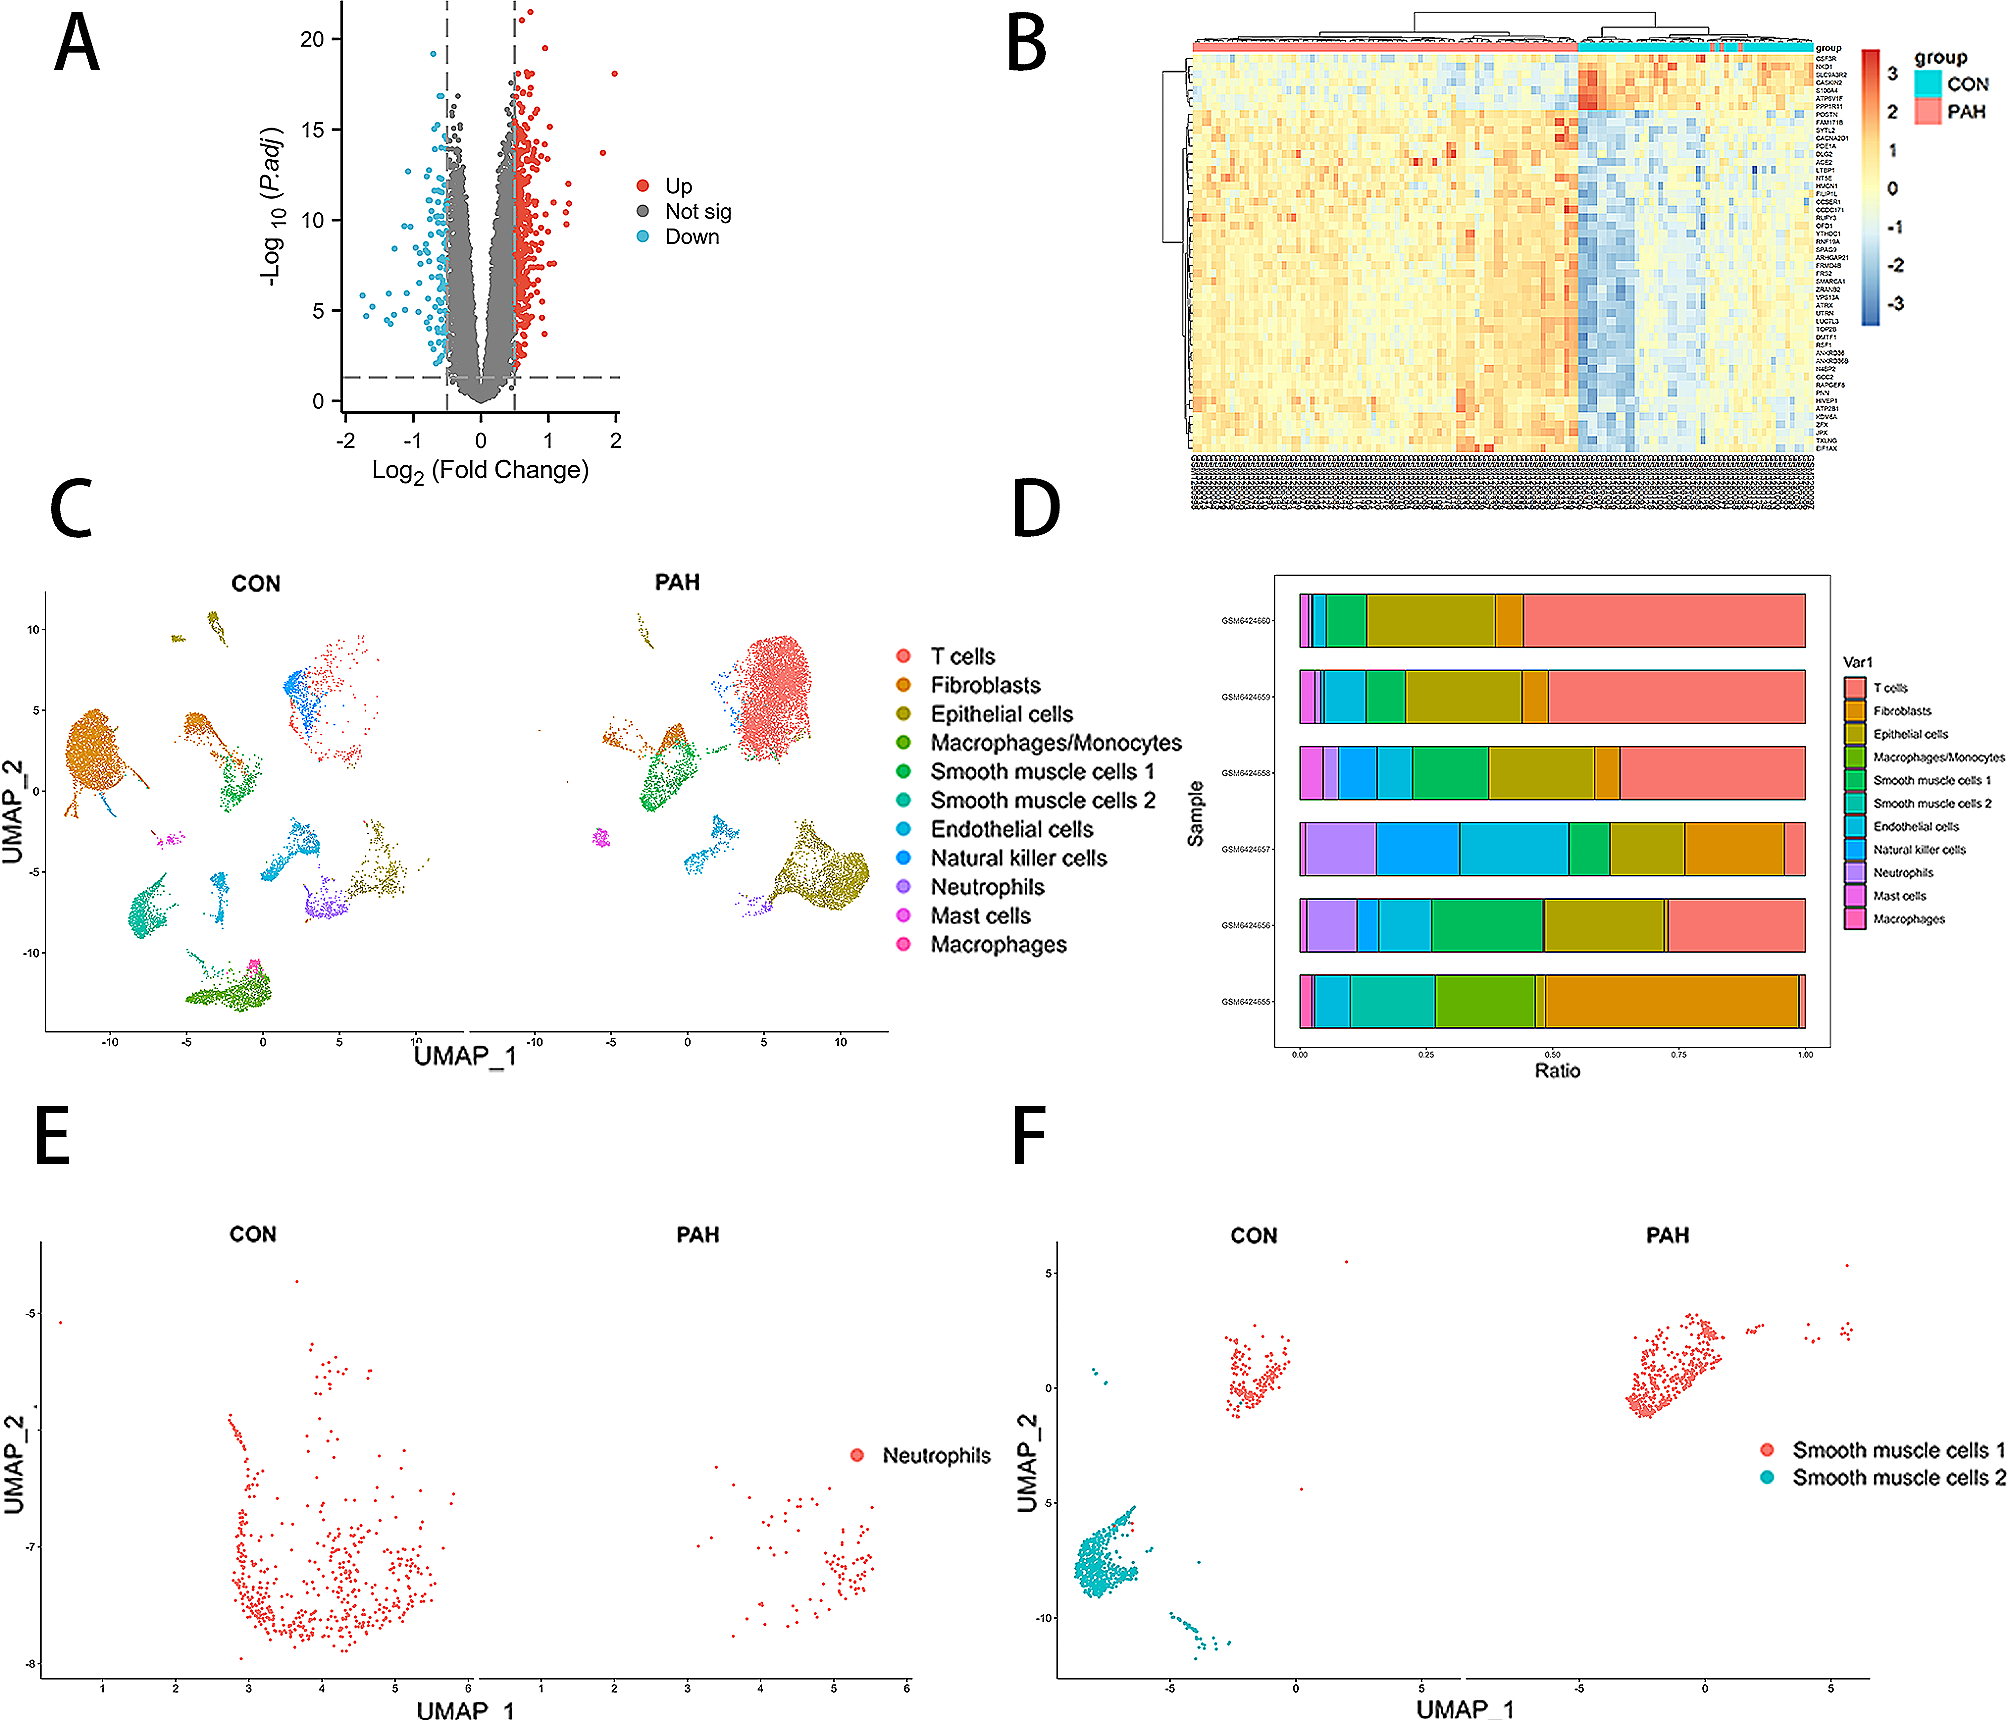
This study demonstrates a noteworthy reduction in diaphragmatic pillar thickness at the level of L1 and the celiac artery in the majority of cases, except for right weaknesses. Additionally, CT examination revealed a significant increase in diaphragmatic cupola height differences, regardless of the side or type (paralysis or weakness) of DD.
The absence of diaphragmatic pillar thinning in right-sided diaphragmatic weakness may be attributed to various factors. Among the 7 patients with right-sided diaphragmatic weakness, only 4 exhibited severe weakness, defined as greater muscle dysfunction with less than 40% of maximal thickening on ultrasound, whereas all weaknesses observed on the left were severe. Indeed, the mean thickening fraction in the case of weakness was 40% on the right, compared to 31% on the left. Additionally, the right diaphragmatic pillar is inherently stronger, thicker, and longer than the left pillar [10, 19]. It can be hypothesized that the right pillar that the change in the right pillar is less pronounced in the presence of simple diaphragmatic weakness.
Regarding diagnostic thresholds for diaphragmatic pillars thickness on CT, for right-sided diaphragmatic paralysis, ROC analysis identified a threshold of 3.0 mm at the level of the celiac artery and a threshold of 4.5 mm at the level of L1, both demonstrating good diagnostic performances [20]. Both thresholds exhibited good sensitivity, specificity, and PPV. Notably, the pillar measurement at the L1 level showed higher sensitivity and a higher AUC, with a significantly higher NPV. Therefore, for diagnosing right diaphragmatic paralysis, the pillar measurement at the L1 level appears to be more relevant than at the celiac artery level. For left paralysis, ROC analysis determined a threshold of 2.6 mm for the diaphragmatic pillar at the level of the celiac artery. This threshold remained identical for the left diaphragmatic weaknesses, as no significant difference in pillar thickness was found between the paralysis and weakness groups at this level. Moreover, at the L1 level, weakness can be differentiated from left diaphragmatic paralysis. The threshold for paralysis at L1 was 3.8 mm, exhibiting good diagnostic performance. For left diaphragmatic weakness, ROC analysis established a threshold of 5.0 mm at the L1 level with excellent diagnostic performance (specificity 100% and PPV 100%), ensuring a certain diagnosis of left diaphragmatic weakness if the thickness falls below the threshold.
The study conducted by Sukkasem et al. identified a threshold of 2.5 mm for diagnosing diaphragmatic paralysis on both the right and left sides, at the level of the celiac artery and L1 [10]. It's important to note that in their study, diaphragmatic pillar thickness was measured in patients with diaphragmatic paralysis compared to those with normal diaphragmatic function, and diaphragmatic function was assessed using fluoroscopy as the gold standard. Comparing the results of these two studies is challenging due to the use of different gold standards. Additionally, our study found larger right crus in the context of right weakness compared to controls and data reported by Sukkasem et al. It's suggested that ultrasound may be more sensitive than fluroroscopy and could potentially differentiate weakness from paralysis more precisely. A postulation is made that weakness might have a distinct pathophysiology compared to paralysis. Weakness may be associated with a loss of function without significant structural changes, resulting in muscle relaxation and thickening as fibers overlap.
In the DD group, the contralateral diaphragm exhibited compensation through an increase in amplitude during QB and VS in both right and left DD as observed in ultrasound. This increase in the amplitude of the healthy contralateral diaphragm has been previously documented as a neuronal compensation mechanism for the function of the contralateral hemi diaphragm in paralysis [12, 21, 22]. However, it is noteworthy that there was no evidence of hypertrophy in either the right or left healthy diaphragmatic pillar. Furthermore, CT scans revealed thinner pillars at the L1 level on the healthy side of patients with DD compared to controls (p = 0.01 on the right and p = 0.09 on the left), likely attributable to overall muscle weakness.
In the case of right diaphragmatic paralysis or weakness, ROC curve analysis determined a threshold of height difference between the two domes of 4.4 cm and 3.5 cm respectively, with perfect diagnostic performances of 100% [20]. This implies that the diagnosis of right diaphragmatic paralysis or weakness is certain if the height exceeds the respective threshold. For left DD, diagnostic performances were good for paralysis but not for weakness, with close values of height difference between the two domes (2.7 cm and 2.5 cm, respectively). Therefore, in our study, the height difference between the domes emerges as the most reliable CT measurement for diagnosing DD, potentially because diaphragm function may be compromised even in the absence of structural changes such as muscle atrophy. Notably, this study represents the first instance of precise threshold values for the diagnosis of DD based on the difference in cupola height being reported.
DD is typically linked to a modest reduction in vital capacity, around 75%, while TLC is generally maintained [23]. The more pronounced decrease in volumes observed in the weakness group in this study may be attributed to factors other than DD itself. Among the 12 patients exhibiting a restrictive pattern in the weakness group, several had conditions potentially influencing lung function. This includes 6 patients with a history of COVID-19 (5 of whom experienced severe diseases requiring intensive care), one patient with a history of talc pleurisy, 2 patients who were overweight, and 6 patients who were moderately obese.
This work is subject to several limitations. First, CT has certain drawbacks in comparison to ultrasound, including impracticality at the bedside, higher cost, and exposure to radiation. Nevertheless, CT is routinely employed in clinical practice, particularly in the assessment of dyspnea. Despite its inherent disadvantages relative to ultrasound, CT is almost systematically utilized in the evaluation of diaphragm dysfunction due to its widespread availability and comprehensive lung imaging capabilities.
Second, it is acknowledged that pillar thickness is expected to vary with breathing, decreasing with expiration [24]. In this study, only one radiologist conducted the measurements, and the intra- and inter-reproducibility of these measurements were not assessed). Additionally, both enhanced and unenhanced CT scans were utilized, which could pose challenges in measuring the pillar thickness in unenhanced CT. If the scan is performed during expiration, there is a risk of mistakenly assuming DD. Moreover, in our study, to ensure correct inspiration during thoracic scans, we verified that the posterior part of the trachea did not inwardly bulge. Howevern this check could not be performed for the single abdominal scan included in our study.
Third, CT were conducted during the inspiratory phase, while ultrasound examinations were performed during the expiratory phase. Despite the disparate conditions associated with these two imaging modalities, both methods were systematically executed within identical respiratory phase. However, it is important to acknowledge that this difference in respiratory phases could introduce variability in the measurements and should be considered when interpreting the results. The observed correlations between measurements indicate a degree of association despite the differences in imaging timing, but this discrepancy should be kept in mind when extrapolating findings from one modality to the other.
Fourth, the scans were performed at different times, either before or after the ultrasound, with most instances occurring before ultrasound (median time between CT and ultrasound was -20 days in DD). Since the structure of the diaphragm can change during illness, the time gap between the two examinations may differently affect pillar atrophy. However, both imaging modalities were performed after the appearance of DD. The exam conducted later in the course of DD may be influenced by a recovery process, potentially attenuating the correlation between measurements. Given that ultrasound is considered the gold standard in this study, if CT was performed before ultrasound, diaphragm measurements on CT would be reliably reflective of the DD condition. However, if performed after ultrasound, CT measurements might be underestimated due to the ongoing recovery process.
Fifth, it is important to note that there were more women in the paralysis group than in the weakness group (p < 0.001). It can be assumed that diaphragmatic pillars are thinner in women, as seen in ultrasound. However, it is worth mentioning that in the study by Dovgan et al. [25], pillar thickness did not vary according to gender. This inconsistency highlights the potential impact of gender distribution on the results and emphasizes the need for further investigation and clarification regarding the relationship between gender and diaphragmatic pillar thickness.


留言 (0)