
記住我

A total of 1203 patients were included in the study, and males accounted for 52%. The mean age was 55 ± 17 years, and age > 65 accounted for 36%. MPA, GPA, and EGPA accounted for 50.0%, 29.7%, and 15.8%, respectively. Among all the patients, 136 patients (11.3%) acquired thrombosis, with VTE (10.3%), ATE (0.93%), DVT (8.5%), and PE (1.8%). AAV patients with thrombosis had a higher percentage of elderly patients (60 ± 14 vs. 54 ± 17 years, P < 0.001), more smoking (37.5% vs. 31%, P = 0.003) and more chronic kidney disease (CKD, 22.8 vs. 15.6%, P = 0.032). AAV patients with thrombosis had hypoalbuminemia (33.3% vs. 24.8%, P = 0.035), renal impairment with more proportion of elevated serum creatinine (Scr > 500µmol/L, 18.2% vs. 7.3%, P < 0.001) and elevated D-dimer (3.0 vs. 1.2 mg/L, P < 0.001). There was no statistical difference in the levels of ANCA, inflammatory indicators (CRP and ESR), and complements. The complications were more evident in patients with thrombosis, including a higher percentage of infection (36% vs. 25.7%, P = 0.010) and anemia (41.2% vs. 30.4%, P = 0.011). After immunosuppressive treatments, the all-cause death rates were of no statistical differences during in-hospital, but AAV with thrombosis with prolonged hospitalization (29.6 ± 17.1 vs. 22.6 ± 13.2 days, P < 0.001). (Table 1)
Table 1 Baseline clinical characteristics of patients with or without thrombotic events in AAV patientsMPA, GPA, and EGPA thrombosis were 10.5%, 8.7%, and 19.5% (P = 0.003). The clinical characteristics and the thrombosis rate in different AAV classifications were described in sTable 1–4. All MPA, GPA, and EGPA patients with thrombosis were older, acquired elevated D-dimer, and had prolonged hospitalization. MPA patients with thrombosis acquired worse renal function with more CKD, ESRD, elevated Scr, and more anemia. GPA patients with thrombosis had more neurological involvement and infection. EGPA patients with thrombosis had more lung involvement and ESRD. EGPA had the highest rates of VTE (18.9%) and ATE (2.1%) among the three AAV (P = 0.026), as well as the highest rates of DVT (EGPA 16.8%, P < 0.001) and PE (5.3%, P = 0.004), without relationship to the levels of ANCA.
Risk factors of thrombosis in AAV patientsUnivariate regression suggested that age > 65, neurological or lung involvement, ESRD, and elevated D-dimer were associated with thrombosis (P < 0.05, Table 2). Multivariate regression suggested that age > 65 years (OR = 1.65 (1.10–2.47), P = 0.015), EGPA (OR = 3.50 (2.11–5.81), P < 0.001), neurological involvement (OR = 2.05 (1.30–3.24), P = 0.002), lung involvement (OR = 1.90 (1.24–2.90), P = 0.003), significantly elevated serum creatinine (Scr > 500µmol/L, OR = 2.78 (1.52–5.09), P = 0.001), and elevated D-dimer (0.55-2 mg/L, OR = 2.80 (1.41–5.56), P = 0.003; >2 mg/L, OR = 6.28 (3.20–11.93), P < 0.001), were independent risk factor of thrombosis in AAV patients.
Table 2 Univariate and multivariate regression analysis of thrombosis events in AAV patientsThe nomogram and its predictive valueOlder than 65 years, neurological and lung involvement, significantly elevated serum creatinine, and elevated D-dimer were included in the nomogram based on the multivariate analysis (Fig. 3). The AUC for the nomogram was 0.769 (95% CI, 0.726–0.812) (Fig. 4). The calibration plot showed a good fitting degree of the nomogram (sFigure 1). The HL test of multivariable analysis also demonstrated perfect consistency (χ2 = 6.9631, P = 0.5406). As for clinical practice, DCA for the nomogram was conducted, and it showed a more significant net benefit than full or no treatment across a threshold probability range (sFigure 2).
Fig. 3
The nomogram of predicting the thrombotic events in AAV patients. *AAV, ANCA-associated vasculitis; Age_65, age > 65 years; EGPA, eosinophilic granulomatosis with polyangiitis
Fig. 4
The receiver operating characteristic (ROC) curve of thrombosis events in AAV patients. *AAV, ANCA-associated vasculitis
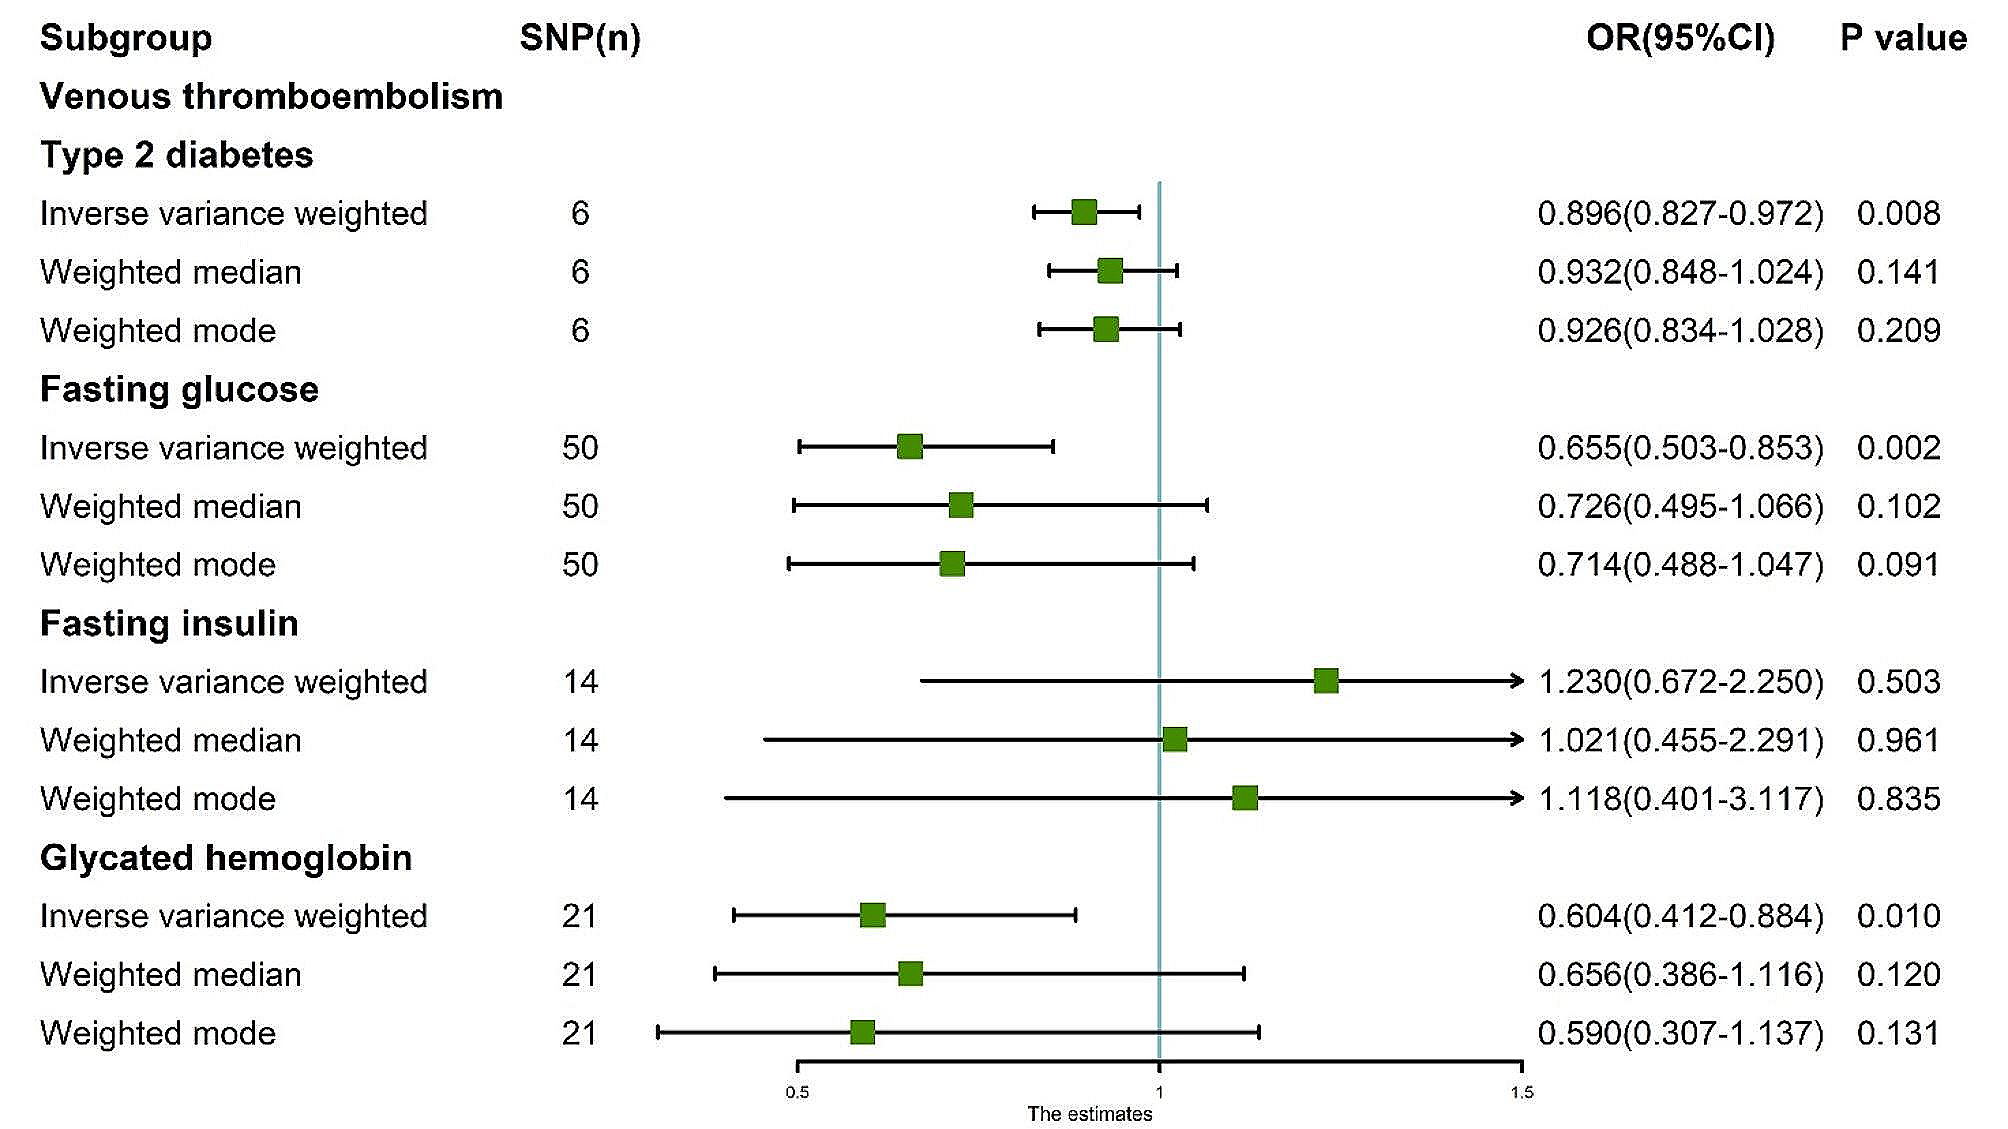
MR analysisThe scatter plot showed the distribution of the single SNP’s effect on the outcome (Fig. 5a). The P-values of heterogeneity and pleiotropy test were 0.74 and 0.69, indicating low heterogeneity and no evidence of genetic pleiotropy. The leave-one-out method suggested that the outcome was robust. MR analysis showed that EGPA could increase the risk of developing thrombosis, including DVT and PE (OR = 1.0038, 95%CI = 1.0035–1.0041, P = 0.009; Fig. 5b). To analyze the association between MPA or GPA and thrombosis, we extracted the MPA dataset from finngen_R8_M13_MICROPOLYANG, and the GPA dataset from finngen_R8_M13_WEGNER. No statistical significance of the relationship between MPA or GPA and thrombosis (P = 0.79; P = 0.83) was observed by the IVW method.
Fig. 5
5a. Scatter plot of the Mendelian randomized (MR) outcome. 5b. The associations between EGPA and thrombotic events. *EPGA, eosinophilic granulomatosis with polyangiitis; DVT, deep venous thrombosis; PE, pulmonary embolism; IVW, Inverse variance weighted; WM, weighted median
留言 (0)