Isolation and identification of rat BMSCs
After euthanasia, the tibias and femurs of the rats were immersed in 75% ethanol for 5 min, after which they were separated, and any muscle tissues adhering to the long bones were removed [25]. The diaphysis of both the tibia and femur was then cut open, and cells from the ends of these long bones were aseptically transferred into a pre-chilled 50 mL centrifuge tube containing a complete culture medium (comprising MSC culture medium supplemented with antibiotics and 10% FBS). The bone marrow cell suspension was obtained by centrifugation at 1500 rpm for 5 min and added into a complete culture medium comprising MSC culture medium (AW-MC036, Abiowell, China), 10% FBS (10,099,141, Gibco, USA) and antibiotics (ST488, Beyotime, China), with the entire process maintained under aseptic conditions. Cellular morphological analysis was conducted by observing and capturing images of the cells using a microscope (DSZ2000X, Cnmicro, China).
Cell culture and grouping
Following the isolation of BMSCs in the previous step, the cells were cultured in a complete MSC culture medium, placed in a cell culture incubator maintained at 37 °C with 5% CO2, and categorized into five groups: Control, si-NC, si-p75NTR, oe-NC, and oe-p75NTR. In the Control group, BMSCs were cultured under standard conditions; in the si-NC group, BMSCs were transfected with si-NC plasmid, while in the si-p75NTR group, BMSCs were transfected with si-p75NTR plasmid. In the oe-NC group, the BMSCs were transfected with the oe-NC plasmid, and in the oe-p75NTR group, BMSCs were transfected with the oe-p75NTR plasmid. These cell groups were then cultured for 24, 48, and 72 h. Additionally, BMSCs were co-cultured with human umbilical vein endothelial cells (HUVECs) and divided into four groups: Control, si-NC, si-p75NTR, and si-p75NTR + rr-sortilin. In the Control group, the cells were cultured under standard conditions; in the si-NC group, the cells were transfected with si-NC plasmid, and in the si-p75NTR group, the cells were transfected with si-p75NTR plasmid. In the si-p75NTR + rr-sortilin group, the cells were transfected with si-p75NTR plasmid and treated with recombinant rat sortilin (rr-sortilin) protein.
Cell transfection
Eight centrifuge tubes were used, to which 95 µL of MSC basal culture medium was added. Separately, the si-NC, si-p75NTR, oe-NC, and oe-p75NTR plasmids, along with Lipofectamine 2000 (11,668,500, Invitrogen, USA), were mixed with MSC culture medium and incubated at room temperature for 5 min. The two tubes corresponding to each plasmid were combined and incubated at room temperature for 20 min. The resultant pre-mixture was evenly distributed into the transfection wells, followed by adding 800 µL of MSC basal culture medium. The cells were then incubated at 37 °C for 6 h, after which the complete culture medium was replaced. The si-NC, si-p75NTR (HG-Ri0072564), oe-NC, and oe-p75NTR plasmids were purchased from HonorGene (HG-RO0072566, China).
Cell counting kit-8 (CCK-8) assay
The cells were seeded in a plate at a density of 5 × 10³ cells/well and allowed to adhere to the plate. After removing the culture medium, 100 µL/well of prepared CCK-8 medium, consisting of 10% CCK-8 reagent (NU679, Abiowell, China) and 90% complete culture medium, was added and incubated at 37 °C with 5% CO2. Lastly, the plates were placed in a microplate reader (MB-530, HEALES, China) to measure the optical density (OD) value at 450 nm.
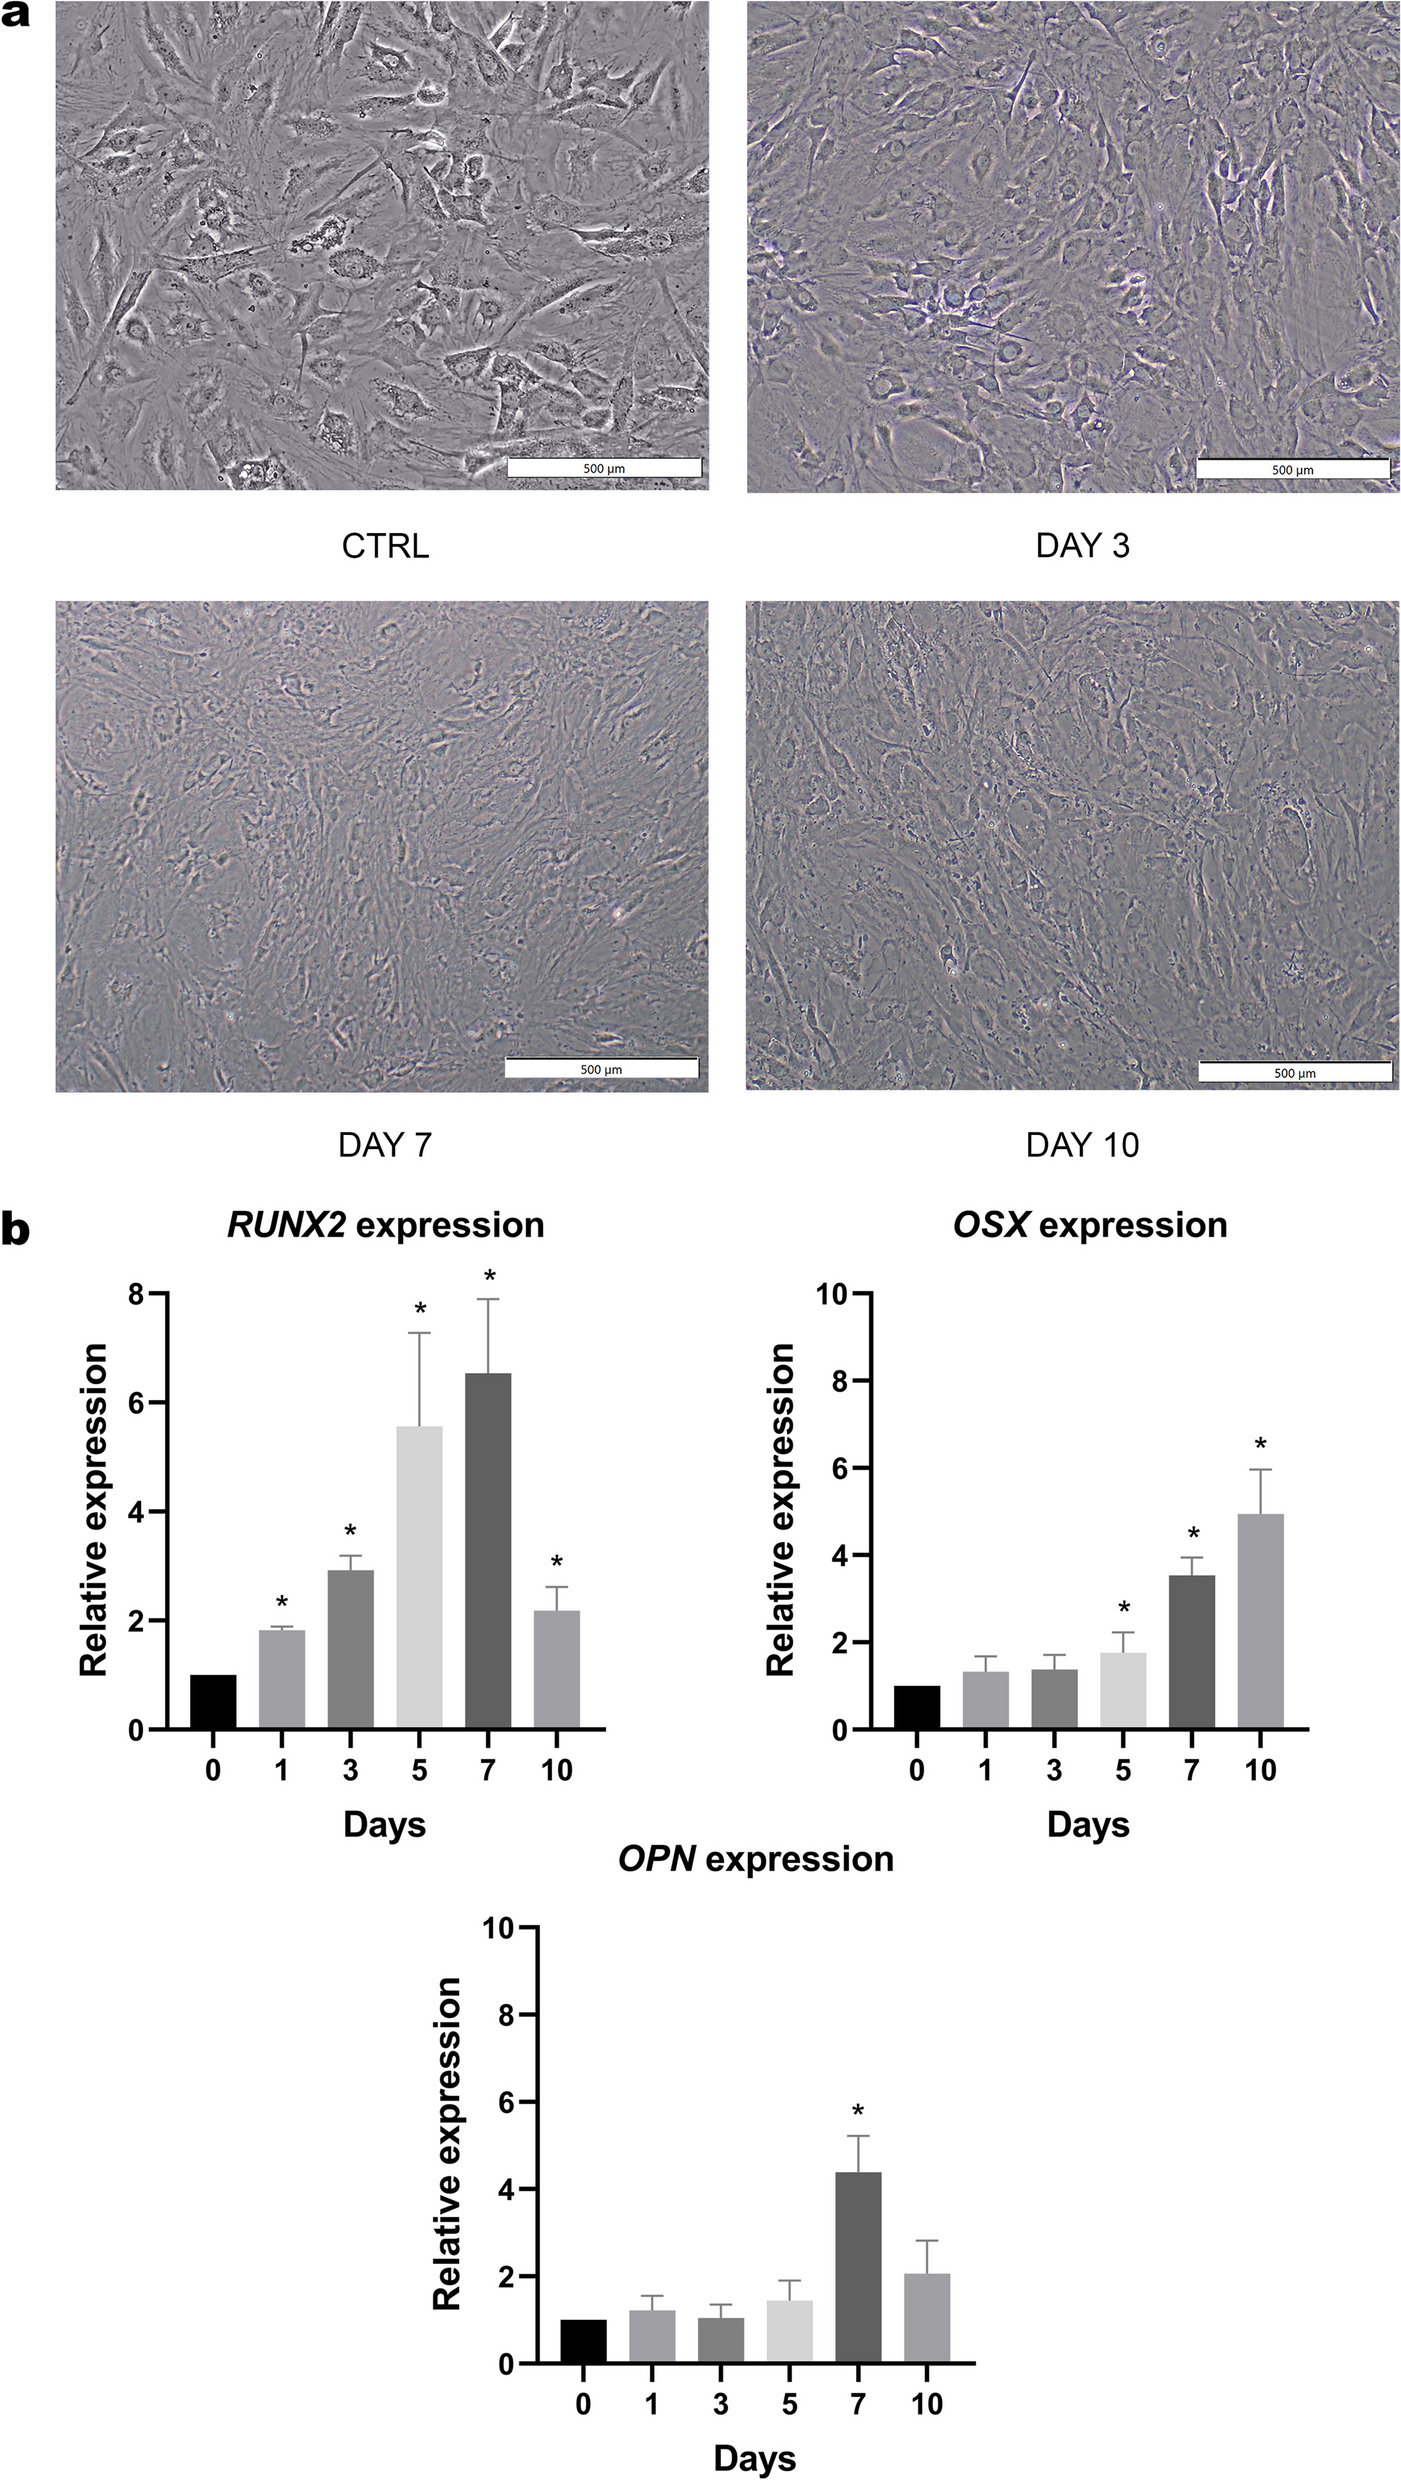
Osteogenic induction of BMSCs
A 6-well plate was prepared by adding 1 mL of 0.1% gelatin, mixing well, and allowing it to dry. After gelatin coating, BMSCs were seeded into each well, and 2 mL of complete culture medium was added per well. The plate was subsequently incubated in a cell culture incubator. After removing the culture medium, 2 mL of Rat BMSCs Osteogenic Differentiation medium (RAXMX-90,021, Cyagen, China) was added to each well, and the medium was replaced at 3-day intervals as part of the osteogenic induction process.
Alizarin red staining (ARS)
The assessment of BMSCs’ osteogenic differentiation was performed using ARS staining. After 2–4 weeks of induction, the culture medium was aspirated, and the cells were washed with phosphate buffer saline (PBS). Then, the cells were fixed with a 4% paraformaldehyde solution (AWI0056b, Abiowell, China) and rinsed with ultrapure water. Next, 1 mL of 0.2% ARS solution (AWI0292a, Abiowell, China) was added to each well, and the plate was gently shaken on a shaker to facilitate staining. Lastly, the cells were examined and captured under a microscope (DSZ2000X, Cnmicro, China) for observation and photography purposes.
Adipogenic induction of BMSCs
The cells were seeded onto plates pre-coated with 0.1% gelatin and cultured in 2 mL of complete culture medium per well. The culture medium was then replaced with 2 mL of Rat Bone Marrow Mesenchymal Stem Cell Adipogenic Induction Differentiation Medium A (RAXMX-90,031, Cyagen, China) for each well. After three days, Medium A was discarded and replaced with an equal volume of Medium B, which was removed after one day, and subsequently, Medium A and Medium B were alternated in the subsequent culture process.
Oil Red O staining
Here, Oil Red O staining was performed to evaluate the adipogenic differentiation of BMSCs. After 16 days of inducing adipogenesis, the culture medium was aspirated, the cells were rinsed with PBS, fixed using a 4% paraformaldehyde solution, and stained with a pre-prepared Oil Red O working solution (G1262, Solarbio, China) at room temperature. After staining, the cells were washed with PBS to remove any excess staining solution. Lastly, each well was filled with PBS, and the plate was examined under a microscope (DSZ2000X, Cnmicro, China) to assess the effectiveness of adipogenic staining.
Cell cycle analysis
Flow cytometry (FCM) was performed to assess the cell cycle. Initially, the collected BMSCs and HUVECs were resuspended separately in PBS to separate them into individual cells, which were then fixed with ethanol and subsequently washed with PBS to eliminate residual ethanol. PI working solution (MB2920, MeilunBio, China) was then added to the cells and stained in the dark at 4 °C. Lastly, a flow cytometer (A00-1102, Beckman, USA) was used for cell cycle analysis.
Apoptosis detection in BMSCs
Cell apoptosis analysis was conducted using FCM. Briefly, BMSCs were harvested and prepared for apoptosis detection by trypsin digestion without ethylenediaminetetraacetic acid (EDTA). The cells were washed with PBS, and the supernatant was removed after centrifugation. Next, the cells were resuspended in 500 µL of Binding buffer (KGA1030, KeyGene BioTECH, China), 5 µL of Annexin V-APC was added, and the mixture was gently combined. Following this, PI was added to the cell suspension, and the entire reaction was conducted away from light. Within 1 h, FCM was performed to analyze cell apoptosis.
Surface marker identification of BMSCs
The digested BMSCs were centrifuged, and the supernatant was discarded. The cell pellet was then resuspended in 100 µL of basal culture medium and thoroughly mixed with specific antibodies (Table 1). The mixture was incubated at room temperature away from light for 30 min, following which, the cells were washed with 1 mL of 0.5% BSA-PBS solution and centrifuged for 5 min to remove the supernatant. The cell pellet was resuspended in 150 µL of 0.5% BSA-PBS and analyzed using FCM. The specific antibodies used in the study are shown in Table 1.
Table 1 The information on antibodyConstruction of rat fracture healing model
Male SD rats (age: 5–6 weeks; weight: 200–250 g) were purchased from SJA Laboratory Animal Co., Ltd (Hunan, China). After a week of acclimation feeding, subsequent experiments were performed. To establish a rat model for bone healing, the rats were initially anesthetized via intraperitoneal injection with 40 mg/kg of pentobarbital sodium. Then, a 1.2 mm diameter bone defect was created at the midshaft of the bilateral femurs, ensuring that the defect penetrated the cortex into the marrow cavity without perforating the opposite cortex [26]. A total of 18 rats were randomly allocated into three groups (n = 6): Model group, Model + BMSCs-si-NC group, and Model + BMSCs-si-p75NTR group. Rats in the Model group received an intravenous injection of 0.2 mL of normal saline, those in the Model + BMSCs-si-NC group were administered a tail vein injection of 0.2 mL normal saline containing 106 BMSCs transfected with si-NC plasmid, and those in the Model + BMSCs-si-p75NTR group received a tail vein injection of 0.2 mL normal saline containing 106 BMSCs transfected with si-p75NTR plasmid [13]. These injections were administered every other day. Two weeks post-surgery, the rats were euthanized, and samples were collected for subsequent analysis. All experimental procedures and animal handling were performed with the approval of the Biomedical Research Ethics Committee of Shaoyang University (No. 2021KJKT023), in accordance with the National Institutes of Health Guide for the Care and Use of Laboratory Animals, and studies involving laboratory animals follows the ARRIVE guidelines.
Western blot (WB)
The cells and tissues were treated using a Radio Immunoprecipitation Assay (RIPA) lysis buffer (AWB0136, Abiowell, China) following the recommended instructions, and the protein concentration was determined using a Bicinchoninic Acid (BCA) assay kit (AWB0104, Abiowell, China). Subsequently, the protein was transferred onto nitrocellulose (NC) membranes (Invitrogen, USA) through electrophoresis and electroblotting, then immersed in a 5% skimmed milk solution prepared with 1×PBST and gently agitated for 90 min for blocking. Next, the membranes were incubated overnight with the primary antibody and thoroughly washed with PBST. Subsequently, the membranes were incubated with the secondary antibody (HRP goat anti-mouse IgG (H + L) and HRP goat anti-rabbit IgG (H + L)). Lastly, the membranes were treated with enhanced chemiluminescence (ECL) Plus detection reagent (AWB0650, Abiowell, China) and visualized using a chemiluminescence imaging system (ChemiScope6100, Clinx Science, China). The internal control gene used in this study was β-actin, and details regarding the primary and secondary antibodies utilized are provided in Table 2.
Table 2 The information on antibodyCo-immunoprecipitation (CO-IP)
BMSCs were lysed using IP lysis buffer (AWB0144, Abiowell, China), and the protein-containing supernatant was collected post-centrifugation. The protein extract was allocated into four separate tubes, to which specific antibodies were added: anti-p75NTR (55014-1-AP, 1:1000, Proteintech), anti-sortilin (12369-1-AP, 1:8000, Proteintech), or anti-rabbit IgG (SA00001-2, 1:6000, Proteintech), according to the experimental requirements. After thorough mixing, the mixtures were incubated overnight. The antibody-protein complexes were then combined with pre-treated Protein A/G agarose beads and incubated with gentle agitation at 4℃ for 2 h, followed by centrifugation. The beads, which have bonded with the antibody-protein complexes, were retained, and the supernatant was discarded after washing the beads four times with IP lysis buffer. Lastly, IP lysis buffer and 5× loading buffer were added to the bead-bound complexes, which were then mixed, denatured, and prepared for subsequent protein quantification analysis.
Real-time quantitative polymerase chain reaction (RT-qPCR)
Total RNA extraction from BMSCs was performed using Trizol (15,596,026, Thermo, America), and cDNA was synthesized using the mRNA Reverse Transcription Kit (CW2569, CowinBio, China). Primers for the target genes were designed and synthesized by Tsingke (Beijing, China). The specific amplification was conducted using the SYBR method on a fluorescence qPCR instrument (SPL0960, Thermo, USA). β-actin was used as the internal reference, and the relative gene expression levels were calculated utilizing the 2−ΔΔCt method. The primer sequences utilized are shown in Table 3.
Immunofluorescence (IF)
The expression of p75NTR and sortilin proteins in differentiated osteoblasts was assessed through IF. BMSCs were cultured on glass coverslips, fixed using 4% paraformaldehyde, and permeabilized with 0.3% Triton X-100 at 37 °C. After rinsing with PBS, a blocking step was performed using 5% BSA. The coverslips were then incubated overnight with the p75NTR antibody (AWA01539, 1:200, Abiowell) and sortilin antibody (12369-1-AP, 1:50, Proteintech). Then, the slides were incubated with Alexa Fluor 594-conjugated Goat Anti-Rabbit IgG(H + L) antibody (1:200, AWS0006c, Abiowell) and Alexa Fluor 488-conjugated Goat Anti-Mouse IgG(H + L) antibody (1:200, AWS0003c, Abiowell) for 90 min at 37℃. Nuclear staining was conducted using a DAPI working solution (C1005, Beyotime, China). Lastly, the slides were sealed with a glycerol buffer and observed using a fluorescence microscope (BA410T, Motic, Singapore).
5-Ethynyl-2’-deoxyuridine (EdU)
To assess the proliferation of HUVECs, 50 µM EDU medium (C10310, RiboBio, China) was added to each well and incubated overnight. After fixation with 4% polyformaldehyde, 50 µL of 2 mg/mL glycine solution was used. Subsequently, the cells were treated with 1× Apollo staining reaction solution and incubated in the dark. Following this, a permeabilization agent and methanol were introduced to the cells and then washed. Each well was treated with 1× Hoechst 33,342 reaction solution and incubated in the dark. Lastly, images were captured using a fluorescence microscope (BA410T, Motic, China).
Wound healing assay
The cells were seeded into a 6-well plate. A sterile pipette tip was used to generate a scratch at the center of each well, which was then washed with PBS three times and supplemented with serum-free DMEM/F12 medium. Photographs were captured at 0, 24, and 48 h after the scratch using a microscope (DSZ2000X, Cnmicro, China) in at least three distinct fields of view to assess the migration capacity of HUVECs.
Statistical analysis
In this experiment, statistical analysis was performed using GraphPad Prism 9.0, and the data are presented as mean ± standard deviation (SD). Tests for normal distribution and homogeneity of variances were conducted, and data that satisfied both of these tests were further compared. For comparisons among multiple groups, a one-way ANOVA followed by Tukey’s post hoc test was performed. A two-way ANOVA was utilized for comparisons involving different time points and multiple groups. P < 0.05 was considered statistically significant.


留言 (0)