
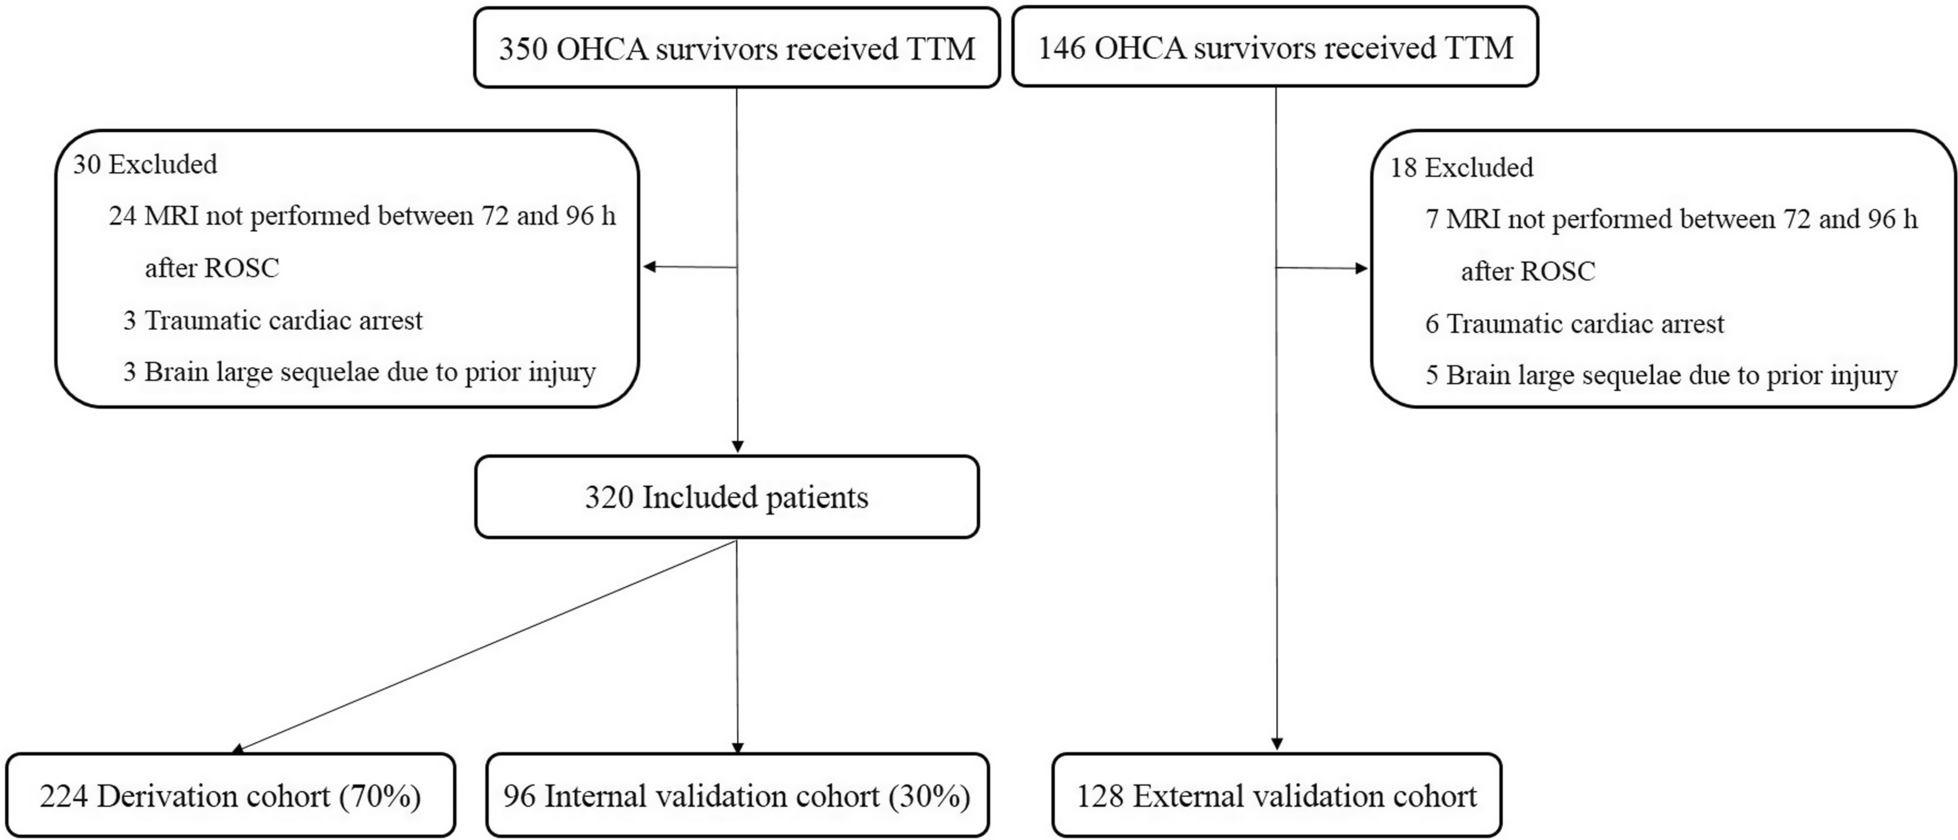
記住我


We determined the percentage of MS1 cells in 332 patients diagnosed with sepsis and stratified these into tertiles based on their relative abundance of MS1 cells: low, intermediate, and high (Additional file 1: Fig. S1; Table 1). The range of the MS1 cell proportions aligned with findings in prior studies [7, 8]. MS1 groups were largely similar regarding demographics, chronic comorbidities, and site of infection, although the proportion of abdominal infections was higher in the intermediate and high MS1 groups, as compared with the low MS1 group. These groups also presented with a higher disease severity upon ICU admission, as indicated by higher sequential organ failure assessment (SOFA) scores, Acute Physiology and Chronic Health Evaluation (APACHE) IV scores, and Acute Physiology Scores (APS), as well as higher frequencies of acute kidney injury (AKI) and shock. Length of ICU or hospital stay did not differ between MS1 groups.
Table 1 Baseline characteristics and outcomes of patients admitted to the ICU with sepsis stratified into tertiles by percentage of MS1 cellsInterestingly, patients with abdominal infections in our cohort presented higher disease severity upon ICU admission, as indicated by higher SOFA scores, and increased frequencies of AKI and shock compared to patients with respiratory infections (Additional file 1: Table S1). In a sensitivity analysis, adjusting for disease severity on admission (SOFA, APACHE IV APS score, shock, ARDS, and AKI) in a logistic regression model, the proportion of MS1 cells did not differ anymore between patients with abdominal and respiratory infections (adjusted p value = 0.31). Additionally, we directly compared patients with abdominal infections and shock to those with respiratory infections and shock. This comparison showed no statistically significant differences in MS1 cell percentages or severity scores (Additional file 1: Table S2), suggesting that the severity of the disease, rather than the infection source, predominantly impacts MS1 cell proportions.
No overall differences were observed in the proportion of surviving patients between the three MS1 groups (log-rank, p = 0.43) (Additional file 1: Fig. S2A). Mortality rates showed a nonlinear relationship with MS1 cell percentages (Additional file 1: Fig. S2B); according to this model the increase in MS1 levels did not have a significant impact on the probability of the 30-day mortality event (p = 0.13).
The intermediate and high MS1 groups more frequently developed ARDS while in the ICU. The frequency of secondary ICU-acquired infections was comparable between MS1 groups. We also assessed the risk of ICU-acquired infections with the cumulative incidence function. Patients classified in the high MS1 group exhibited the highest cumulative incidence of ICU-acquired infections; however, no overall differences between MS1 groups were observed (Gray's Test, p = 0.2) (Additional file 1: Fig. S3).
To test the robustness of our results, we attempted to stratify the cohort using a different methodology. This involved conducting a sensitivity analysis using one-dimensional k-means clustering based on MS1 cell percentages. The optimal number of clusters was determined to be 2 clusters, supported by 11 out of 28 methods (Additional file 1: Table S3). This analysis yielded results similar to those observed in the comparison of MS1 cell tertiles, with the group of patients classified as cluster 2 (high MS1 cell abundance) showing a higher incidence of sepsis due to abdominal infections, higher disease severity upon ICU admission, and a more frequent development of ARDS while in the ICU (Additional file 1: Table S4).
Weighted gene co-expression network analysisTo obtain a first insight into differences in the blood transcriptomes across patients with different MS1 cell abundances, we determined the number of differentially expressed genes between the three MS1 groups in pair-wise comparisons (Additional file 1: Fig. S4). The low MS1 group was clearly distinct from the intermediate and high MS1 groups.
To investigate subgroup-specific transcriptional regulation in sepsis patients based on the percentage of MS1 cells, we conducted a comprehensive gene co-expression network analysis followed by an unbiased overrepresentation analysis. This analysis revealed nine gene expression modules, of which four modules (Fig. 1A) were significantly different between the three groups (by Kruskal–Wallis test comparing the modules’ eigengene) and overrepresented with distinct biological pathways (Additional file 1: Table S5). Modules 1 and 2 exhibited increased normalized enrichment scores (NES) in the low MS1 group. Module 1 demonstrated significant enrichment in pathways related to the adaptive immune system, while Module 2 displayed enrichments primarily linked to interferon signaling. On the other hand, Modules 3 and 4, which showed elevated NES in the intermediate and high MS1 groups, were associated with inflammatory response and tumor necrosis factor (TNF) signaling via nuclear factor-κB, as well as with neutrophil degranulation, respectively (Fig. 1A). To identify potential key regulatory genes governing these pathways, we focused on the central hub genes within each module (most connected genes). In the network of Module 1, several lymphocyte-related genes emerged as hubs, including IL23A, TCF7, SKAP1, IMPDH2, and NFATC2 (Fig. 1B). In the network of Module 3, hub genes of interest comprised CD163, CD59, IL1RAP, JMJD6, LDHA, HK3, and GYG1.
Fig. 1
Co-expressed gene modules and gene set enrichment analysis in patients with sepsis stratified according to MS1 cell percentages in blood. A The co-expression module identification analysis revealed distinct gene modules based on MS1 cell levels in patients with sepsis. Patients were categorized into low MS1 (n = 111), intermediate MS1 (n = 111), and high MS1 groups (n = 110). The size of each circle in the graph is proportional to − log10(BH adjusted p value), and the color represents the normalized enrichment score (NES). Blue indicates a decreased NES, and red color represents an increased NES. B The network diagrams depict the two largest differential co-expression gene modules (Module 2 and Module 3) identified in the analysis; the network highlights the hub genes, which are crucial regulatory genes within each module, C The graph illustrates the correlation between the percentage of MS1 cells and the normalized gene expression matrix. Positive correlations with a BH adjusted p value < 0.05 are shown in red, negative correlations in blue; and non-significant correlations are depicted in gray. Gene names indicate the top five positively correlated (in red) and the top five negatively correlated (in blue) genes. D Gene set enrichment analysis performed on genes that correlated with MS1 levels. The color-coded NES values signify the enrichment score for each pathway; all pathways displayed a BH adjusted p value < 0.05, except for pathways marked by an asterisk (*), which indicates a BH adjusted p value < 0.1
Next, we utilized the proportion of MS1 cells on a continuous scale and performed a functional enrichment analysis based on the correlation value (rho) with the genes in the normalized expression matrix. These results corroborated the findings observed in the module analysis (Fig. 1C). Moreover, this analysis uncovered additional enriched pathways that were not evident in the module analysis. Specifically, pathways with increased NES included IL-6/JAK/STAT3 signaling, hypoxia, mTORC1 signaling, and complement. Pathways with negative NES consisted of Elongation Factor (EF)-2 signaling, oxidative phosphorylation, and unfolded protein response (Fig. 1D).
Comparison of the two MS1 clusters derived by k-means clustering (Additional file 1: Table S4) resulted in similar differential gene expression patterns between MS1 groups. For instance, cluster 2 (high MS1 cell abundance) exhibited an elevated expression of genes associated with inflammatory and innate immune responses, along with a decreased expression of genes related to adaptive immunity (Additional file 1: Fig. S5 and Table S6).
Distinctive and overlapping host response biomarker profiles in MS1 groupsWe determined 15 host response biomarkers reflective of three key pathophysiological domains (inflammatory response, endothelial cell activation, and coagulation activation) in plasma obtained on admission to the ICU (for concentrations of individual biomarkers see Additional file 1: Table S7). First, we generated domain-specific PCA plots to compare patient tertiles with varying MS1 percentages (low, intermediate, and high) (Fig. 2). There was substantial overlap in plasma biomarker responses between MS1 groups; significant differences were detected between the low MS1 group versus the intermediate and high MS1 groups with regard to the PC1 of the inflammatory response (Fig. 2A) and coagulation domains (Fig. 2B). PCA of the endothelial cell response did not reveal differences between MS1 groups (Fig. 2C). The complete contribution of each biomarker to a PC score is depicted in Additional file 1: Table S8. Additional file 1: Fig. S6 presents the magnitude of individual biomarker differences in the low MS1 group relative to the MS1 other groups, expressed as Hedges’ g. This analysis showed that most biomarkers reflective of the inflammatory response and endothelial activation were lower in patients categorized within the low MS1 group, while coagulation activation markers demonstrated a mixed pattern. Notably, these results showed to be robust in the two-group comparison (low vs. high MS1 cell percentage) derived from the k-means clustering approach (Additional file 1: Fig. S7). Taken together, these findings suggest that the relative abundance of MS1 cells has a modest influence on plasma biomarker profiles indicative of pathophysiological pathways implicated in sepsis pathogenesis.
Fig. 2
Distinctive and overlapping host response biomarker profiles in plasma among sepsis patients stratified based on MS1 cell percentage in blood. A Inflammatory response. B Endothelial cell activation and C Coagulation activation. Principal component analysis (PCA) in which principal components (PC) 1 and 2 are plotted per pathophysiological domain. Each domain is represented along the x- and y-axes, labeled with the respective percentage of total variance explained by PC1 and PC2. The contribution of each biomarker to a PC score is detailed in Additional file 1: Table S3. The ellipse illustrates the central 10% of each MS1 group. Arrows in the plot indicate both the direction (arrow orientation) and magnitude (arrow length) of the correlation existing between each biomarker and the PCs. Adjacent to each PCA plot, boxplots facilitate group comparisons concerning PC1 and PC2. It is important to note that even a negative trend within a boxplot of a PC may denote a positive correlation with biomarker concentrations, as reflected by the direction of the arrows. Post-hoc analysis was conducted using a Tukey Test. Significance levels are represented as follows: ***p < 0.001, *p < 0.05. IL interleukin, MMP8 matrix metalloproteinase 8, NGAL neutrophil gelatinase-associated lipocalin, ANG1 angiopoietin 1, ANG2 angiopoietin 2, sE-selectin soluble E-selectin, sICAM-1 soluble intercellular adhesion molecule 1, PT prothrombin time
Relation between MS1 cell proportions and previously described molecular subtypes and signatures in patients with sepsisIn the recent past, patients with sepsis have been divided into several subtypes based on blood RNA expression profiles, including Mars1 to Mars4 [17], subtypes named “inflammopathic, “adaptive” and “coagulopathic” [18], and SRS1 and SRS2 [19]. We observed distinct patterns in the distribution of MS1 cell proportions across these subtypes (Fig. 3A and Additional file 1: Fig. S8A, B). Patients classified as the Mars3 subtype—characterized by upregulated adaptive immunity and T cell function and associated with the lowest mortality risk [17]—displayed the lowest percentage of MS1 cells. Likewise, patients within the “adaptive” subtype, characterized by adaptive immune activation and lower mortality [18], also exhibited a lower percentage of MS1 cells. With regard to SRS subtypes, the percentage of MS1 cells was higher in patients of the SRS1 subtype when compared with the SRS2 subtype. The SRS1 subtype entails an immunocompromised profile, encompassing attributes of endotoxin tolerance, T cell exhaustion, downregulation of HLA class II genes, and increased risk of death [19, 20]. Beyond blood RNA profile-based subtypes, patients with ARDS and/or sepsis have also been stratified into hyperinflammatory and hypoinflammatory subtypes [21, 22]. MS1 cells were more abundant in the hyperinflammatory subtype (Additional file 1: Fig. S8C); this subtype is characterized by stronger inflammatory responses, higher mortality rates, and a higher incidence of shock [21].
Fig. 3
Relation between MS1 cell proportions and previously described molecular subtypes and signatures in patients with sepsis. A Percentage of MS1 cells in Sepsis Response Signature (SRS) subtypes. Correlation analysis between the percentage of MS1 cells and B quantitative sepsis response signature (SRSq) score, and C Molecular Degree of Perturbation (MDP) score. ****Mann–Whitney U test p < 0.0001. rho spearman correlation coefficient
Based on the SRS subtyping, a quantitative continuous score named SRSq has been generated [20]. SRSq is a score between 0 and 1, with lower values reflecting transcriptomes closer to health and higher values indicating the most severe immune dysregulation. The proportion of MS1 cells showed a moderate positive correlation with SRSq (rho = 0.47, p < 0.0001; Fig. 3B). Similarly, the MDP score—which quantifies transcriptional perturbation [23,24,25]—exhibited a positive correlation with the percentage of MS1 cells (rho = 0.55, p < 0.0001; Fig. 3C). Based on the “inflammopathic, “adaptive” and “coagulopathic” subtyping, a continuous probability score has been generated [18]; patients with a high probability score for a given subtype are more likely to belong to that group. Interestingly, MS1 levels showed a positive correlation with the probability scores of the inflammopathic (rho = 0.41, p < 0.001; Additional file 1: Fig. S8D) and coagulopathic (rho = 0.22, p < 0.01; Additional file 1: Fig. S8E) subtypes, which are characterized by a higher disease severity and mortality [18], and a negative correlation with the probability score of the adaptive phenotype (rho = − 0.42, p = 0.0001; Additional file 1: Fig. S8F). MS1 cell percentages also showed a negative correlation with the mean expression levels of HLA class II genes (rho = − 0.48, p = 0.0001; Additional file 1: Fig. S8G). HLA class II molecules play a crucial role in driving adaptive immune responses by presenting pathogen-derived peptides to CD4+ T cells [26]. Collectively, these results suggest that a higher abundance of MS1 cells is associated with more severe immune dysregulation and immunosuppression.
MS1 cell proportions in non-infected critically ill patientsWe next compared the percentage of MS1 cells in critically ill patients with sepsis to those in 42 healthy controls and 215 critically ill patients without infection (Fig. 4 and Additional file 1: Table S9 for the comparison of non-infected and sepsis patients). Both groups of critically ill patients displayed elevated MS1 cell proportions in comparison to healthy controls. However, a direct comparison between critically ill patients with sepsis and those with non-infectious conditions did not reveal a statistically significant difference in MS1 cell proportions (Fig. 4A). Notably, in both patient groups, the presence of shock was associated with higher MS1 cell proportions (Fig. 4B).
Fig. 4
MS1 cell proportions in sepsis patients relative to non-infected critically ill patients. A Comparative analysis of MS1 cell levels in healthy controls (HCs, n = 42), critically ill patients with infection (Sepsis, n = 332) and critically ill patients without infection (Non-Inf ICU, n = 215), and, B Comparative analysis of MS1 cell levels in patients with sepsis without shock (Sepsis, n = 208), patients with sepsis and shock (Septic Shock, n = 124), critically ill patients without infection and without shock (Non-Inf ICU, n = 135), critically ill patients without infection yet with shock (Non-Inf ICU Shock, n = 80). Statistical analyses were performed using the Kruskal–Wallis test with Dunn’s Post-Hoc Test corrected by Benjamini–Hochberg method. ****Dunn’s post-hoc test p < 0.0001, **p < 0.01, *p < 0.05
In an approach similar to our primary analysis, non-infected critically ill patients were classified into tertiles based on their relative MS1 cell abundance: low, intermediate, and high. The high MS1 group exhibited elevated SOFA scores upon ICU admission and higher mortality frequencies (up to day 90) compared to the low MS1 group (Additional file 1: Table S10). Admission diagnoses did not differ between MS1 groups (Additional file 1: Table S11). In a sensitivity analysis also done in sepsis patients, we employed one-dimensional k-means clustering to stratify non-infected critically ill patients based on MS1 cell abundance. Two clusters were defined as the ideal number of clusters (Additional file 1: Table S12). Cluster 2 (high MS1 cell abundance) exhibited elevated SOFA, APACHE IV and APS scores (Additional file 1: Table S13), largely reproducing the results of the comparison between MS1 tertiles.
Furthermore, a gene co-expression network analysis was conducted, first comparing the MS1 tertiles, revealing eight distinct gene expression modules, of which five modules (Fig. 5A) were significantly different between the three groups, with different pathways overrepresented (Additional file 1: Table S14). Modules 1 and 5 exhibited similar expression patterns and pathway enrichments comparable to those seen in Modules 1 and 3 observed in patients with sepsis. Notably, they shared central hub genes, including lymphocyte-related genes like IL23A, SKAP1, IMPDH2, and NFATC2 (Fig. 5B). A significant overlap between sepsis patients (Fig. 1C, D) and non-infected ICU patients (Fig. 5C, D) was also identified in the functional enrichment analysis based on correlation values (rho) within the gene expression matrix, revealing 15 common pathways, such as EF-2 signaling, allograft rejection, oxidative phosphorylation, and fatty acid metabolism, displayed negative NES, while pathways like inflammatory response, TNF signaling via NF-κB, IL-6/JAK/STAT3 signaling, and hypoxia exhibited increased NES. Interestingly, the inflammatory response (higher in high MS1 group) and adaptive immunity pathways (higher in low MS1 group) were enriched regardless of how patients were stratified (tertiles vs. k-means clustering; Additional file 1: Table S15 and Fig. S9), reproducing findings in patients with sepsis (Additional file 1: Fig. S5). This suggests that the expression of genes related to these pathways is associated with the percentage of MS1 cells irrespective of the presence of infection.
Fig. 5
Co-expressed gene modules and gene set enrichment analysis in non-infected critically ill patients stratified according to MS1 cell percentages in blood. A The co-expression module identification analysis revealed distinct gene modules based on MS1 cell levels in non-infected critically ill patients. Patients were categorized into low MS1 (n = 72), intermediate MS1 (n = 71), and high MS1 groups (n = 71). The size of each circle in the graph is proportional to -log10(BH adjusted p value), and the color represents the normalized enrichment score (NES). Blue indicates a decreased NES, and red color represents an increased NES; B The network diagrams depict the two largest differential co-expression gene modules (Module 1 and Module 5) identified in the analysis, the network highlights the hub genes, which are crucial regulatory genes within each module; C The graph illustrates the correlation between the percentage of MS1 cells and the normalized gene expression matrix. Positive correlations with a BH adjusted p value < 0.05 are shown in red, negative correlations in blue; non-significant correlations are depicted in grey; D Gene set enrichment analysis performed on genes that correlated with MS1 levels. The color-coded NES values signify the enrichment score for each pathway; all pathways displayed a BH adjusted p value < 0.05, except for pathways marked by an asterisk (*), which indicates a BH adjusted p value < 0.1
When classifying critically ill patients without infection according SRS subtypes, the percentage of MS1 cells was higher in patients of the SRS1 subtype compared to the SRS2 subtype (Fig. 6A). The proportion of MS1 cells showed a strong positive correlation with SRSq (rho = 0.63, p < 0.0001; Fig. 6B). Similarly, the MDP score exhibited a positive correlation with the percentage of MS1 cells (rho = 0.62, p < 0.0001; Fig. 6C). Overall, these two scores demonstrated stronger correlations with MS1 cell abundance in critically ill patients without infection compared to those in patients with sepsis.
Fig. 6
Relation between MS1 cell proportions and previously described molecular subtypes and signatures in critically ill patients without infection. A Percentage of MS1 cells in Sepsis Response Signature (SRS) subtypes. Correlation analysis between the percentage of MS1 cells and B quantitative sepsis response signature (SRSq) score, and C Molecular Degree of Perturbation (MDP) score. ****Mann–Whitney U test p < 0.0001. rho Spearman correlation coefficient
留言 (0)