Isolation, cultivation, and identification of BMSCs
Isolate the tibia and femur of the mouse (C57BL/6, male, 6 weeks), and rinse the bone cavity using sterile PBS buffer. This study was approved by the Ethics Committee of Hefei First People’s Hospital (2022(76)). Collect the bone cavity irrigation fluid, centrifuge to collect the pellet, add complete mouse bone marrow mesenchymal stem cells (BMSCs) medium (MUXMX-80,011, Cyagen) to resuspend the pellet for culturing at 37 ℃ with 5% CO2. We changed the medium every 3 days and remove the un-adhered cells until the cells are overgrown and begin passaging. Third generation cells were used to analyze cell surface markers of BMSCs through flow cytometry, including CD29 (ab193591, abcam, UK), CD90 (ab226, abcam), CD34 (ab187568, abcam), and CD45 (ab305209, abcam).
miRNA transfection into BMSCs
Synthesized miR-NC, miR-150-5p-mimic (Mimic, 4,464,066, ThermoFisher) and miR-150-5p-inhibitor (Inhibitor, AM17000, ThermoFisher) were transferred into BMSCs according to the instructions of the Lipo3000 transfection reagent kit (L300075, ThermoFisher, USA).
Cell proliferation assay
1 × 10⁴ BMSCs were seeded into 96-well plates and cultured for different time (1, 3, 7 days and 14days). And then we removed the cell culture medium, washed with PBS buffer two times, followed by adding 10 µL of CCK8 reagent (40203ES60, YEASEN) and 90 µL of cell culture medium. After 2 h of cultivation (37 ℃ and 5% CO2), we measured the OD value of each well at a wavelength of 450 nm.
Determination of osteocalcin, ALP activity and calcium deposition
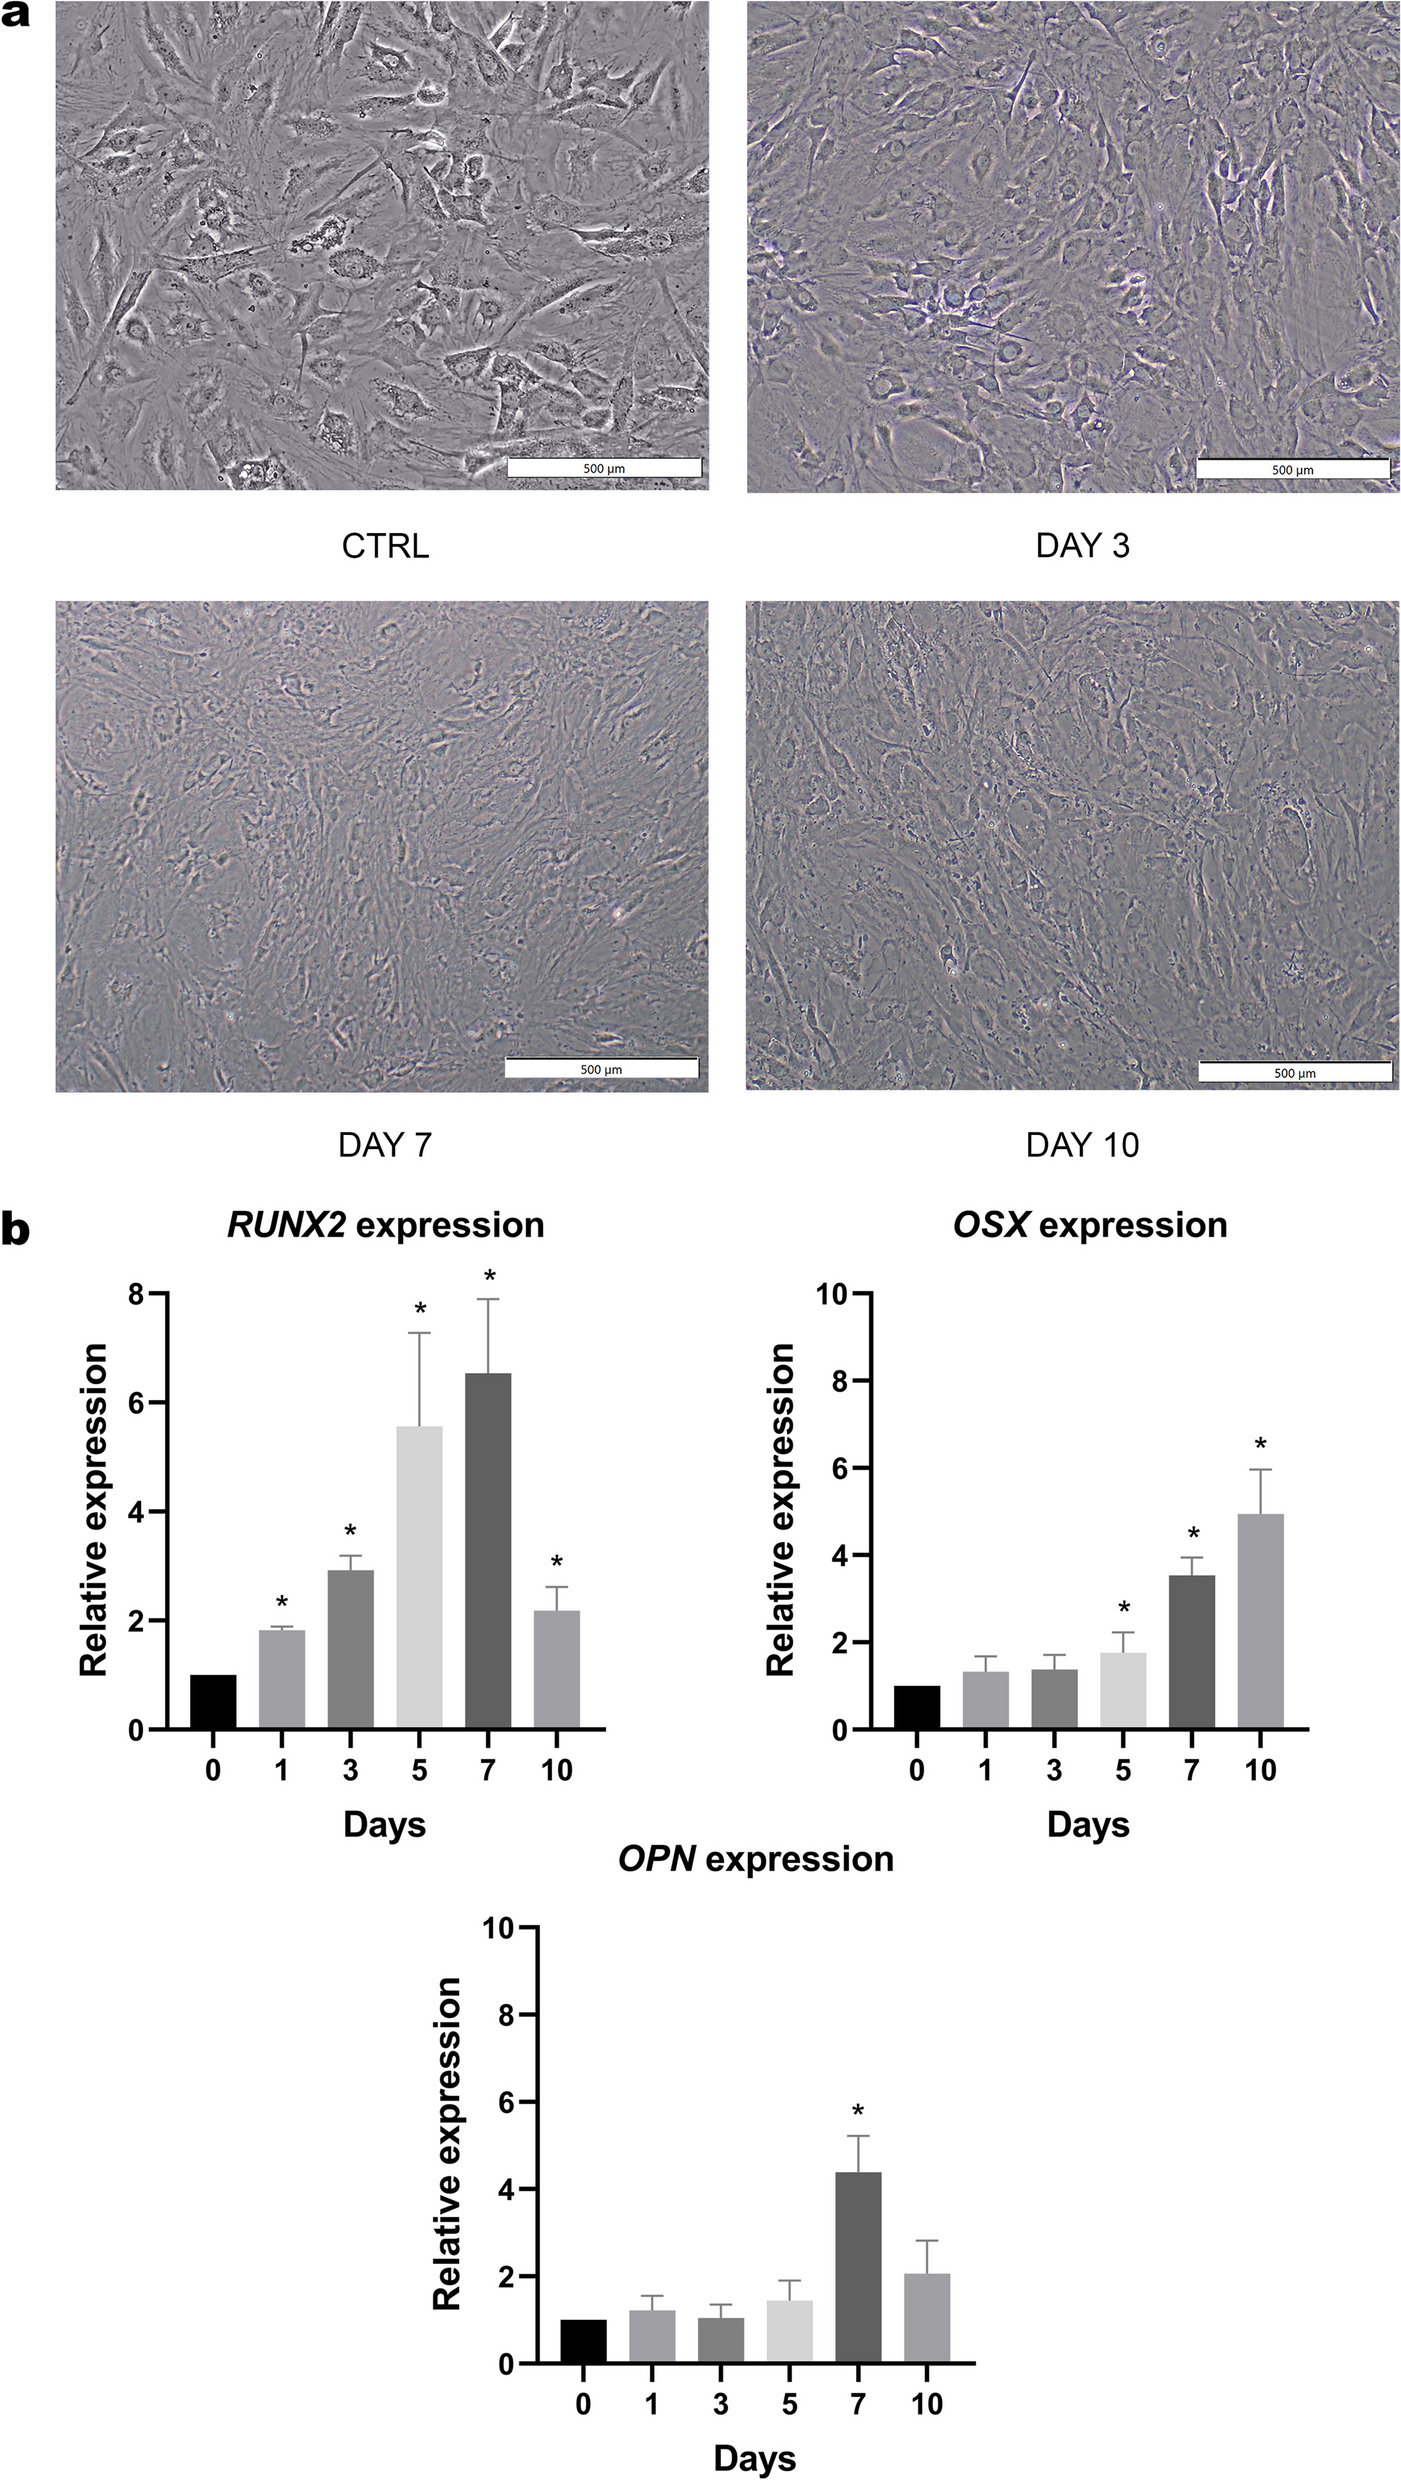
15 days after the BMSCs were induced by the Osteogenic Differentiation Induction Medium Kit (OIM, PD-003, Procell), BMSCs were collected to detect the content of osteocalcin, alkaline phosphatase (ALP) activity and calcium deposition using mouse OC/BGP (Osteocalcin) ELISA Kit (D721126, Sangon Biotech), a ALP detection kit (LM-E800, Shanghai Lianmai Bioengineering Co., Ltd), and a calcium assay kit (S1063S, Beyotime), respectively.
Real-time quantitative polymerase chain reaction
Real-time quantitative polymerase chain reaction (RT-qPCR) was used to determine the expression of mRNA and miRNA. In brief, RNAiso reagent (D9108A, Takara) was used to extract the total RNA from BMSCs, and prepared the cDNA using a reverse transcription kit (RR407A, Takara). At last, RT-qPCR was done using a qPCR master mix kit (A6006A, Promega). Primers for RT-qPCR was showed in supplementary materials Table 1.
Western blot
RIPA lysis buffer (HY-K1001, MCE) was used to lyse BMSCs to extract total cellular protein, and the indicated total protein was analyzed by SDS-PAGE gel, and then the various protein molecules that have been isolated are transferred to the polyvinylidene fluoride (PVDF) membrane. After being blocked by 5% BSA for 1 h at room temperature, the PVDF membrane is immersed in a solution containing the primary antibodies against Runx2 (1:1000, ab192256, abcam), BMP2 (1:2000, ab284387), Osteocalcin (OCN, 1:500, ab93876, abcam), FNDC5 (1:1000, ab174833), p38 (1:1500, 9212, cell signaling technology) and phospho-p38 (1:500, 4511, cell signaling technology). Next, the PVDF membrane is immersed in a solution containing the secondary antibodies, such as goat anti-mouse IgG (1:2000, 9116, cell signaling technology) or goat-anti-rabbit IgG (1:2000, 7074, cell signaling technology). Finally, proteins were visualized with ECL solution (WBKLS0100, Beijing Xinjingke Biotechnologies Co., Ltd, China), followed by densitometry analysis using Imag J 3.0 (IBM, USA) and β-actin was loading as control.
Over-expression of FNDC5
The upstream and downstream sequences of human FNDC5 gene (NM_153756.2) were searched in GenBank, primers were synthesized, and EcoRI digestion sites were introduced into the upstream and downstream primers according to the cloning requirements (supplementary materials Table 1). And then we cloned the FNDC5 gene into the pLenti-EF1a-EGFP-P2A-Puro-CMV-MCS-3Flag lentiviral expression vector (TSPLA10157, Testobio). Finally, a lentiviral shuttle plasmid carrying the FNDC5 gene was co-transfected with a helper packaging plasmid to co-transfect 293T cells to prepare lentivirus. Lentivirus was used to infect BMSCs (MOI = 100) to over-expression of FNDC5.
Osteoporosis mice and treatment
A total of 40 C57BL/6 mice (male, 6 weeks) were sued in our research, and they were randomly divided into 4 groups after 1 week of adaptive feeding, namely, Healthy group, OP group, Irisin group, and Irisin + SB group. During the first 4 weeks of the research, all mice except the Healthy group were injected subcutaneously with dexamethasone (40 mg/kg/day for 4 weeks) to construct an osteoporosis model. For the next 8 weeks, mice in each group were given different drug treatments. Mice in Healthy group and OP group were given equal amounts of saline, and mice in the Irisin group were given recombinant irisin (120 ng/kg/week for 8 weeks, SPR8039, MERCK) through tail vein injection, and mice in Irisin + SB group were given recombinant irisin (120 ng/kg/week for 8 weeks, SPR8039, MERCK) through tail vein injection and given SB203580 (5 mg/kg/day for 8 weeks, A8254, Apexbio).
Detection of serum Ca2+, 25(OH)D, osteocalcin and DPD
After 8 weeks of treatment with irisin or SB203580, peripheral blood was collected from mice by extracting eyeballs and centrifuging (at room temperature, 1000 g, 10 min) to collect serum. And we determined the serum level of 25(OH)D using a 25-OH-vitaminD (total ELISA kit; MSE-800, Bio TNT), and determined the serum level of osteocalcin using a mouse osteocalcin ELISA kit (ab285236, abcam). At the same time, we also collected the urinary of mice to detect the level of deoxypyridinoline (DPD) with a mouse DPD ELISA kit (SFJ20421, ShangHai shifeng biological technology co., ltd), which was standardized the content of creatinine in urine. In addition, the automatic biochemistry analyzer is used to detect serum level of Ca2+ (BS280, mindray).
Statistical analysis
Data in the present study was recorded in Excel software (Microsoft, USA), analyzed in SPSS 20.0 (IBM, USA) and visualized by Graphpad prism 9.0 (Graphpad prism, USA). Measurement data was expressed as mean ± standard deviation (SD) with 3 independent replicates or 5 mice. Difference between more than two groups was compared using one-way ANOVA and two-way ANOVA. P < 0.05 indicated a significant difference.


留言 (0)