
記住我


Overall, in England 23,555 HCCs were diagnosed between 2006 and 2017. 36.1% of these presented via an emergency route, 30.2% via GP referral, 17.1% via Outpatient referral and 11.0% via Two Week Wait, 1.3% Inpatient Elective, 0.4% DCO and 3.9% had no data available (‘Unknown’ route) (Table 1).
Table 1 Description of HCC cases by route to diagnosis.Patient characteristics and routes to diagnosisThe characteristics of cases varied by RtD (Table 1). People presenting via IP and OP were younger at diagnosis on average (66.0 and 66.4 years, respectively), and TWW and EP (71.9 and 70.2 years, respectively) older. After adjustment for other characteristics (Table 2), the odds of EP and TWW were higher for patients with older age at diagnosis and the odds of GP referral and OP lower. 78.1% of HCC cases were in men, and the proportion varied by RtD. After adjustment, the odds of an EP compared to any other route were 24% higher in women, and of a GP or TWW presentation 11 and 17% lower, respectively. Area-based deprivation was strongly associated with RtD; over 27% of EPs were in people in the most deprived quintile of the population and only 13.8% in the least deprived. A similar pattern was seen for GP and OP presentations, but not for TWW and IP presentations. After adjustment for other characteristics, odds of an EP presentation were 45% higher for those in the most deprived quintile compared to the least. In contrast, odds of OP presentation were 25% lower. The ethnicities of those diagnosed via EP, GP and OP were broadly similar, but a higher proportion of those diagnosed via TWW were white (87.2%), and for those diagnosed via IP a lower proportion were white (77.5%) and a higher proportion (6.7%) black. Ethnicity data was missing for a large proportion of DCOs (57%). After adjustment, there was no strong associations of ethnicity with EP, but odds of GP referral or TWW were highest for white people, and odds of OP were highest for Asian and other ethnicities.
Table 2 Associations of demographic, lifestyle, and clinical factors at HCC diagnosis with Route to Diagnosis.Underlying PLD could be established from HES records in 13,777 (58.5%) cases. The remaining 41.5% either had one of the forms of PLD on our list but no record of a corresponding HES code for it, had a different PLD, or had no PLD. Overall, ALD (20.7% of cases) was the most common PLD, followed by NAFLD (15.1%) and then HCV (13.2%) and this varied by RtD. The odds of an EP presentation were highest for those with ALD compared to other PLDs, after adjustment for other characteristics. In comparison, the odds of a GP referral was higher for PLDs other than ALD. More people presenting via OP had a known PLD than those presenting via other routes. People with AIH, PBC, haemochromatosis, and viral hepatitis were more likely to have an OP presentation than those with ALD, or NAFLD. The odds of TWW presentation was highest in those with NAFLD and with no/unknown PLD.
41.7% of cases had no co-morbidity codes recorded in HES and 29.7% had a score of three or more. Those presenting via TWW or IP had fewest recorded comorbidities (57.2% and 55.9% had none, respectively) and those presenting via OP the most (52.0% had a score of two or more). After adjustment, those with known comorbidities were less likely to present via TWW (OR 0.32 [95%CI 0.28–0.36] in those with a score of ≥3 comorbidities compared to those with no recorded comorbidities), and more likely to present via OP (OR 2.08 [95%CI 1.90–2.28] for ≥3). The highest proportion of patients with decompensated cirrhosis was seen in those presenting via EP (accounting for 39.1% of all EPs). After adjustment, those with decompensated cirrhosis were over 4 times more likely to present via EP than those with compensated cirrhosis (OR 4.21 [95%CI 3.91–4.54]). TWW presentations were less likely to have any recorded cirrhosis. TNM stage was only available for 27.3% of cases. The stage distribution was more favourable in those presenting via GP or OP and least favourable for those presenting via EP.
Routes to diagnosis over timeThe proportion presenting via EP reduced between 2006 and 2017 from 42.2% to 31.5% of all cases, and the proportion presenting via GP referral and TWW increased (24.9% to 30.7% and 6.9% to 15.2%, respectively). There was no significant change in the proportion presenting via OP (16.4% to 15.2%). These patterns remained after adjustment for demographic and, additionally, for clinical characteristics of patients (Fig. 1).
Fig. 1: Proportion of HCC cases presenting via each main route to diagnosis, 2006–2017.
Upper graph: unadjusted. Middle graph: adjusted for demographics. Lower graph: adjusted for demographic and clinical factors.
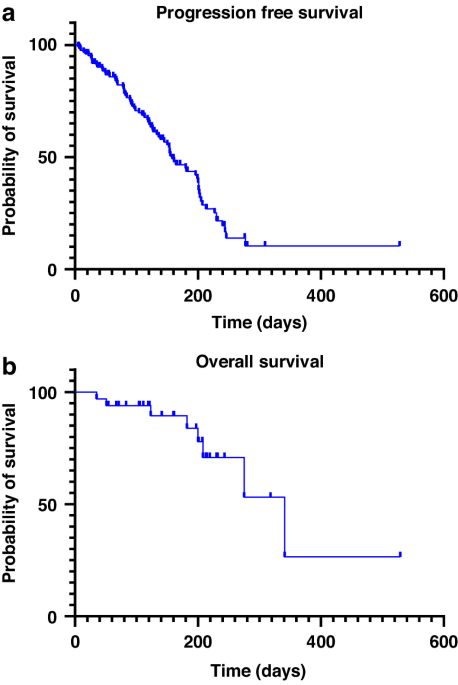
Associations with mortality20,671 (87.8%) HCC cases had died by the end of follow-up; median survival was 194 days overall (Table 1). Median survival ranged widely from 55 days for diagnoses via EP, to over 400 days for GP and OP (Fig. 2). Unadjusted, compared to EPs, those presenting via OP or GP referral had the lowest odds of mortality at 365 days (Table 3). In fully adjusted models, associations were only slightly attenuated and those presenting via OP or GP referral continued to have the lowest odds of mortality (OR 0.23 and 0.26, respectively) compared to EP. IP or TWW had intermediate odds (OR 0.37 and 0.42, respectively). In those with stage information, additional adjustment for TNM stage accounted for some of the variation in odds of mortality by RtD and further adjustment for receipt of potentially curative treatment attenuated associations further, but odds of death by 365 days post-diagnosis remained highest for EPs compared to other RtDs.
Fig. 2: Kaplan–Meier curves.
Kaplan–Meier 5-year survival by route to diagnosis.
Table 3 Odds of 365-day mortality in HCC patients by route to diagnosis.In the sensitivity analyses (Table 3), for people with decompensated cirrhosis, odds of mortality by 365 days were similar for those diagnosed via TWW and EP, and lowest for GP and OP. Odds of 365-day mortality were highest for EPs irrespective of the underlying cause of PLD, although odds were also high for presentations via TWW for people with haemochromatosis and HCV. For those with AIH, PBC or NAFLD, the lowest odds of 365-day mortality were diagnoses via IP or Unknown RtDs, followed by GP and OP. Analyses were repeated with 90-day mortality as the outcome to assess if associations were different for short term mortality (Supplementary Information 5). Associations were broadly similar.
Associations of RtD with curative treatment20.5% of cases received potentially curative treatment overall, which also varied widely by RtD (Table 1); from 9.0% for EP to 35.8% for OP. Unadjusted, compared to EP, the odds of curative treatment were almost six times higher for OP (OR 5.94), four times higher for GP and IP (ORs 3.90 and 3.86, respectively) and two times higher for TWW (OR 1.91), and Unknown RtD (OR 1.92) (Table 4). In the fully adjusted model, these associations remained but were slightly attenuated (for example, OR for OP was 4.16 compared to EP). In sensitivity analyses, variations in associations were seen. Excluding those that died in the first 90 days after diagnosis attenuated associations substantially, though odds of curative treatment were still 1.8 to 2.3 times higher for presentations via OP, IP, and GP compared to EP. The same attenuation pattern was also seen following additional adjustment for TNM stage. When stratified by cirrhosis stage, large differences in odds of curative treatment by RtD were seen for those with no known cirrhosis (OR range 6.05 for OP to 1.0 for EP (referent)), and compensated cirrhosis (OR range 4.41 for OP to 1.0 for EP). For those with decompensated cirrhosis, odds were highest in those that presented via OP (OR 3.05) and GP (OR 2.20), but those that presented via TWW, IP or unknown RtD all had similar odds to those presenting via EP. Some differences in range of associations were also seen by PLD. For those with haemochromatosis or HBV, odds of curative treatment in those presenting via OP were over six times that of those presenting via EP. For those with NAFLD, odds of curative treatment were 4–5 times higher in those presenting via IP, OP, or GP referral than via EP. For those with other/unknown/no PLD, odds were much higher for OP (OR 6.01) and GP (OR 4.60), compared to EP. An effect modification by age was also seen; those aged over 65 were over five times more likely to receive curative treatment if presentation was via OP than EP, whereas those under 65 were three times more likely.
Table 4 Odds of curative treatment in HCC patients by route to diagnosis.
留言 (0)