
記住我
We identified 910 eligible children in the EHR and reached 508 of their caregivers by phone (55.6%). Of those, 277 caregivers consented to participate (54.5%) and 172 caregivers (33.9%) completed the survey for at least the first wave of mid-pandemic data collection. There were no significant differences between the eligible sample and enrolled sample in terms of age, race/ethnicity, preferred language, insurance status or pre-pandemic mental health symptoms; however, male children represented a greater proportion (56.4%) of the final sample than the sample of eligible children (48.0%) [7]. Of the 172 caregivers who participated in the first wave of data collection, 147 (85.5%) participated in the second wave (i.e., answered 3-month surveys) and 136 (79.1%) participated in the third wave (i.e., answered 6-month surveys).
Sample demographic information is presented in Table 1. Children in our sample had an average age of 8.5 years (SD = 1.8) during their initial well visit (prior to the pandemic). There were no significant differences in terms of age, sex, race/ethnicity, language, or pre-pandemic mental health symptoms between participants who completed Wave 1, Wave 2, and Wave 3 of the survey.
Table 1 Sample Demographics (N = 172)Mental health symptomsAs shown in Table 2, higher levels of child mental health symptoms were reported at all mid-pandemic waves compared with the pre-pandemic baseline. Average PSC-17 total scores were significantly higher at Wave 1 (M = 7.99, SD = 6.41, t151 = -6.03, p < 0.001, d = 0.50), Wave 2 (M = 7.70, SD = 5.97, t131 = − 5.76, p < 0.001, d = 0.50), and Wave 3 (M = 7.03, SD = 6.03, t118 = − 3.91, p < 0.001, d = 0.36), than during the pre-pandemic period (M = 5.62, SD = 5.80). Significantly more children had an at-risk score on the PSC-17 total score at Wave 1 than during the pre-pandemic period (17.6% vs. 7.9%, z = − 2.61, p < 0.01); categorical at-risk total scores at Wave 2 and Wave 3 data collection were not significantly different from scores during the pre-pandemic period.
Table 2 Longitudinal Trajectory of Mental Health Symptoms, Social Risks, and School Modality from August 2020 to July 2021 during the COVID-19 Pandemic Compared to the 6 months pre-pandemic (September 2019 – February 2020)Social risksTotal scores on the THRIVE screener and the proportions of each reported social risk factor for each time point are shown in Table 2. Average total THRIVE scores were significantly higher at Wave 1 (M = 1.76, SD = 1.87, t103 = − 5.93, p < 0.001, d = 0.59), Wave 2 (M = 1.67, SD = 1.78, t90 = − 4.73, p < 0.001, d = 0.50), and Wave 3 (M = 1.48, SD = 1.69, t85 = − 3.62, p < 0.001, d = 0.39), than during the pre-pandemic period (M = 0.87, SD = 1.46). The proportion of caregivers reporting housing insecurity, food insecurity, difficulty paying bills, and difficulty with dependent care was significantly higher at each wave of mid-pandemic data collection than during the pre-pandemic period.
School modalityThe modality by which children attended school at Waves 2 and 3 of data collection is shown in Table 2. At Wave 2, almost two-thirds of children were participating in remote school, approximately one-quarter were participating in a hybrid school model, and 10.4% were attending school fully in person. At Wave 3, less than half of children were participating in remote school, approximately one-quarter were participating in a hybrid school model, and almost one-third were attending school fully in person.
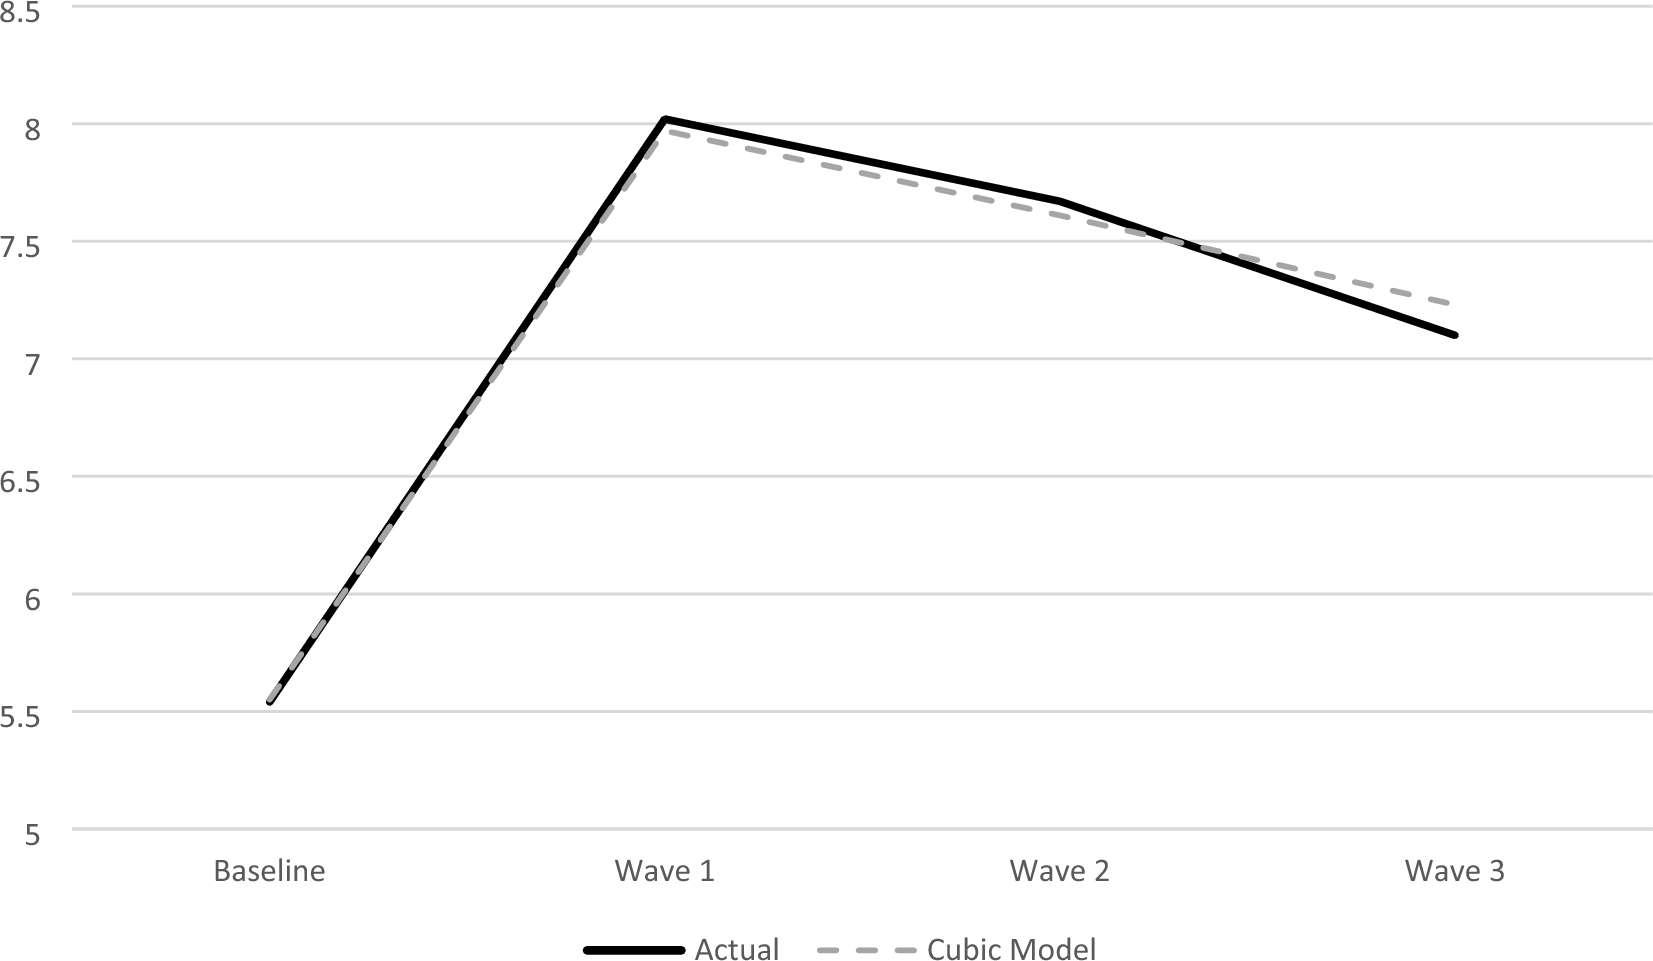
Longitudinal analysisTo further examine the relationship between time and mental health symptoms, we manually graphed this relationship and estimated a series of LMMs We tested whether the relationship between time and mental health symptoms was best represented by a linear, quadratic, or cubic function. Results from these three models, including fit statistics, are reported in Additional file 1: Table S1. We also graphed each function alongside the raw data. LRTs indicated that the cubic model was significantly better than the linear (Δχ2 = 27.08, Δdf = 2) model but not the quadratic model (Δχ2 = 0.08, Δdf = 1). AIC values favored the cubic model and BIC values favored the quadratic. Based on visual examination, LRTs, and the information criteria, we determined that the cubic model best represented the data. Figure 1 shows both the cubic function alongside the study data. Additional file 1: Figure S1 shows the study data with the linear, quadratic, and cubic functions.
Fig. 1
PSC Total Score over Time
We then estimated three additional multivariable longitudinal models to examine the relationship between social risks, school modality, and mental health symptoms. The full results for these models, including fit statistics, are shown in Additional file 1: Table S2. Model 1 included THRIVE scores, Model 2 included school modality, and Model 3 included both THRIVE scores and school modality. Results, including fit statistics for each model, are included in Additional file 1: Table S3. THRIVE scores (indicating number of social risks) were significantly and positively associated with PSC total scores in both Model 1 (B = 0.40, SE = 0.14, p < 0.01) and Model 3 (B = 0.37, SE = 0.14, p < 0.01). Youth who attended school in person had significantly lower PSC total scores (indicating fewer mental health symptoms) than youth attending remote school only, in both Model 2 (B = − 1.95, SE = 0.65, p < 0.01) and Model 3 (B = − 1.94, SE = 0.63, p < 0.01). Youth who attended school in person had significantly lower PSC total scores than youth attending hybrid school in Model 2 (B = − 1.58, SE = 0.69, p < 0.05) and Model 3 (B = − 1.36, SE = 0.66, p < 0.05). There were no significant differences in PSC-17 total score between youth attending hybrid and remote school in Model 2 or 3. In both models accounting for school modality, the relationship between time and PSC-17 total score attenuated and did not reach significance.
We estimated a final model including THRIVE scores, school modality, and sociodemographic variables (child age, child sex, child race/ethnicity, caregiver preferred language, and child insurance). As in the earlier models, THRIVE scores were significantly and positively associated with child mental health symptoms (B = 0.39, SE = 0.14, p < 0.01). Youth who attended school in person had significantly lower PSC-17 total scores than youth attending remote school (B = − 1.69, SE = 0.68, p < 0.05). There were no significant differences in mental health symptoms between youth attending hybrid and remote school. Full results, including fit statistics and coefficients for sociodemographic variables are included in Additional file 1: Table S3.
留言 (0)