
記住我


Twelve trained (McKay et al. 2022) cyclists (10 male, 2 female) participated in the present investigation (age: 40 ± 8 y, peak rate of oxygen uptake [\(\dot}\)O2peak]: 52.3 ± 5.2 mL·min−1·kg−1, mass: 76.2 ± 14.1 kg, height: 177 ± 11 cm, weekly training volume: 10.3 ± ± 3.4 h·week−1). A priori sample size estimation indicated that only four participants per group were required to detect a statistically significant change in power output at VT1 after 2 h of exercise at 90% of VT1 measured at rested state using data from similar endurance‐trained cohort with 80% statistical power (Stevenson et al. 2022). Inclusion criteria were: habitually training > 7 h week−1, free of viral infection and musculoskeletal injury for 3 months, not suffering from cardiovascular disease, and able to self-report a record power output over 20 min of > 3.5 W kg−1 body mass for males or > 2.5 W kg−1 body mass for females. These criteria were formally assessed through a health screening questionnaire during the first laboratory visit. The Auckland University of Technology Ethics Committee approved all procedures (23/37), and all participants provided written informed consent.
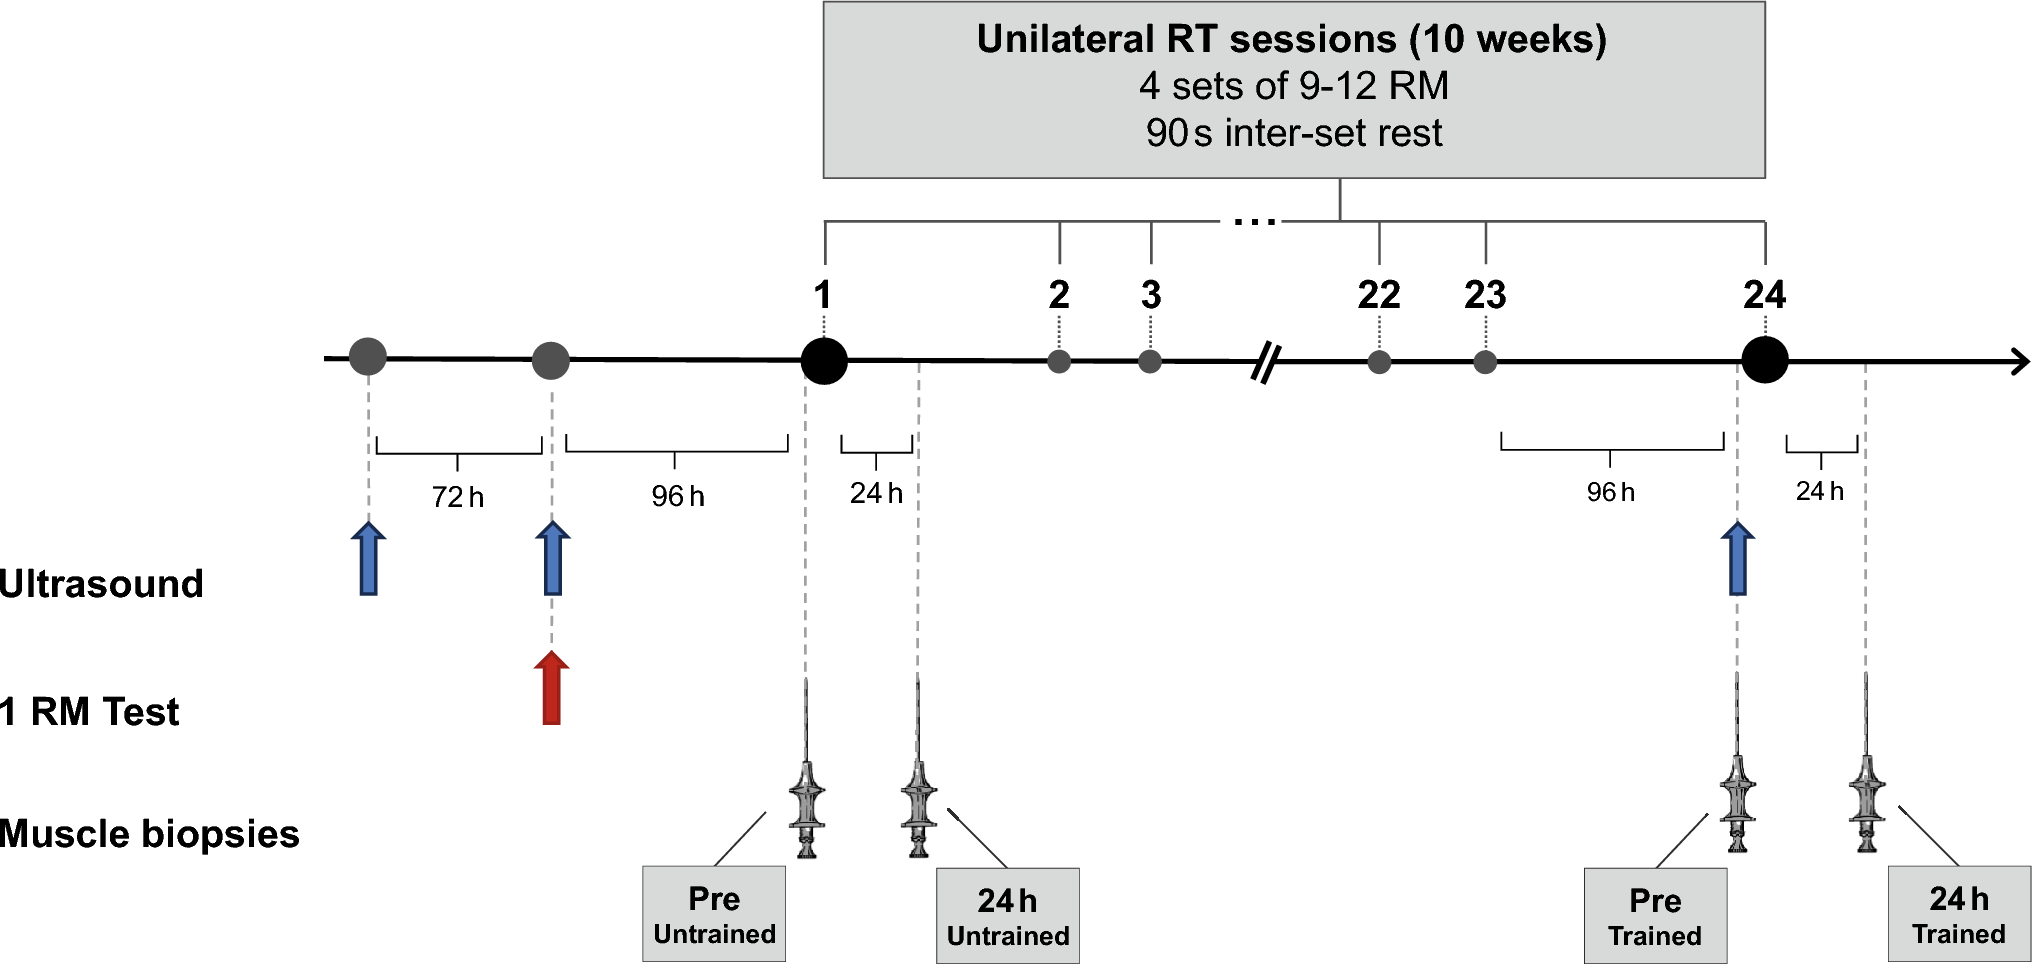
Study designAn overview of the study design is shown in Fig. 1. Participants visited the laboratory on two occasions. The first visit was to determine the peak rate of oxygen uptake (\(\dot}\)O2peak), the peak fat oxidation rate (PFO), and to estimate the power output at first (VT1) and second (VT2) ventilatory thresholds. The estimated VT1 was used to set the intensities in the second visit. In line with previous studies, VT1 was used as marker of the moderate-to-heavy intensity transition. (Stevenson et al. 2022) In the second visit, VT1 was assessed in the rested state and then again each hour until exhaustion (up to a maximum of 6 h) to observe the time course of its decrease during prolonged exercise, the association between the time to a 5% decrease in VT1 (Δ5%VT1) and time-to-task failure (TTTF), and the physiological correlates of Δ5%VT1 and TTTF. Laboratory tests were performed on participants’ own road bicycle mounted on a direct-drive indoor cycling trainer (Kickr v5, Wahoo Fitness, Atlanta, USA), which provides valid and reliable measurements of power output (Hoon et al. 2016).
Fig. 1
Schematic representation of study design. On day 2, the incremental exercise test and the 30 min bout at 90% of estimated power output at VT1 were repeated until failure, or for a maximum of 6 h. Percentage values represent the intensity of each phase referring to the power output at VT1 estimated in the first visit
Visit one: characterisation trialParticipants arrived in the laboratory having fasted overnight for ~ 10 h, ingested 1.5 L of water in the morning before arrival, and refrained from caffeine, vigorous exercise, and alcohol for 24 h. Height and body mass was recorded. Participants then completed a maximal incremental test. For males, cycling commenced at 95 W, with the power output increasing by 35 W every 3 min. Females started at 75 W and power output was increased by 25 W every 3 min. The discrepancy in step increments between females and males was chosen to ensure a dense cluster of datapoints around VT1 and VT2, given that lower absolute power at VT1 in females compared to males is usually recorded (Kim et al. 2021). Expired gases were collected continuously using indirect calorimetry with mixing chamber technology (TrueOne 2400, ParvoMedics, UT, USA). When the respiratory exchange ratio (RER) reached 1.0, the power output was increased by 35 W (males) or 25 W (females) every minute until volitional exhaustion. The \(\dot}\)O2peak was accepted as the highest 15-s average \(\dot}\)O2. The estimated VT1 and VT2 was identified as the \(\dot}\)O2 at which a systematic rise in \(\dot}\) E ̇\(\dot}\)O2−1 and \(\dot}\)E\(\dot}\)CO2−1 occurred, respectively. These \(\dot}\)O2 values were converted to power output by linear fit of the power output vs. \(\dot}\)O2 relationship, using the last minute of \(\dot}\)O2 data from each 3-min stage (Stevenson et al. 2022). The \(\dot}\)O2 at VT1 and VT2 values were picked independently by two operators with multiple years’ experience, and the average between the two values was considered (mean difference: 1 ± 6 W, range: 0–20 W). Assessment of the first ventilatory threshold using ventilatory equivalents has excellent reliability (3.5%) (Pallares et al. 2016). The last minute of expired gas data in each 3-min stage was also used to quantify whole-body fat oxidation rates and gross efficiency (GE) using standard stoichiometric equations (Jeukendrup and Wallis 2005; Hopker et al. 2009) (Eq. 1). The highest observed rate of whole-body fat oxidation was identified as PFO. The stage closest to the estimated VT1 was used to characterise GE.
Visit two: prolonged exercise assessmentParticipants arrived in the laboratory ~ 3–7 days later, having consumed a breakfast containing ~ 2 g kg−1 of carbohydrate (in line with general guidelines about pre-exercise meal, Podlogar and Wallis 2022) and ~ 800 mL of water 1 h beforehand, and having refrained from caffeine, vigorous exercise, and alcohol for 24 h. Cycling began with a 3-min warm-up at 100 W. Subsequently, VT1 was measured using a 6 × 4 min incremental test, with continuous collection of expired gases. The 4 min steps were used to increase the density of datapoints are VT1. The intensities of the six increments were: 70%, 80%, 90%, 100%, 110%, and 120% of the VT1 power output estimated in the first laboratory visit. The VT1 was determined using the same methods outlined in the first laboratory visit, but with greater precision given the denser cluster of datapoints around the transition. This method has been used to estimate the moderate-to-heavy intensity transition previously, producing similar results to blood lactate-derived measurements (Stevenson et al. 2022). After the initial incremental test, participants undertook repetitions of 30 min at 90% of the power output associated with VT1 in the first visit, and the 30-min incremental test, to calculate power output at VT1 each hour until exhaustion. Maximum duration was set at 6 h even if failure was not attained. Task failure was defined volitionally or through inability to maintain a pedalling cadence ≥ 50 rpm despite encouragement. ‘Time 0’ for calculating time-to-task failure was the beginning of the warm-up before the first incremental step test. Expired gases were collected throughout all incremental tests, and the \(\dot}\)O2 and \(\dot}\)CO2 in the last minute of each of the six 4-min stages was used to calculate the respiratory exchange ratio (RER), and rates of fat and carbohydrate oxidation using stoichiometric equations (Eq. 1) (Jeukendrup and Wallis 2005). During each 30 min bout at 90% of estimated VT1, participants consumed 600 mL of water in a solution made with an electrolyte mix (Science in Sport GO Hydro). Participants were instructed to adopt their preferred cadence throughout the trial.
Energy expenditure (kcal⋅min−1) = (0.55⋅\(\dot}\)CO2) + (4.471⋅\(\dot}\)O2).
GE (%) = Work performed (kcal⋅min−1) / energy expenditure (kcal⋅min−1) ⋅ 100.
Fat oxidation (g⋅min−1) = 1.695⋅\(\dot}\)O2 -1.701⋅\(\dot}\)CO2.
CHO oxidation (g⋅min−1) = 4.21⋅\(\dot}\)CO2 -2.962⋅\(\dot}\)O2.
Equation 1 where \(\dot}\)O2 and \(\dot}\)CO2 are in L⋅min−1.
To quantify the contribution of changes in metabolic energy expenditure (EE) and gross efficiency to the decrease in VT1 power output, for each participant the power output that would be attained using the rate of metabolic energy expenditure observed at VT1 in the last step test (i.e., before failure or the 6 h timepoint) and the GE at VT1 measured in the first step test (rested state) was calculated (lastEErestGE) (Stevenson et al. 2022). For each step test, metabolic EE and GE at VT1 were calculated using linear regression of power output vs. the EE or GE in the last minute of each step. Then, the proportion of prolonged exercise-induced changes in VT1 power output associated with changes in energetic efficiency and rates of metabolic energy expenditure achieved at the transition was calculated using the below equations (Eq. 2).
Contribution of change in energetic efficiency to change in power output at VT1 = (laststep – lastEErestGE)*100/ΔlastrestVT1.
Contribution of change in energetic efficiency to change in power output at VT1 = (lastEErestGE–restedstate)*100/ΔlastrestVT1.
Equation 2 where laststep = power output at VT1 in the last step test before task failure or reaching the 6 h timepoint; restedstate = power output at VT1 measured in the first step test; lastEErestGE = power output at VT1 that would be produced in the last step test assuming the gross efficiency observed at VT1 in the first step test; ΔrestlastVT1 = the difference between first and last step VT1 power output.
The metabolic cart was calibrated against known gas volumes and concentrations prior to the start of the trial. However, the metabolic cart was not recalibrated during the trial. While it is possible some calibration drift occurred, we do not anticipate that this meaningfully altered our primary outcome measures, which was VT1 as determined by breakpoints in the relationship between ventilatory equivalents and oxygen consumption during individual incremental tests, and initial substrate oxidation rates.
Statistical analysisData are expressed as mean ± standard deviation, unless otherwise stated. Statistical significance was inferred when p ≤ 0.05. The normality of datasets was assessed using the Shapiro–Wilk test. The effect of time on power output at VT1 was assessed with a repeated measures one-way analysis of variance, using the three timepoints recorded for all participants (rested state, 1 h, and the measurement preceding failure). Variance was located post-hoc using paired t tests. For each individual, the progression of power output at VT1 against time was fitted to linear, exponential, and second-order polynomial functions. For each VT1 measurement, the timepoint allocated was the time at the beginning of the incremental test. The curve with best model fit using the method of least squares (R2) was selected. These curves were used to estimate the time to a 5% reduction in power output at VT1 vs. the initial value (Δ5%VT1). The normality of these datasets was assessed. The relationship between Δ5%VT1 and TTTF was assessed using a Spearman’s rank-order (rs) correlation, and expressed with 95% confidence intervals. Bivariate relationships were also assessed between these variables (Δ5%VT1 and TTTF) and a selection of physiological variables measured in the first (\(\dot}\)O2peak, VT1, VT2, GE at VT1, the percentage of \(\dot}\)O2peak at which VT1 and VT2 occurred, PFO, RER and substrate oxidation rates at VT1) and second (RER and substrate oxidation rates during the first four stages of the initial incremental test) visits using Pearson’s product-moment correlations (r) or Spearman’s rank order correlations (rs), depending on normality. Post-hoc Bonferroni correction was used for the correlations including variables related to the first four stages of the initial incremental test of day 2 to reduce the risk inflating the overall chance of a type I error (Curtin and Schultz 1998). The magnitude of correlations was assessed using the following benchmarks: < 0.10, trivial; 0.10–0.29, small; 0.30–0.49, moderate; > 0.50, large (Cohen 1992). All data were analysed using SPSS version 29.0.1.0.
留言 (0)