
記住我

A retrospective cohort study of US women enrolled in commercial health insurance plans was conducted using administrative claims data from the Optum Research Database from January, 1, 2012, through February 29, 2020. The Optum Research Database is a large, US-based repository of administrative claims data for > 111 million enrollees representing all 50 states, Washington, DC, and Puerto Rico. IRB approval was not sought because this study is based on previously collected data and does not contain any studies with human participants or animals performed by any of the authors.
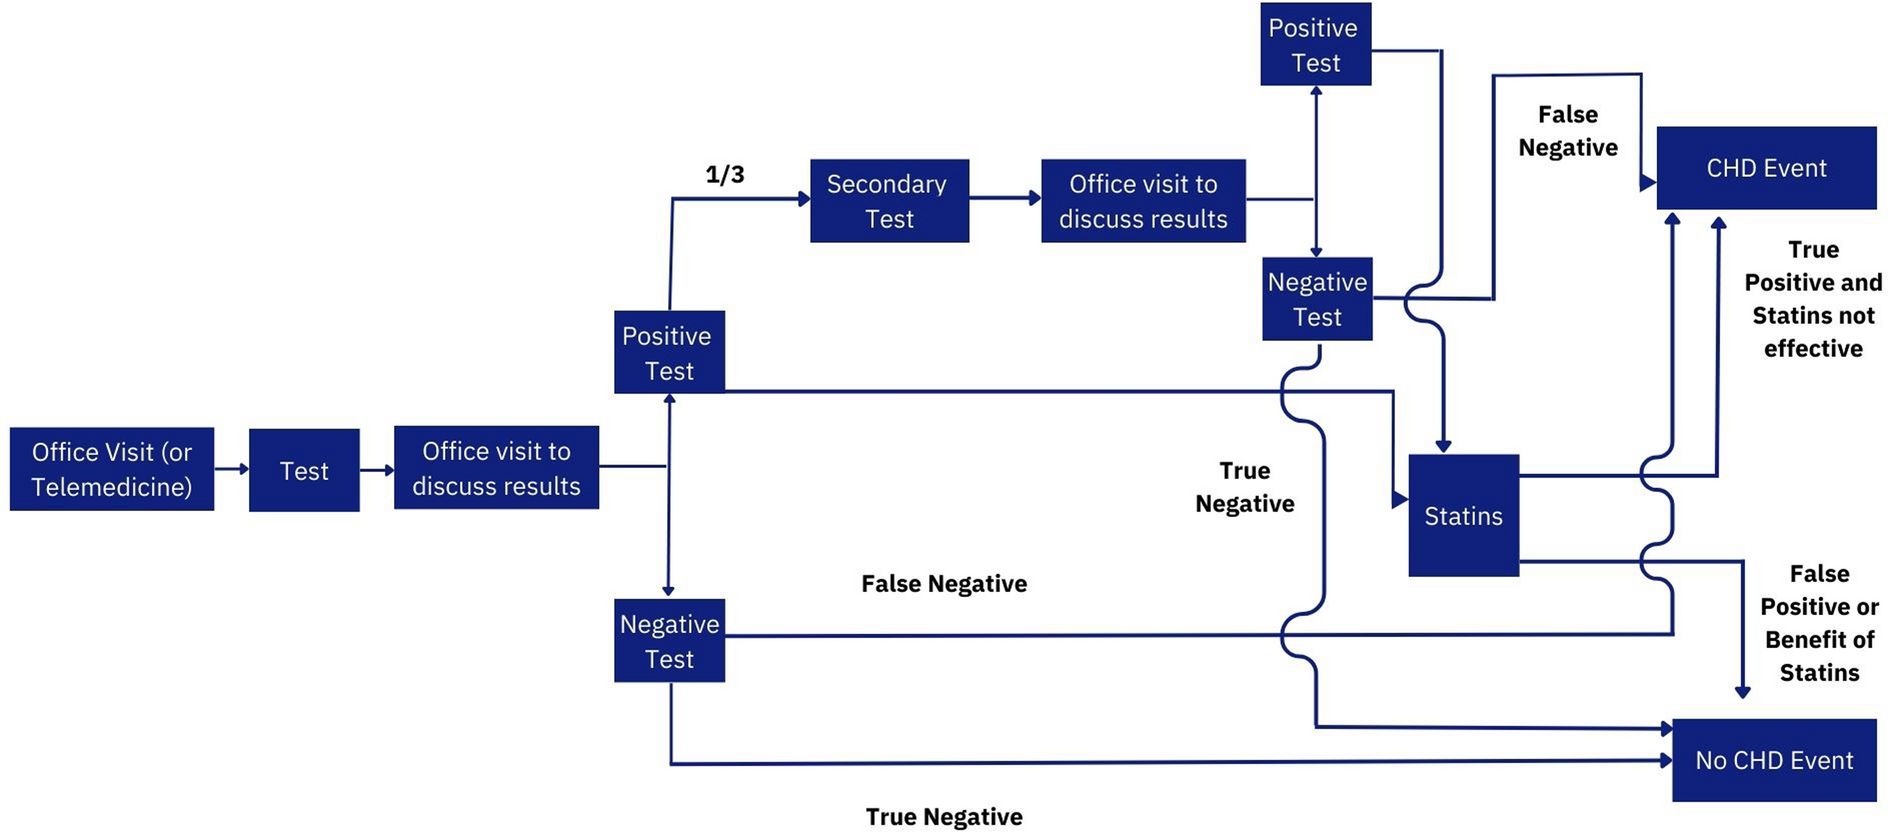
Women were included in the analysis population using the first medical claim with a diagnosis code for VMS (index claim) during the identification period (January 1, 2013, through September 1, 2018). The date of the index claim was the index date. The baseline period was 12 months prior to the index date during which demographic and clinical characteristics were examined. To define treated and untreated cohorts, a 6-month treatment assessment period starting on the index date was specified. The follow-up period was 12 months after the end of the treatment assessment period during which differences in all-cause HCRU and costs were assessed (Fig. 1).
Fig. 1
Study design. HCRU, healthcare resource utilization
VMS diagnosis claims were medical claims with International Classification of Diseases, 10th Revision, Clinical Modification (ICD-CM) codes in any position satisfying either of the following conditions during the identification period: (1) natural or surgical menopausal states (ICD-9-CM 627.2, 627.4/ICD-10-CM N95.1, E89.41) or (2) flushing (ICD-9-CM 782.62/ICD-10-CM R23.2) or hyperhidrosis (ICD-9-CM 780.08/ICD-10-CM R61) and ≥ 1 claim with diagnosis code for natural or surgical menopause or procedure code for surgical menopause on the same date or in the past 12 months. Females aged 40–63 years in the year of the index date who had ≥ 12 months of continuous enrollment in the health plan with medical and pharmacy benefits prior to index date and ≥ 18 months continuous enrollment starting on the index date were included. Women were excluded if they had missing or invalid demographic data; had any of the following claims in the baseline period: ≥ 1 VMS diagnosis claim, ≥ 1 VMS treatment claim, or a malignant solid tumor diagnosis claim; or had ≥ 1 pharmacy claim for an oral contraceptive or NuvaRing® (Organon; Jersey City, NJ, USA) during the treatment assessment period.
Cohort AssignmentCohorts (treated and untreated) were defined based on evidence of VMS treatment during the 6-month treatment assessment period after their VMS diagnosis date. Patients treated with a VMS treatment in the treatment assessment period were assigned to the treated cohort. VMS treatments included systemic HT, paroxetine 7.5 mg, selective serotonin reuptake inhibitor (SSRI; excluding paroxetine 7.5 mg), serotonin-norepinephrine reuptake inhibitor, clonidine, gabapentin, pregabalin, oxybutynin, and compounded estradiol pellet. Patients with no evidence of VMS treatment were assigned to the untreated cohort. The treated population was further divided into on- and off-label treatment subgroups for the secondary objective, which compared all-cause HCRU and costs for on-label-treated women with VMS and off-label-treated women with VMS versus untreated women with VMS (controls). We refer to the two products (HT and paroxetine mesylate 7.5 mg) approved for VMS by the Food and Drug Administration as on-label treatments. These were the only products approved for VMS during the study period. The following off-label treatments were included: clonidine, SSRIs (excluding paroxetine mesylate 7.5 mg), serotonin and norepinephrine reuptake inhibitors, gabapentin, pregabalin, oxybutynin, and compounded estradiol pellets. Each subgroup (i.e., on- or off-label treated) was compared with a propensity score (PS)-matched untreated control. All-cause HCRU and costs in each subgroup were analyzed using the same methods as described for the primary objective. Each analysis compared women who were treated for VMS to a matched control with VMS who did not receive treatment within the first 6 months of VMS diagnosis (i.e., the treatment assessment period) as depicted in Fig. 1.
OutcomesHCRU and costs (means and standard deviations) were summarized for the 12-month baseline and follow-up periods, and standardized differences (SDIFF) were estimated between cohorts (treated versus untreated, primary objective; on-label and off-label versus untreated, secondary objective). HCRU included office visits (i.e., traditional outpatient visits), hospital outpatient visits, emergency department (ED) visits, inpatient stays, and inpatient days. Costs included office, hospital outpatient, ED visit, inpatient stay, and pharmacy costs. Costs were adjusted using the annual medical care component of the Consumer Price Index to reflect inflation to year 2020 [10]. Total costs were estimated using all health plan and patient-paid medical costs (i.e., office, hospital outpatient, ED, inpatient, other medical costs) and pharmacy costs. Other medical costs included costs from services delivered at other venues, such as independent laboratory or radiology facilities, at the patient’s home, or by ambulance personnel.
Statistical AnalysisAll analyses were performed using SAS version 9.4 (SAS Institute, Cary, NC, USA). PS matching, a widely used method in observational studies for causal inference, was conducted to control for possible confounding of the association between outcomes and treatment status. Covariates included in the PS were baseline demographics (i.e., age, age category, geographic region, and index year), baseline conditions and comorbidity burden (i.e., hysterectomy, postmenopausal bleeding, Quan-Charlson Comorbidity Score, sleep disturbances, anxiety, depression, neuropathy, fibromyalgia, migraine, hypertension, and Agency for Healthcare Research and Quality comorbid conditions), baseline healthcare utilization (i.e., all-cause ambulatory visits, all-cause office visits, all-cause outpatient visits, flag for ER, and flag for inpatient stay), and baseline costs (i.e., all-cause ambulatory costs, all-cause pharmacy costs). After PS models were finalized, treated women were PS matched to untreated controls using a 1:1 ratio within strata of baseline hypertension status (yes or no) by the logit of their PS. A caliper width of 0.20 times the standard deviation (SD) of their logit was used [11]. Treated women for whom a match was not found were excluded from the post–PS-match analysis. The success of the matching procedure was evaluated by comparing the demographic and baseline characteristics between cohorts using the SDIFF. The SDIFF expresses the difference in means in units of the pooled standard deviation [12]. An SDIFF of < |10%| for a measure was considered as an acceptable threshold for balance between the treatment cohorts.
Following the matching procedure, descriptive analyses of HCRU and cost outcomes were performed. The conventional significance level of α = 0.05 was used for all comparisons; however, due to the large sample, the SDIFF was estimated with SDIFF ≥ |10%| representing a potentially meaningful difference and SDIFF < |10%| a small difference [12]. A generalized linear model (GLM) estimated the total cost of care ratio, representing the difference in 12-month follow-up costs between cohorts being compared. A GLM with gamma distribution and log link was specified, and Wald z-tests using robust standard errors were used to calculate P values. Adequacy of the model’s mean–variance relationship was evaluated using the modified Park test [13].
Inclusive LanguageIn our report, we use gender-specific language, as reflected in the referenced publications and protocols. However, we recognize that some individuals who experience vasomotor symptoms related to menopause may identify differently from gender and pronouns used in this article.
留言 (0)