
記住我
Laparoscopic liver resection (LLR) is a favorable alternative to open surgery due to shorter hospital stays and faster recovery times without compromising oncological outcomes.1–3 However, laparoscopy involves pneumoperitoneum production using a gas, typically carbon dioxide (CO2), which can cause embolism. Using transesophageal echocardiography (TEE), the incidence of CO2 embolism was 38% in robot-assisted laparoscopic radical prostatectomy,4 69% in laparoscopic cholecystectomy,5 and as high as 70% to 100% in LLR in animal models.6–9 Evidence shows that CO2 embolism during LLR increases the risk of mortality and postoperative complications, including pulmonary edema,10 cerebral infarction,11 shock,12 and cardiac arrest.13 LLR has a higher risk of CO2 embolism, particularly in cases of space-occupying liver lesions, because the risk of hepatic vein rupture and hepatic sinusoid exposure during the surgery increases the probability of CO2 entering the blood circulation,11 and hepatic veins drain directly into the inferior vena cava (IVC).
Reduced pneumoperitoneum pressure (PP) can relieve postoperative pain and decrease the risk of hepatorenal injury.14 Therefore, a low PP strategy (6–10 mm Hg) is recommended during laparoscopy.15 Although an experimental animal study has been conducted,16 no clinical studies have comprehensively described PP levels’ effects on the incidence of gas embolism during LLR.
TEE is the most sensitive method for detecting gas embolisms during surgery. Evidence demonstrates a strong correlation between TEE-derived IVC diameter and central venous pressure (CVP) in anesthetized mechanically ventilated patients.17 Approximately 80% of venous return to the right heart occurs through the IVC; thus the diameter varies depending on fluid status.17 Notably, the Distensibility Index of IVC (dIVC) is inversely correlated with CVP,18 but whether this is similar in laparoscopy remains unknown.19
Because prospective clinical trials are lacking, a definitive consensus on which pneumoperitoneum rate to use during laparoscopy is not available.20 Therefore, this study was designed to assess the effects of PP level on the incidence and severity of gas embolism using TEE during elective LLR, to evaluate postoperative recovery profiles, and to explore the correlation between dIVC and CVP.
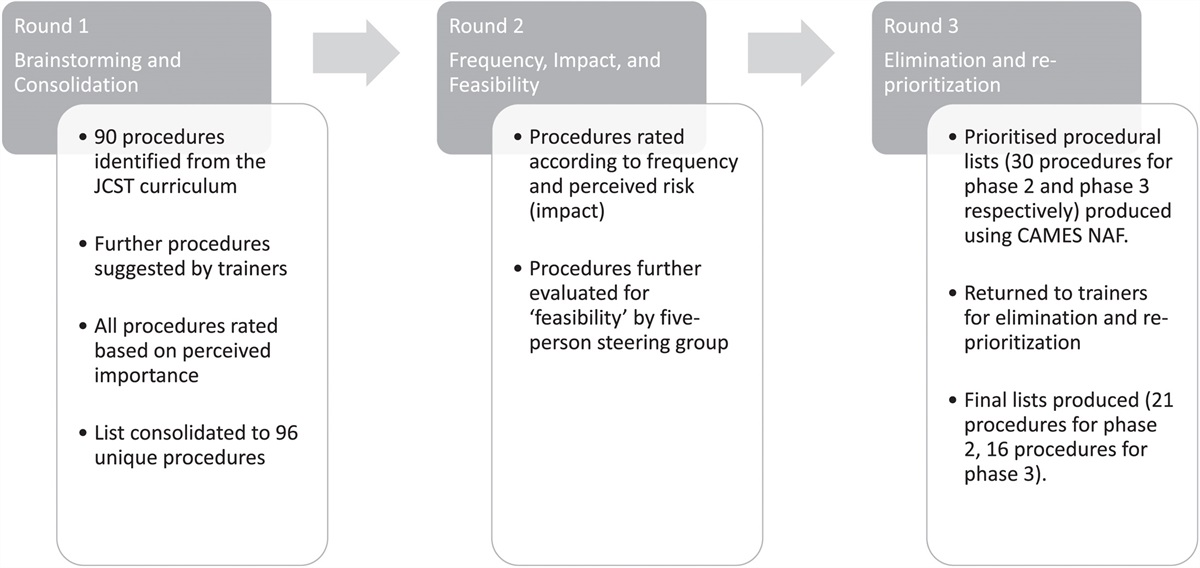
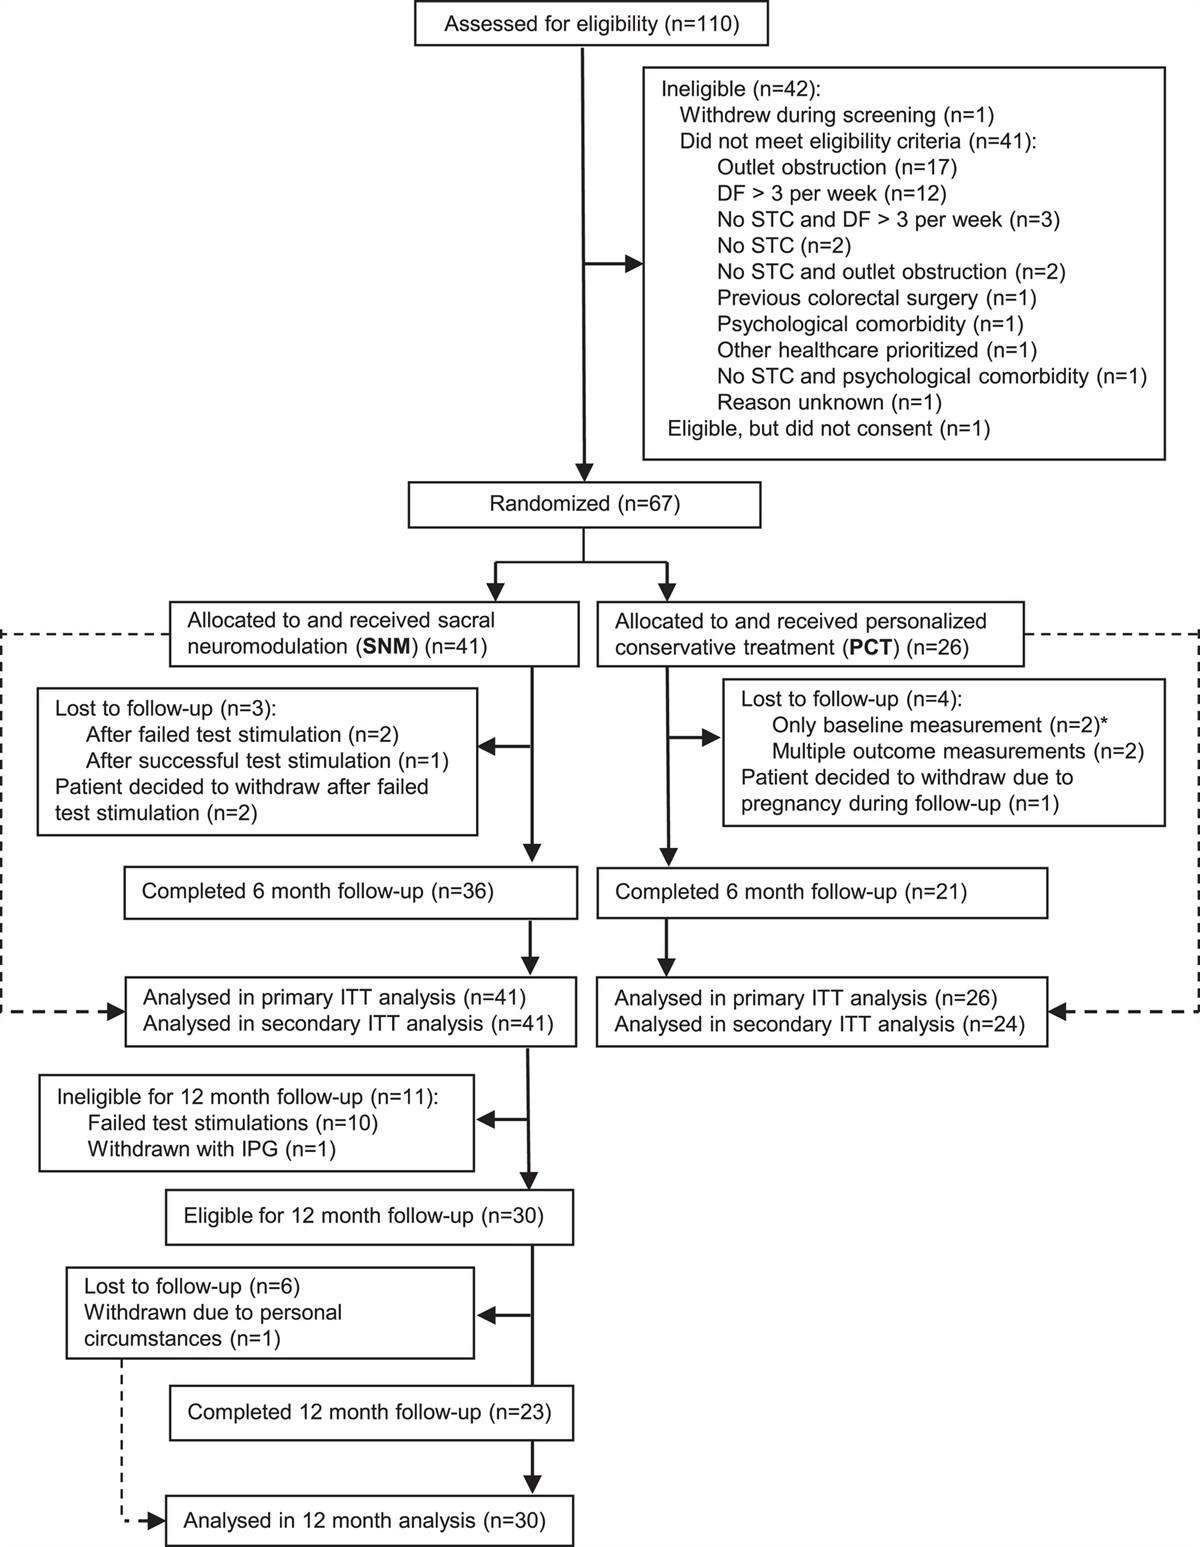
METHODS Study DesignThis parallel, dual-arm, double-blind, randomized controlled study was approved by the Ethics Committee of Zhongshan Hospital, Shanghai, China [approval number B2020-206(2)] and adheres to the ethical standards Helsinki Declaration of 1975. This study is registered in the Chinese Clinical Trial Registry (ChiCTR2000036396) and the protocol was published on November 15, 2021.21 It was performed at Zhongshan Hospital Fudan University in Shanghai. A total of 172 patients who underwent LLR between October 2020 and January 2022 were screened for study recruitment. Eligible patients were 18 to 75 years old who were scheduled for elective LLR under general anesthesia, with a body mass index between 18.5 kg/m2 and 30 kg/m2, and from whom written informed consent was obtained. Exclusion criteria were patients with acute coronary insufficiency, acute heart failure, severe renal failure (defined as creatinine clearance <30 mL/min or requiring renal replacement therapy), or preoperative shock (defined as the need for any vasoactive drugs before surgery), contraindications to use TEE (including perforated viscus, esophageal stricture, esophageal tumor, esophageal perforation or laceration, esophageal diverticulum, severe esophageal varices or active upper gastrointestinal bleed), a history of neuromuscular disease or abdominal cancer with adhesion, participation in other drug trials within the 30 days before enrollment, pregnancy or breast-feeding, inability to accurately express oneself, poor compliance, or failure to complete the Postoperative Quality of Recovery Scale (PostopQRS) and Visual Analog Scale (VAS) assessments, and participation refusal. In total, 141 participants were finally recruited and randomly assigned to the low PP group (PP = 10 mm Hg) or standard PP group (PP = 15 mm Hg; Fig. 1).
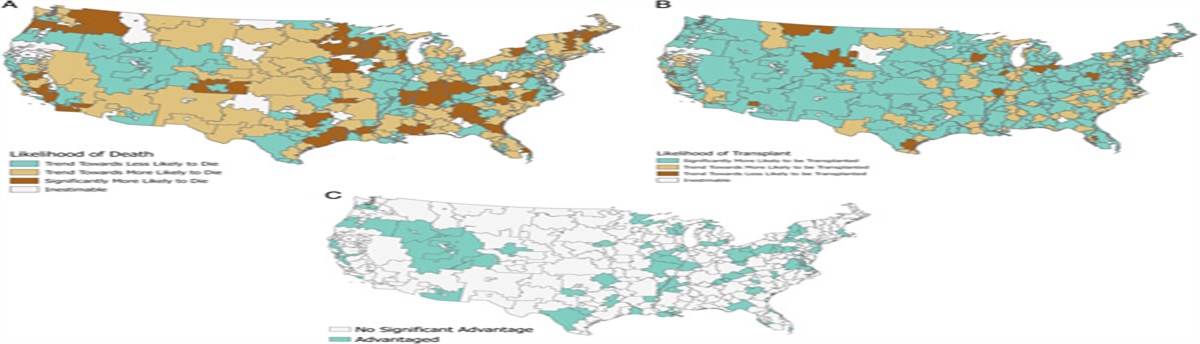
 FIGURE 1:
 Flowchart of patient recruitment. “a” indicates PostopQRS and VAS tests.
Randomization and BlindingRandomization was conducted using a dedicated, password-protected, and secure socket layer (SSL-encrypted) website (edc.fudan.edu.cn). Each patient was assigned a participant and randomization number. The allocation sequence, with a 1:1 allocation ratio per group, was generated using a minimization algorithm stratified according to the risk of intraoperative exposure of the hepatic vein, liver cirrhosis, and history of abdominal surgery. The surgeons, outcome assessors (including TEE monitoring), and physicians responsible for the follow-ups were blinded, but the anesthetists who were responsible for the possible treatment of gas embolism were not blinded to the treatment allocation. Unblinding was allowed when severe gas embolism occurred with severe deterioration of vital signs.
Trial InterventionsTo avoid confounding factors, routine perioperative anesthesia care was performed according to the clinical routine of Zhongshan Hospital, Fudan University. All surgeries were performed by one surgical team. After fasting for 6 to 8 hours, general anesthesia was induced using propofol [(2.0–2.5 mg/kg, intravenous (iv); AstraZeneca], sufentanil (0.3–0.5 μg/kg, iv; Humanwell Healthcare), and cisatracurium (0.2 mg/kg, iv; Jiangsu Hengrui Medicine), and maintained using total inhalation anesthesia. A TEE (GE VENUE R2) probe was inserted into the esophagus after induction to detect the occurrence of gas embolism for the surgery duration. Regional cerebral oxygen saturation (rScO2) was detected using cerebral near-infrared spectroscopy (Cerebral/Somatic Oximeter, 5100C, Covidien). An infusion was performed through a peripheral venous line to reduce possible interference in gas embolism evaluation. PP was set at 10 (low) or 15 (standard) mm Hg throughout the surgery according to group allocation. CVP was expected to be maintained throughout the surgery at 5 ± 2 mm Hg. Dobutamine (1–3 μg/kg/min) was administered as necessary to maintain a low CVP. Patients underwent cisatracurium-induced deep neuromuscular blockade with a train of four = 0 and posttetanic count ≥1. Treatment of severe gas embolism during surgery included minute ventilation increase, sufficient oxygen supply, posture change, and appropriate fluid supplement if necessary. When severe gas embolism along with significant changes in vital signs occurred, the treatment was consistent with our previous case report22 and the surgeons would be informed. Patients who developed hypotension, defined as mean arterial pressure (MAP) <65 mm Hg, were administered a bolus dose of 6 mg of ephedrine and repeated up to 5 times, after which noradrenaline was administrated. Lastly, nalmefene and neuromuscular blockade reversal agents were administered, if necessary.
Surgical TechniqueThe LLR in this study was performed using a pure laparoscopic technique, excluding hand-assisted laparoscopic resection or working incisions. Firstly, a blunt trocar was used to establish pneumoperitoneum on the abdominal wall, followed by laparoscopic exploration. Generally, 3 ports were used for the operation initially, and then 1 to 2 additional ports were added, if necessary, based on the location of the tumor. Usually, before liver resection, a tape was placed around the hepatic pedicle in case to perform an intermittent Pringle maneuver. During LLR, the intermittent Pringle maneuver was used in some cases (blocking hepatic blood flow for 15 minutes each time, with 5-minute intervals for rest). Parenchymal separation was achieved by an energy device (Ethicon Harmonic scalpel HARH36, Eithcon). Small branches of the Glisson pedicles were clipped using Hem-o-lok ligating clips and Titanium clips. However, when dealing with the main hepatic pedicle (left, right anterior, and right posterior) or the main hepatic vein vessels, an endoscopic linear stapler was used (Ethicon Endopath EC60A, Eithcon).
OutcomesThe primary outcome was the incidence of severe gas embolism [defined as gas embolism ≥ grade 3 in the right atrioventricular system from the mid-esophageal 4 or 5-chamber view detected by TEE during surgery and according to the Schmandra microbubble method:8 grade 0, no bubbles observed in the right atrioventricular system; grade 1, single scattered gas bubbles observed in right atrium (RA), right ventricle (RV), or right ventricular outflow tract (RVOT); grade 2, multiple bubbles observed, but occupying <50% RA, RV, or RVOT diameter; grade 3, multiple bubbles observed, occupying >50% RA, RV, or RVOT diameter; grade 4, bubbles occupying the whole RA, RV, or RVOT].
The secondary endpoints were (1) duration of gas embolism ≥ grade 3, (2) total incidence of gas embolism (grade 1–4), (3) vital changes during gas embolization episodes, including the occurrence of an abrupt end-tidal carbon dioxide (ETCO2) partial pressure decrease ≥5 mm Hg, a sudden decrease in MAP >20 mm Hg, abnormal rScO2 (defined as a decrease in rScO2 >15% compared with baseline or rScO2 <50%), peripheral oxygen saturation (SpO2) <90%, or changes in SpO2, heart rate (HR), MAP, and arterial lactate, (4) hyperlactatemia (>2 mmol/L) at the end of severe gas embolism, (5) hypotension (MAP <65 mm Hg) and hypoxia (SpO2<90% lasting at least 1 minute) during surgery, (6) surgeon satisfaction scores (5 point Likert scale, where 1: “very poor” and 5: “excellent”), (7) quality of in-hospital recovery, based on the PostopQRS scores before surgery, in the post-anesthesia care unit, on postoperative day (POD) 1, and POD3 to assess physiological, nociceptive, emotional, cognitive, and functional recovery domains (compared with baseline values; overall recovery meant recovery in all domains), VAS scores on POD1, unexpected intensive care unit admission, postoperative pulmonary in-hospital complications and length of hospital stay, (8) the 30-day and 90-day follow-up profiles, including unexpected readmission (defined as unscheduled readmission to hospital within 30 days of discharge), number of hospital-free days at day 28, postoperative complications within 30 days (classified according to the classification described by Dindo et al23), and 90-day survival, and (9) correlations between intraoperative CVP and dIVC [(IVCmax−IVCmin)/IVCmin, which was the difference between the maximum inspiratory diameter and minimum expiratory diameter divided by the minimum inspiratory diameter in intubated patients during LLR].18
Statistical AnalysesAccording to our preliminary results, the incidence of severe gas embolism in LLR at low and standard PP rates was 45% and 69%, respectively, similar to the previous reports.4–6 To detect a 24% absolute reduction in the incidence of gas embolism with 80% power and a 2-sided significance level of 5%, 63 patients were required in each arm. To allow for a 10% dropout rate, a total of 140 patients were required.
After randomization, all patients were included in the analyses according to the intention-to-treat principle. A sensitivity analysis was performed for the primary outcome using a per-protocol set (patients converting to open surgery were excluded).
Normally distributed continuous outcomes determined by D’Agostino’s K-squared test are reported as mean (SD) and tested using the Student t test. Non-normally distributed data are reported as median (interquartile range) and tested using the Wilcoxon rank-sum test. Binary outcomes are reported as frequencies (%) and tested using the χ2 test. The risk ratio (RR) and 95% CI were calculated using the Wald test. Univariate logistic regression analysis was used to analyze the effects of PP and CVP gradient on the primary outcome. Pearson correlation was used to calculate the relationship between the dIVC and CVP, and the Z-test was used to compare the correlation coefficients between the groups. Analysis of covariance was performed to assess between-group differences from baseline over time, with baseline as a covariate. All outcomes were considered exploratory; thus no corrections were made for multiple comparisons.
The treatment effects on the incidence of gas embolism were analyzed according to prespecified and post hoc subgroups. Prespecified subgroups: (1) plan for hepatic vein exposure, (2) the presence or absence of liver cirrhosis before surgery, and (3) with or without a history of abdominal surgery. Post hoc subgroups: (1) space-occupying liver lesion location, (2) liver resections adjacent to the second hepatic hilus or not, (3) liver resection difficulty, and (4) hepatic inflow occlusion implementation. The heterogeneity of the effect across each subgroup was analyzed using the treatment × subgroup interaction term added to the corresponding logistic regression model.
All statistical tests were 2-tailed and P ≤0.05 was considered statistically significant. All analyses were performed using R version 4.2.1 (R Core Team).
RESULTS Patients and Baseline CharacteristicsA total of 141 patients were enrolled and randomly assigned to group L (PP, 10 mm Hg; n = 71) or group S (PP, 15 mm Hg; n = 70). All patients, including 1 patient in group L and 2 patients in group S who converted to open surgery because of bleeding, were included in the analysis (Fig. 1). The baseline characteristics between groups were balanced, including demographics, preoperative laboratory tests, liver fibrosis status, history of surgery, space-occupying liver lesion characteristics, liver resection type and difficulty,24 and surgery duration (Supplemental Digital Content Table 1, https://links.lww.com/SLA/E921).
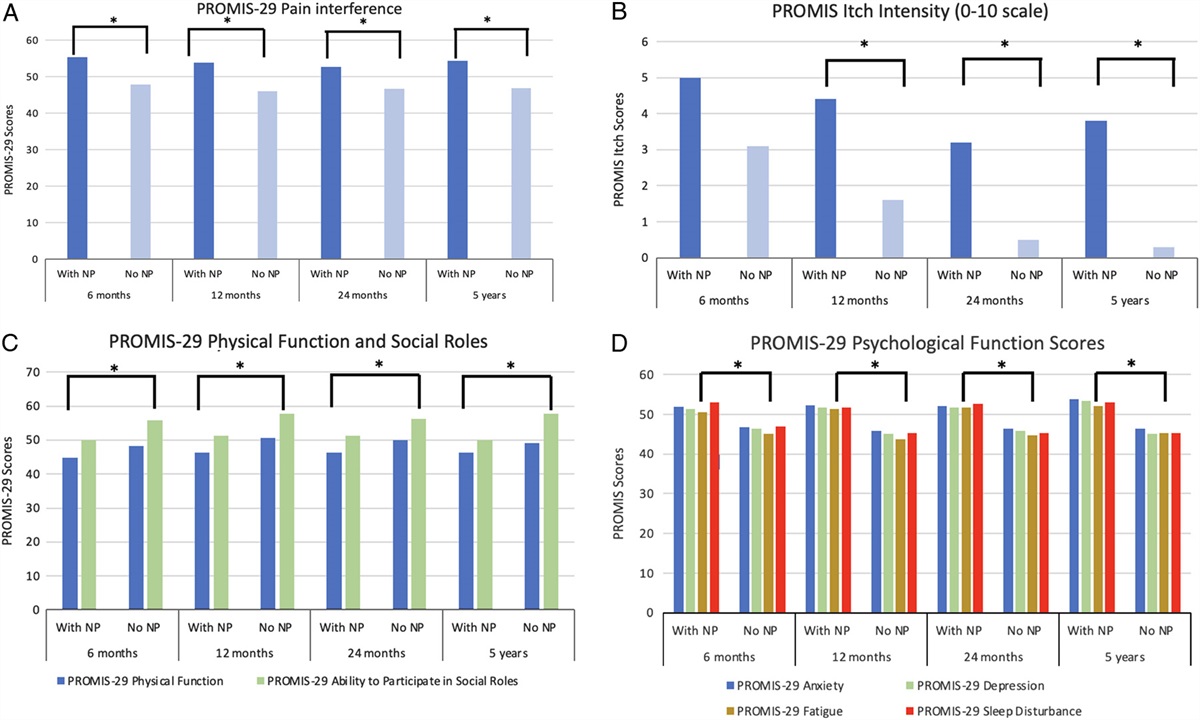
Perioperative VariablesA group comparison of perioperative variables is shown in Table 1. No significant group differences were found in hepatic inflow occlusion length (P = 0.152), hepatic inflow occlusion (Fig. 2A) recipients (P = 0.951), intraoperative hepatic vein exposure and injuries (Fig. 2B; P = 0.123), or vessel sealing system use (P = 0.577) during surgery. The mean peak airway pressure was 16.85 cm H2O in group L and 18.09 cm H2O in group S [treatment difference, −1.25 (95% CI: −2.13, −0.36); P=0.006]. The mean CVP was comparable between both groups (P = 0.851). Although the PP-CVP gradient was lower in group L than in group S (P < 0.001), the univariate logistic regression analysis showed that the PP-CVP gradient did not affect the occurrence of severe gas embolism [odds ratio, 1.07 (95% CI: 0.96, 1.20); P = 0.216]. During surgery, fewer fluids [treatment difference, 166.40 (95% CI: 38.59, 294.21); P = 0.011] and ephedrine dosages [treatment difference, 2.88 (95% CI: 0.49, 5.26); P = 0.019] were needed in group L than in group S. No group differences in the consumption of opioids, sufentanil (P = 0.589) and hydromorphone (P = 0.111), for postoperative analgesia were found.
TABLE 1 - Perioperative Variables Group L (10 mm Hg; n = 71); n (%) Group S (15 mm Hg; n =70); n (%) P Hepatic inflow occlusion 47 (66.2) 47 (68.1) 0.951 Length of hepatic inflow occlusion (min); median (IQR) 16.00 (0.00, 30.00) 18.00 (0.00, 40.00) 0.152 Intraoperative hepatic vein exposure 0.141 Hepatic vein branch exposure 20 (28.2) 21 (30.0) — Hepatic vein branch rupture 12 (16.9) 21 (30.0) — Use of vessel sealing system 18 (25.4) 14 (20.0) 0.577 Peak airway pressure (cm H2O); mean (SD) 16.85 (2.76) 18.09 (2.54) 0.006* CVP (mm Hg); mean (SD) 4.36 (1.84) 4.30 (1.70) 0.851 PP-CVP gradient; mean (SD) 5.64 (1.84) 10.70 (1.70) <0.001* Total fluids (mL); mean (SD) 1097.89 (370.18) 1264.29 (397.10) 0.011* Urine output (mL); median (IQR) 150.00 (100.00, 200.00) 100.00 (100.00, 200.00) 0.973 Estimated blood loss (mL); median (IQR) 100.00 (50.00, 100.00) 50.00 (50.00, 115.00) 0.956 Blood transfusion 1 (1.4) 0 1.000 Vasoactive drugs Ephedrine (mg); mean (SD) 9.30 (5.81) 12.17 (8.30) 0.019* Noradrenaline 3 (4.2) 4 (5.7) 0.985 Dobutamine 5 (7.0) 8 (11.4) 0.543 Sodium bicarbonate 4 (5.6) 4 (5.7) 1.000 Intraoperative use of narcotic drugs Propofol (mg); median (IQR) 150.00 (122.50, 190.00) 150.00 (140.00, 177.50) 0.725 Sufentanil (ug); median (IQR) 40.00 (30.00, 45.00) 40.00 (35.00, 50.00) 0.156 Cisatracurium (mg); mean (SD) 24.48 (10.76) 22.60 (13.75) 0.367 Nalmefene 13 (18.3) 16 (22.9) 0.646 Neuromuscular blockade reversal 53 (74.6) 54 (77.1) 0.881 Dosage of postoperative opioid analgesics Sufentanil (ug); median (IQR) 64.00 (48.00, 106.00) 61.50 (0.00, 109.00) 0.589 Hydromorphone (mg); median (IQR) 0.00 (0.00, 0.00) 0.00 (0.00, 1.68) 0.111Data were presented as mean (SD) tested with the Student t test, median (IQR) tested with the Wilcoxon rank-sum test, or frequency (percentage) tested with the χ2 test, as appropriate.
PP-CVP gradient represents the difference between pneumoperitoneum pressure and central venous pressure.
*P < 0.05.
IQR indicates interquartile range.
 FIGURE 2:
 Representative images and patients’ vital signs during LLR. A, Pringle’s maneuver for inflow occlusion. B, Intraoperative hepatic vein exposure and injury. C, Grade 3 gas embolism. D, Grade 4 gas embolism. E. HR. F, MAP. G, SpO2. H, ETCO2. I, rScO2 (left brain). J, rScO2 (right brain). K, Systolic EI. L, Diastolic EI before anesthesia (T1), after anesthesia induction (T2), after trocar insertion (T3), at the beginning of hepatic parenchymal transection (T4), during hepatic parenchymal transection (T5), after liver lesions removal (T6), after completion of the surgery (T7). HR, MAP, SpO2, ETCO2, rScO2 (left brain), rScO2, systolic and diastolic EI were tested with analysis of covariance, with baseline as a covariate. *P<0.05; **P<0.01.
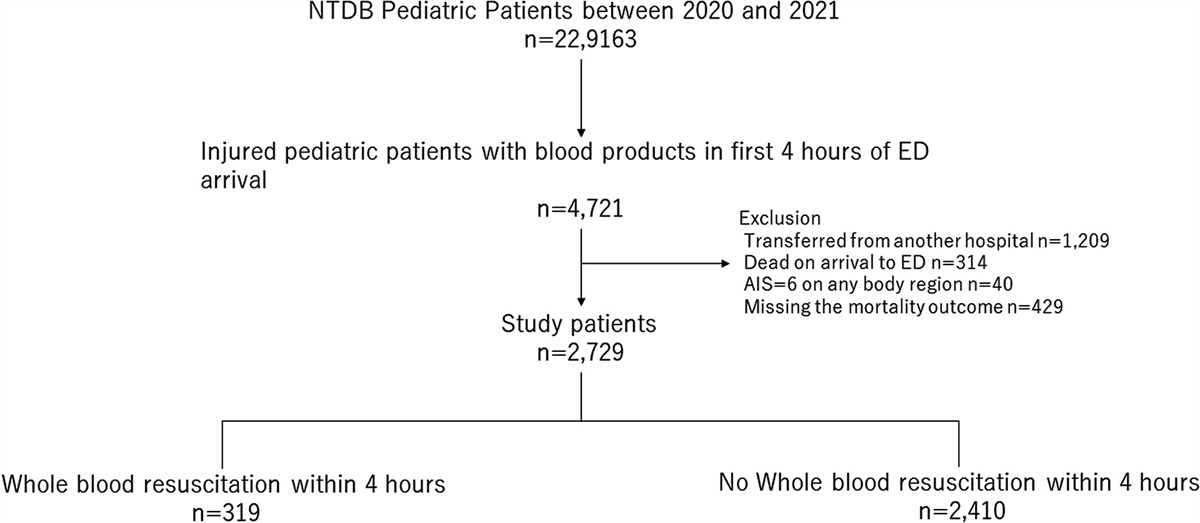
Primary OutcomeForty-seven patients (67.1%) developed severe gas embolism in group S, whereas 29 patients (40.8%) in group L [risk difference, −26% (95% CI: −41%, −10%); RR, 0.61 (95% CI: 0.44, 0.85); P = 0.003, Table 2]. Representative TEE images of the severe gas embolism are shown in Figures 2C, D. Sensitivity analyses also showed that the PP level was a risk factor for severe gas embolism (Supplemental Digital Content Table 2, https://links.lww.com/SLA/E921). Subgroup analyses of PP levels and the occurrence of severe gas embolisms are shown in Figure 3. The lack of treatment-subgroup interactions indicated that there was no statistical association between PP and the subgroups, except the subgroup of resections adjacent versus nonadjacent to the second hepatic hilus (interaction P = 0.038). Low PP appeared to particularly benefit resections adjacent to the second hepatic hilus in terms of the incidence of severe gas embolism (Fig. 3).
TABLE 2 - Primary and Secondary Endpoints for Participants Group L (10 mm Hg; n = 71) Group S (15 mm Hg; n = 70) P Primary outcome Gas embolism ≥ grade 3 29 (40.8) 47 (67.1) 0.003* Risk difference (95% CI) −0.26 (−0.41 to −0.10) — — RR (95% CI) 0.61 (0.44 to 0.85) — — Secondary outcomes Duration of gas embolism ≥ grade 3 (s); mean (SD) 77.83 (172.25) 191.69 (296.15) 0.006* Total gas embolism (grade 1–4) 64 (90.1) 67 (95.7) 0.337 Changes during gas embolization episodes Abrupt ETCO2 decrease ≥5 mm Hg 10 (14.1) 28 (40.0) 0.001* Sudden decrease in MAP >20 mm Hg 2 (2.8) 6 (8.6) 0.266 The occurrence of a decrease in rScO2 >15% baseline or rScO2 <50% 2 (2.8) 0 0.497 The occurrence of SpO2 <90% 1 (1.4) 2 (2.9) 0.990 Changes in SpO2† (%); median (IQR) 0.00 (−1.00, 0.00) −2.00 (−3.00, 0.00) 0.024* Changes in HR‡ (beats/min); median (IQR) 2.00 (−2.50, 11.00) 7.50 (3.00, 14.00) 0.034* Changes in MAP‡ (mm Hg); median (IQR) 0.00 (−3.17, 7.00) 1.00 (−4.92, 8.00) 0.914 Changes in arterial lactate§ (mmol/L); mean (SD) 0.79 (0.58) 1.26 (0.87) 0.010* Hyperlactatemia (>2 mmol/L) at the end of severe gas embolism 8 (11.27) 23 (32.86) 0.093 MAP <65 mm Hg during the surgery 6 (8.5) 15 (21.4) 0.054 SpO2 <90% lasts for >1 min during the surgery 1 (1.4) 2 (2.9) 0.990 Satisfaction scores of surgeon; mean (SD) 4.07 (0.70) 4.26 (0.58) 0.088 Overall recovery according to PostopQRS on POD3 9 (12.6) 4 (5.7) 0.255 VAS on POD1 2.86 (1.29) 2.67 (1.34) 0.398 Unexpected ICU admission 1 (1.4) 1 (1.4) 1.000 Postoperative pulmonary complications in hospital 23 (32.4) 31 (44.3) 0.201 Length of hospital stay(d); mean (SD) 5.9 (2.26) 6.26 (1.98) 0.319 Unexpected readmission within 30 d 0 1 (1.4) 0.497 Hospital-free days at day 28 (d); mean (SD) 22.10 (2.24) 21.62 (2.19) 0.207 Postoperative complications within 30 d 0.309 Grade I 11 (15.7) 15 (21.4) — Grade II 0 1 (1.4) — Grade III 2 (2.9) 1 (1.4) — Grade IV 0 1 (1.4) — Data were frequency (percentage) unless stated otherwise. The statistical methods were the same as in Table 1.*P < 0.05.
†Defined as a difference from the time point before the occurrence of severe gas embolism to the most significant change point during severe gas embolization episodes.
‡Defined as a difference between the occurrence of gas embolism ≥ grade 3 and the previous time point.
§Defined as changes in arterial lactate from the preoperational stage to the end of the severe gas embolism.
ICU indicates intensive care unit; IQR, interquartile range.
 FIGURE 3:
 The prespecified and post hoc subgroup analyses of PP and the incidence of gas embolism ≥ grade 3. Treatment × subgroup interactions were tested with logistic regression.
Secondary OutcomesThe mean duration of severe gas embolism was significantly shorter in group L than in group S [treatment difference, −113.85 (95% CI: −194.40, −33.32); P = 0.006]. The incidence of all gas embolism levels was similar between the two groups (P = 0.337). Fewer patients had an abrupt decrease in ETCO2 during gas embolization episodes in group L [n = 10, 14.1% vs n = 28, 40.0%, treatment difference, −26% (95% CI: −39%, −11%); RR, 0.35 (95% CI: 0.19, 0.66); P = 0.001, Table 2]. No differences were found in the occurrence of SpO2 <90% (P = 0.990), sudden decrease in MAP >20 mm Hg (P = 0.266), or abnormal rScO2 (P = 0.497) during gas embolization episodes between the two groups (Table 2). However, compared with group S, group L had less increases in HR when severe gas embolisms were first detected by TEE [treatment difference, −4.90 (95% CI: −9.24, −0.57), P = 0.034, Table 2], less reductions in SpO2 from the time point before the occurrence of severe gas embolism to the most significant change point during severe gas embolization episodes [treatment difference, 0.98 (95% CI: 0.51, 2.48), P = 0.024, Table 2]. Group L also had less increases in arterial lactate from the preoperational stage to the end of the severe gas embolism [treatment difference, −0.47 (95% CI: −0.87, −0.07), P = 0.010, Table 2]. Moreover, the incidence of hyperlactatemia at the end of severe gas embolism was similar between both groups (P = 0.093).
The incidence of hypoxia (P = 0.990) and hypotension (P = 0.054) during surgery was similar between both groups (Table 2). The increases from baseline to the end of hepatic parenchymal transection in PaO2 were greater in group L than in group S (P = 0.040, Supplemental Digital Content Table 3, https://links.lww.com/SLA/E921). During hepatic parenchymal transection, SpO2 was lower, whereas HR and systolic Eccentricity Index (EI) were higher in group S than those in group L (P = 0.004, 0.034, and 0.015, respectively, Figs. 2E, G, K). Systolic EI remained higher in group S than in group L after liver lesion removal (P = 0.046, Fig. 2K). The probability of recovery evaluated using the PostopQRS on POD1 and POD3 were comparable, except in the emotion domain on POD1, which was lower in group L than in group S (P = 0.035; Supplemental Digital Content Figs. 1A–F, https://links.lww.com/SLA/E921, Table 2). No significant difference in VAS scores on POD1 was observed (P = 0.398, Table 2). The reduction in baseline serum globulin levels to POD1 (P = 0.033) and POD3 (P = 0.031) in group L was less prominent than those in group S (Supplemental Digital Content Table 4, https://links.lww.com/SLA/E921). No significant difference was found between the two groups in the surgeon satisfaction scores (P = 0.088). Unexpected intensive care unit admission (P = 1.000), incidence of postoperative pulmonary in-hospital complications (P = 0.201), length of hospital stay (P = 0.319), unexpected readmission (P = 0.497), hospital-free days by day 28 (P = 0.207), and postoperative complications within 30 days (P = 0.309) were comparable between both groups (Table 2). Notably, one patient in group S developed an unexpected cerebral infarction within 30 days after surgery.
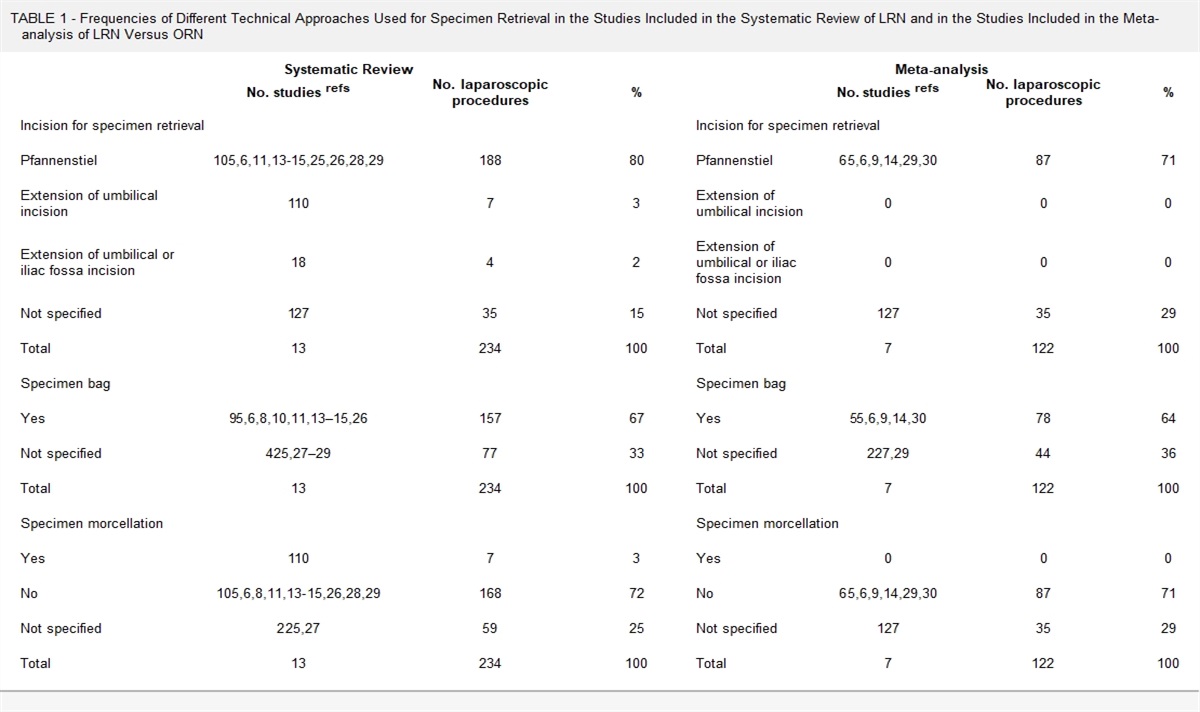
The dIVC negatively correlated with the CVP immediately after anesthesia induction, after trocar insertion, at the beginning of hepatic parenchymal transection, during hepatic parenchymal transection, after liver lesion removal, and at the end of surgery in both groups (P < 0.01, Fig. 4). No significant group difference in correlation strength at each time point was noted (P > 0.05, Fig. 4).
 FIGURE 4:
 Correlation analysis of dIVC and CVP at different time points. A, After anesthesia induction. B, After trocar insertion. C, At the beginning of hepatic parenchymal transection. D, During hepatic parenchymal transection. E, After liver lesions removal. F, After completion of the surgery. Data were tested with Pearson correlation and the Z-test. r indicates Pearson correlation coefficient; R 2, coefficient of determination.
DISCUSSIONTo the best of our knowledge, this study is the first prospective randomized controlled clinical trial to compare the effect of low PP (10 mm Hg) with standard PP (15 mm Hg) on the occurrence of gas embolism during elective LLR and provide evidence to a future consensus on PP levels adopted in laparoscopy. We found that low PP had clear advantages in terms of reduced risk and duration of severe gas embolism. In addition, patients with low PP had lower incidences of abrupt decreases in ETCO2, fewer increases in HR, fewer reductions in SpO2 during gas embolization episodes, and fewer increases in arterial lactate after the end of severe gas embolism than those with standard PP. Oxygenation was superior and hemodynamics were steadier in patients with low PP than in those with standard PP during LLR. However, postoperative recovery quality assessed by PostopQRS in the hospital was similar between both groups. Moreover, dIVC was inversely correlated with CVP throughout surgery at both PP levels.
In anesthetized patients, severe gas embolism may manifest as an acute decrease in ETCO2, a decrease in SpO2, deterioration of the hemodynamics, electrocardiogram changes, or even death.13,25 We found that the occurrence of obvious clinical manifestations during the severe gas embolization episodes was lower in both groups, in contrast to the relatively high rates of severe gas embolism in our study. Our study reported a relatively higher incidence of gas embolism than previous studies1,2, which may be related to the use of TEE, which can detect gases as small as 0.02 mL/kg, rather than recording episodes of gas embolism according to clinical manifestations. Scatter bubbles can be detected not only at the surgical site, and during trocar insertion and removal, but also during fluid infusion, which can also contribute to microbubbles formation in the RA and RV. To reduce the influence of fluid infusion on our outcomes, the peripheral vein was used instead of the central vein during surgery and our primary outcome did not include gas embolism lower than grade 3. However, it should be mentioned that the vast majority of gas embolisms are clinically irrelevant.
History of abdominal surgery,26 preoperative anticipation of possible intraoperative venous injury,22 and liver cirrhosis27 have been reporte
留言 (0)