
記住我
Cable bacteria are filamentous, sulfur-oxidizing bacteria that thrive in marine and freshwater sediments worldwide (Malkin et al., 2014; Risgaard-Petersen et al., 2015). Cable bacteria stand out among the prokaryotes as they have the unique capability to efficiently transport electrons over distances spanning up to several centimeters (Nielsen et al., 2010; Pfeffer et al., 2012; Bjerg et al., 2018; Meysman et al., 2019). This long-distance electron transport (LDET) runs through a network of protein fibers that are embedded in the periplasm (Cornelissen et al., 2018). These fibers run in parallel and continuously along the full length of cable bacterium filaments and act like a network of electrical power lines (Meysman et al., 2019). The fibers display an unprecedented electrical conductivity for a biological material exceeding 100 S/cm and thus present a promising material for the future development of sustainable, lightweight, and biodegradable electronics (Meysman et al., 2019; Boschker et al., 2021).
The nature and composition of the highly conductive protein fibers in cable bacteria is currently poorly understood. Recent analyses indicate that the protein fibers are ~50 nm in diameter (Cornelissen et al., 2018), and consist of a conductive core enveloped by an insulating protein layer (Boschker et al., 2021). The conductive core harbors a metalloprotein with a sulfur-coordinated nickel (Ni) cofactor (Boschker et al., 2021). The presence of Ni is remarkable since biological electron transport through protein structures is thought to be exclusively mediated by copper and iron. All currently known metalloproteins involved in multi-step electron hopping through proteins feature redox centers that include either Fe-containing (e.g., heme groups, Fe-S clusters) or Cu-containing domains (e.g., cupredoxin), but never Ni-containing cofactors (Liu et al., 2014). Still, microorganisms do produce Ni-based metalloproteins, which are considered ancient archaeal and bacterial enzymes that evolved in the Archean when the earth’s atmosphere was devoid of oxygen. However, all currently known Ni metalloproteins serve metabolic functions that are different from electron transport, typically catalyzing reactions involving gases like hydrogen (NiFe hydrogenase), carbon monoxide (CO dehydrogenase), or oxygen (Ni superoxide dismutase; Alfano and Cavazza, 2020; Fontecilla-Camps, 2022). Therefore, it appears cable bacteria have evolved a unique cofactor in order to sustain an exceptional form of long-range electron transport. However, the molecular structure of this cofactor remains unclear.
Raman spectroscopy provides a non-destructive way of obtaining structural information about biomolecules and has been applied extensively to elucidate the structure of metal cofactors (Shiemke et al., 1983; Han et al., 1989; Hu et al., 1993; Garton et al., 1997; Fiedler et al., 2005; Shafaat et al., 2012). In classical Raman spectroscopy, molecules are irradiated with a monochromatic light source and inelastically scattered photons are detected, which are characteristic of molecular vibrations and thus provide a structural fingerprint of molecules (Ferraro et al., 2003; Nakamoto, 2008). Yet, inelastic scattering is a rare event and yields a low signal intensity. Therefore, in resonance Raman spectroscopy, one tunes the wavelength of a laser source to coincide with an electronic transition of a chromophore group in the target molecule. According to the Kramers-Kronig relations, an increase in absorption, described by the real part of the molecule’s complex dielectric function, yields a proportional increase in the imaginary part of the dielectric function, and consequently, the Raman scattering efficiency (Hassing and Sonnich Mortensen, 1980). So, by carefully choosing the wavelength, one can selectively enhance the signals of certain Raman-active modes within the molecule by a factor of up to 106 (Ferraro et al., 2003; Nakamoto, 2008). This way, resonance Raman scattering facilitates the detection of biomolecules at low concentrations in single bacterial cells. Moreover, metal cofactors often exhibit electronic transitions in the visible range of the electromagnetic spectrum, making them prime candidates to study with resonance Raman spectroscopy (Czernuszewicz, 1993).
Here, we employ Raman microscopy with multiple laser wavelengths to analyze the biochemical make-up of cable bacterium cells and to study the broad Raman response of the Ni-cofactor. Previously, it has been shown that cable bacteria produce a unique Raman fingerprint attributed to distinct vibrational modes in the Ni-cofactor (Boschker et al., 2021). However, only two laser wavelengths (532 and 785 nm) were used in these experiments (Bjerg et al., 2018; Boschker et al., 2021). Raman spectroscopy at different incident laser wavelengths enables to differentiate different structural moieties, depending on whether they are or not resonantly enhanced at a given laser wavelength. Therefore, we employed an elaborate multi-wavelength Raman approach to enable an in-depth investigation of the vibrational modes of the novel Ni-cofactor and other cell constituents linked to the intriguing physiology of cable bacteria. We combine this multi-wavelength approach with both ultralow-frequency and orientation-dependent Raman microscopy, as well as stable isotope labeling for a thorough investigation of the molecular structure and spatial arrangement of this Ni-cofactor.
2 Materials and methods 2.1 Cable bacteria cultivationNatural marine sediment was collected from the creek bed in a salt marsh (51.4391°N, 4.1697°E; Rattekaai, the Netherlands). Sediment was sieved (1.4 mm stainless steel mesh) to remove debris, plant material, and fauna, homogenized by mixing, and subsequently added into transparent PVC core liner tubes (36 mm diameter, 100 mm height) that were sealed at the bottom with a rubber stopper. These sediment cores were incubated in plastic containers filled with artificial seawater (salinity 30) that was continuously aerated. Incubations were conducted in the dark at a constant temperature of 20°C. Thick cable bacteria (ca. 4 μm diameter) developed within 4 weeks and were identified as Candidatus Electrothrix gigas based on size and morphology (Geelhoed et al., 2023).
2.2 Sample preparationCable bacterium filaments were harvested from the top layer of the sediment and manipulated under a stereomicroscope with custom-made, small glass hooks. Individual filaments were washed to remove sediment particles and salts by transferring them six times between droplets (∼20 μL) of clean MilliQ (mQ) water. The resulting samples are referred to as “native cable bacteria” (Figures 1A,C). In a subsequent step, the conductive fiber network was isolated from native cable bacterium filaments through a chemical extraction procedure. This procedure yields so-called “fiber skeletons” (Figures 1B,D), a cylindrical sheath structure in which the conductive fibers are parallelly embedded in a carbohydrate sheath (Cornelissen et al., 2018). Fiber skeletons remain equally conductive after extraction, indicating that the fiber structure remains unaltered and functional (Meysman et al., 2019). To produce fiber skeletons, native cable bacterium filaments were submerged for 10 min in a droplet (∼20 μL) of 1% (w/w) sodium dodecyl sulfate (SDS) to remove the cell membranes and cytoplasmic cell content. After 10 min, filaments were washed six times in fresh droplets of mQ water to rinse off cell debris and SDS. Next, filaments were transferred to a droplet (∼20 μL) of 1 mM ethylenediaminetetraacetic acid (EDTA) and left for 10 min to remove leftover SDS. Finally, filaments were washed six times in droplets of fresh mQ to obtain clean fiber skeletons. Extraction quality was verified by scanning electron microscopy (SEM). Filaments were fixed onto polycarbonate filters and sputtered (Polaron E5100 sputter coater) for 30 s at a current of 13 mA and pressure of 0.13 mbar. Samples were imaged with a Phenom ProX SEM (Phenom-World, the Netherlands) with a beam energy of 10 keV (Figures 1C,D).
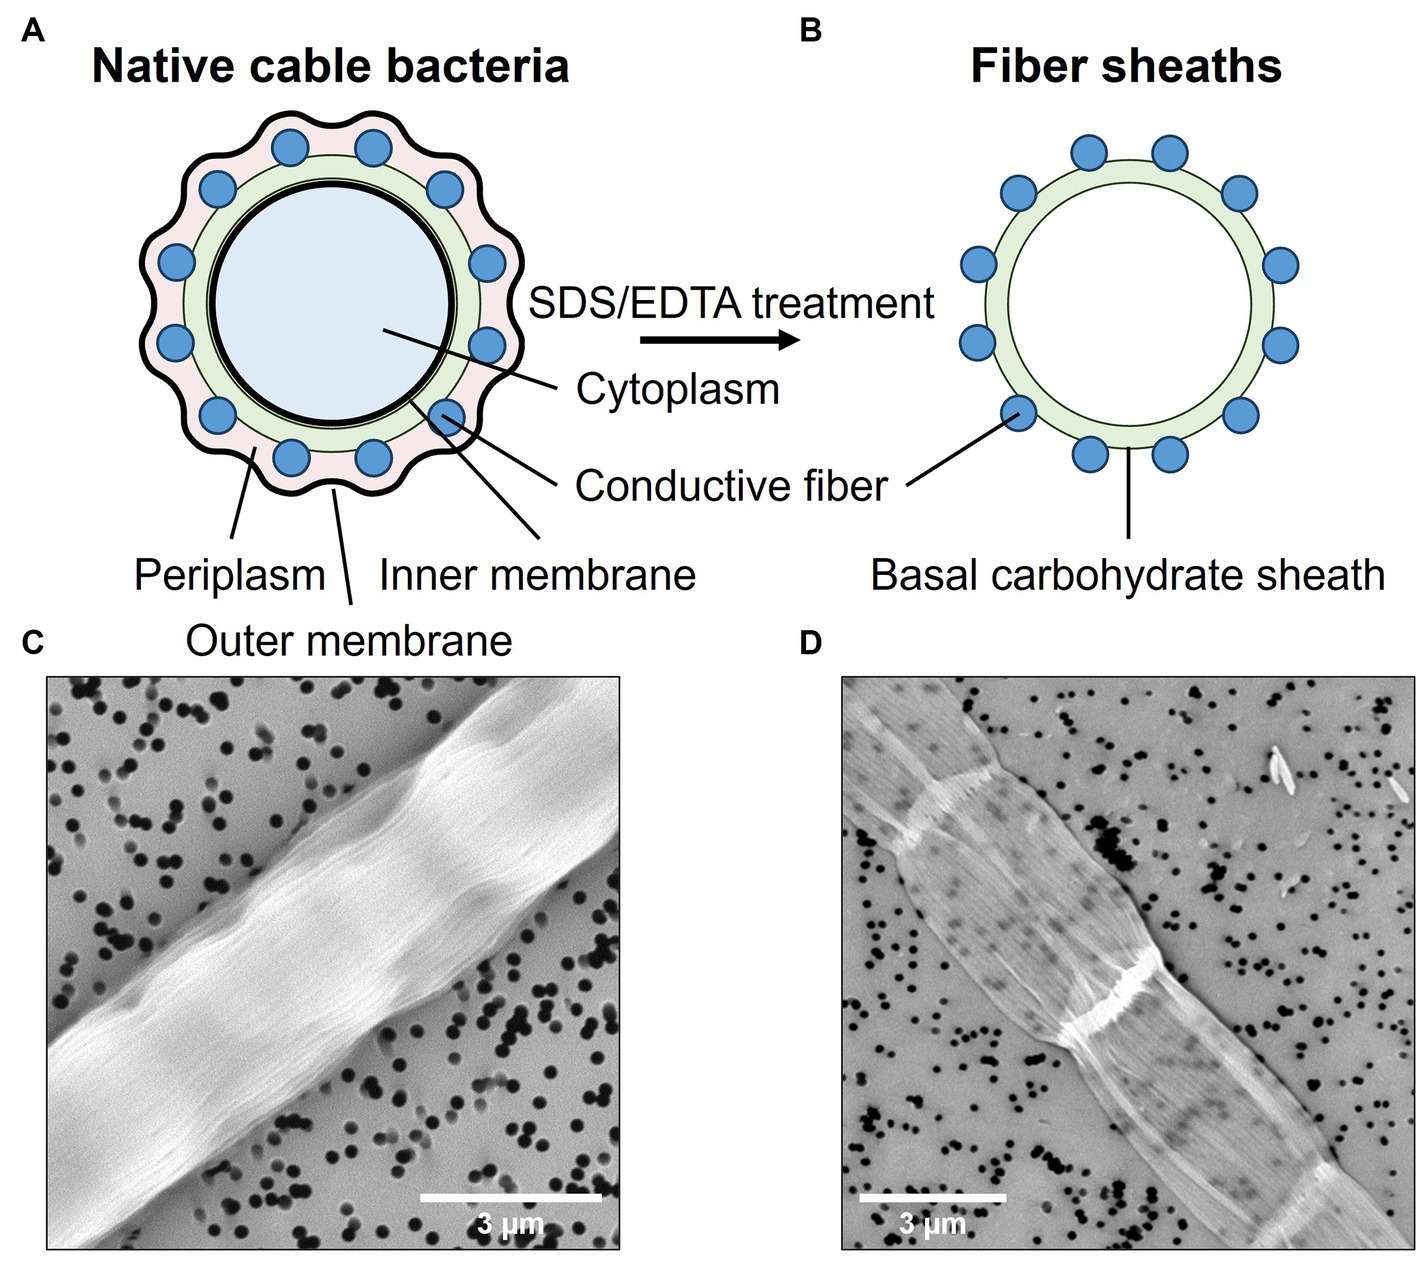
Figure 1. Native cable bacterium filaments were subjected to an extraction procedure that removes the cell content and membranes, leaving only the conductive protein fibers embedded in a thin, basal carbohydrate sheath. Top panels show a schematic representation of a cross-sections across a native filament (A) and a fiber skeleton (B). Bottom panels depict SEM micrographs of a native cable bacterium filament (C) and a fiber skeleton (D). The black dots are holes in the polycarbonate filter substrate.
2.3 Multi-wavelength and ultralow-frequency Raman microscopyFor Raman microscopy, native cable bacterium filaments and fiber skeletons were deposited on a 7 × 7 mm piece of gold-coated silicon wafer (100 nm gold layer, Platypus Technologies) and air-dried (Figure 2). Raman spectra were collected by focusing the laser spot on the central section of individual cells in cable bacterium filaments. Additionally, the bare gold-plated silicon wafer was measured to determine the background signal.
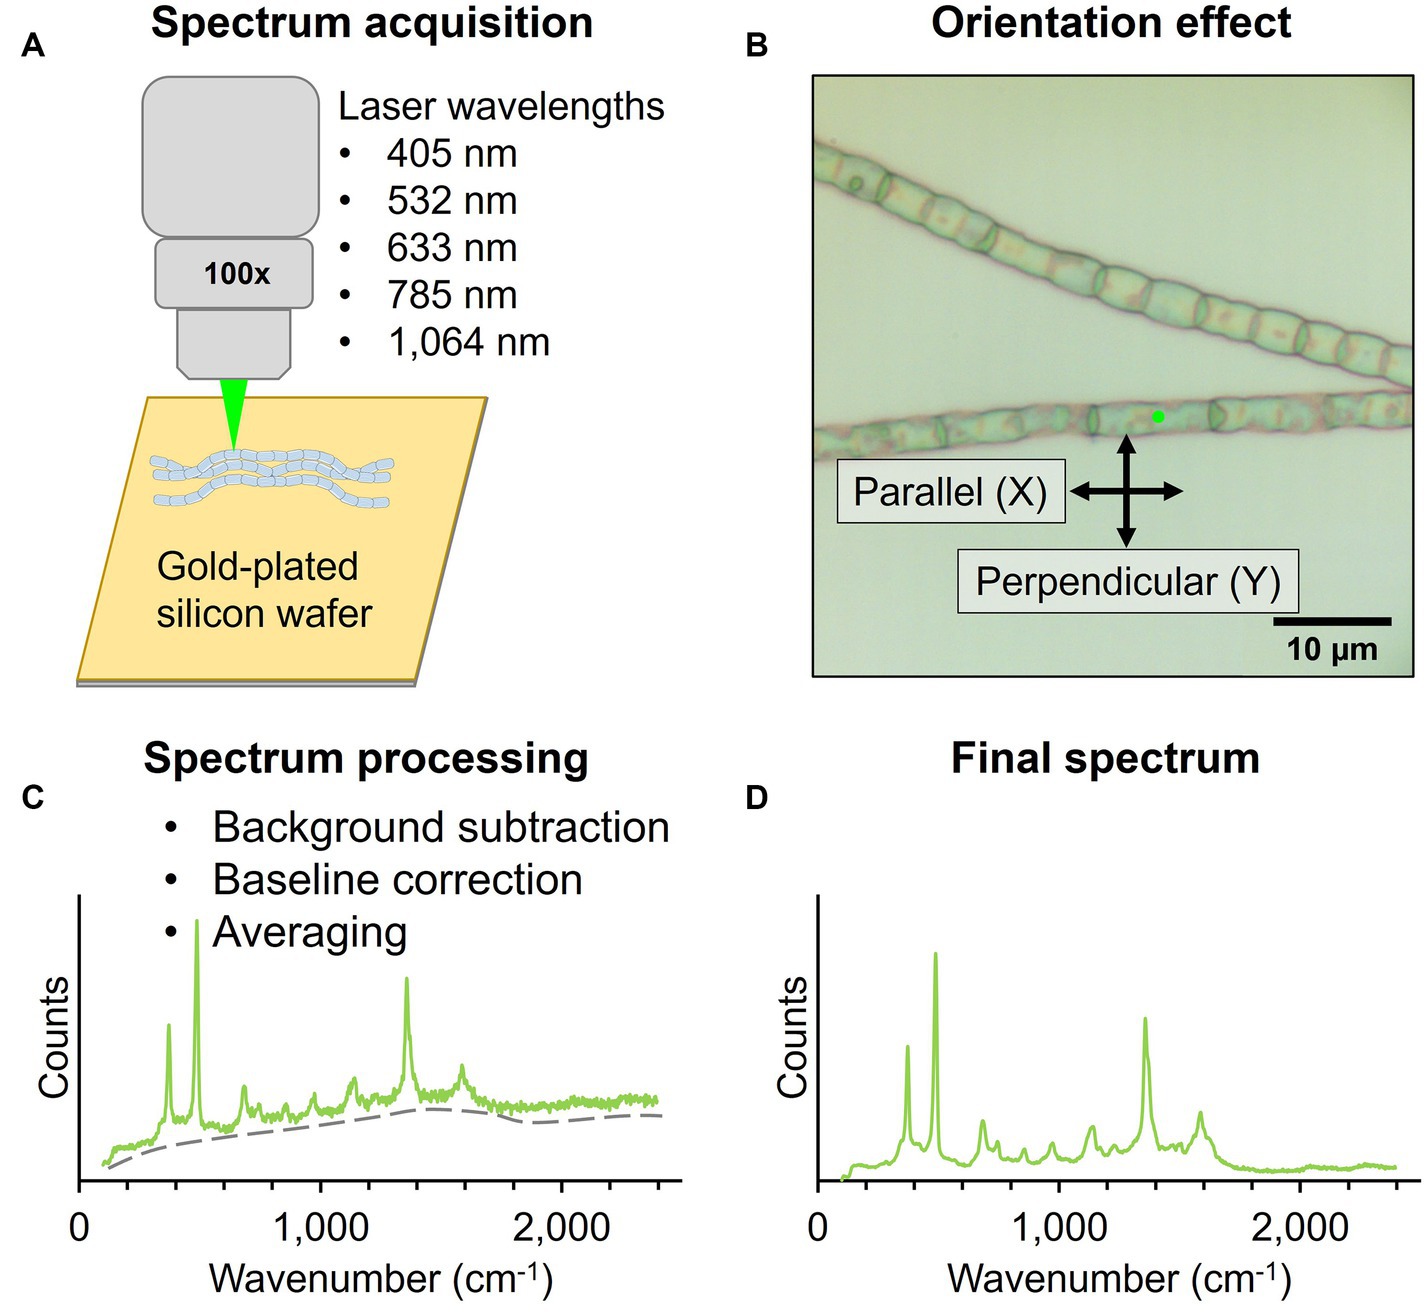
Figure 2. Workflow for Raman microscopy measurements of native cable bacteria and fiber skeletons. (A) Filaments were deposited on a gold-plated silicon wafer for Raman spectrum acquisition with five wavelengths. (B) The laser polarization (black arrows) was either parallel (X) or perpendicular (Y) to the filament orientation (X). Spectra were collected with the incident laser light (green dot) focused on the central section of cable bacterium cells. (C) Acquired spectra were background- and baseline-corrected and averaged to obtain a final spectrum (D).
Two Raman microscope systems were used for data collection: a Renishaw inVia™ Qontor® and a Horiba LabRam HR Evolution Confocal Raman microscope. The Renishaw inVia™ Qontor® microscope was equipped with four Renishaw solid-state lasers: 405 nm laser, 532 nm laser, 785 nm laser, and 1,064 nm laser. A 100x microscopy objective (NA 0.90), and confocal aperture of 65 μm delivered the laser light to the sample and captured Raman scattered photons. Appropriate gratings were installed for each laser to ensure an optimal signal response and spectral resolution of approximately 1 cm−1. Raman scattered photons in the visible range were detected with a Renishaw Centrus Charge Coupled Device (CCD) detector, while an Andor Indium Gallium Arsenide photodiode (InGaAs) detector captured photons in the infrared range. Both detectors were thermo-electrically cooled to −70°C. The Horiba LabRam HR Evolution confocal Raman microscope was equipped with a 633 nm laser and 785 nm laser (ThorLabs HRP350-EC). The optical components included a 100x (NA 0.9) objective lens, confocal aperture of 50 μm, and 600 gr/mm grating. Raman scattered light was quantified with a back-illuminated deep-depleted Si array (1,024 × 512 pixel) detector. For ultralow-frequency (ULF) measurements with the 785 nm laser, a dedicated ultralow-frequency filter set was installed to enable the detection of low-energy Raman signals down to 50 cm−1. Optimized acquisition parameters for both Raman systems are included in Table 1. All laser sources produced horizontally (X) polarized light by default. All Raman spectra were collected in backscattering conformation, without an analyzer (Z(X,-) Z¯ ), unless noted otherwise.
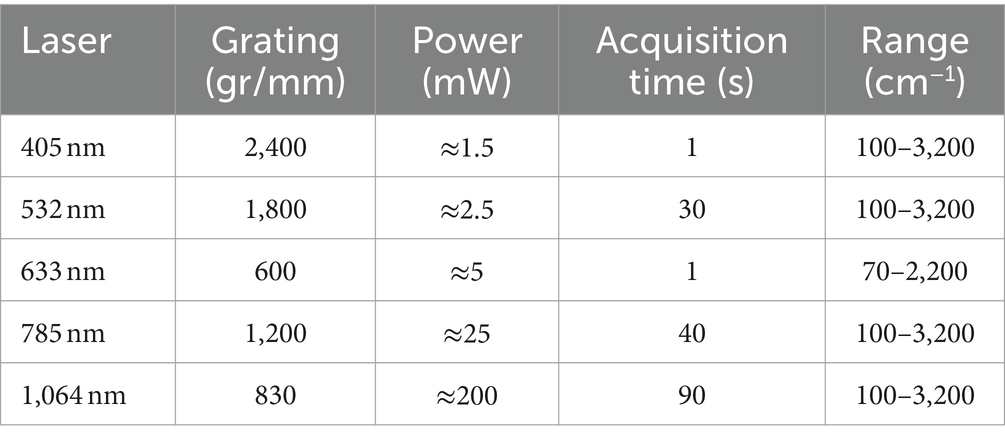
Table 1. Optimized Raman spectrum acquisition parameters.
2.4 Stable isotope labeling and NanoSIMSThe Ni-cofactor in cable bacteria exhibits several vibrational modes that cannot be annotated with confidence (Boschker et al., 2021). To investigate the molecular origin of these modes, we employed stable isotope probing with 13C or 15N followed by Raman microscopy to analyze peak shifts caused by the potential incorporation of isotopes in the Ni-cofactor. We then used NanoSIMS analysis to verify and quantify the isotope labeling in the cable bacterium biomass and correlate the level of isotope labeling achieved with the observed shift in the Raman modes. Hereto, we selected sediment cores (36 mm diameter, 100 mm height) with actively growing populations of cable bacteria, as verified by microsensor profiling (Geerlings et al., 2020). Per core, 3 plastic cylinders (10 mm diameter, 50 mm height) were inserted into the sediment to a depth of approximately 45 mm to make “subcores.” Labeled 13C-sodium bicarbonate (NaH13CO3; Cambridge Isotope Laboratories) or 15N-ammonium chloride (15NH4Cl; Eurisotop) were dissolved in sterile, artificial seawater to obtain a 400 mM NaH13CO3 and 500 mM 15NH4Cl solution. At the start of the labeling incubation, 500 μL of either the NaH13CO3 or 15NH4Cl solution was injected per subcore using a 50 μL gas chromatography syringe, while minimizing sediment disturbance. Labeled cores were stored in an airtight container that was aerated once a day. Sedimentary uptake of unlabeled atmospheric CO2 or N2 was reduced by adding a tissue soaked in labeled, artificial seawater to the container (this ensuring labeling in the gas phase of the container). After 4 days of incubation, cable bacterium filaments were individually harvested from the sediment for fiber skeleton extraction. Clean fiber skeletons were deposited on a 7 × 7 mm piece of gold-coated silicon wafer (Platypus Technologies) and left to dry overnight. Raman spectra were recorded the next day. After Raman spectrum collection, the degree of 13C or 15N isotope labeling was determined. For this, the same fiber skeleton positions from which Raman spectra were collected earlier were examined with a NanoSIMS 50 L (Cameca, France) as described in Geerlings et al. (2020). The wafer with samples was placed on a stub and inserted in the vacuum chamber of the NanoSIMS 50 L. In the vacuum chamber, a primary Cs+ ion beam was used to repeatedly scan the sample, while analyzing secondary ions ejected from the sample with a high-resolution mass spectrometer. The regions of interest were first visualized with SEM before being pre-sputtered with Cs+ ions until secondary ion yields stabilized. Next, multiple scans of 20 × 20 μm were made with the primary Cs+ ion beam (beam size: 130 nm, energy: 16 keV, current 0.5–10 pA) and measuring secondary ion counts of 16O, 12C2, 12C13C, 12C14N, 12C15N, 31P, and 32S. Finally, the 13C or 15N labeling degree in the fiber skeletons was calculated with the Look@NanoSIMS tool (Polerecky et al., 2012) using the following ratios: 0.5*12C13C/(12C2 + 0.5*12C13C) and 12C15N/(12C15N + 12C14N). These ratios were averaged over the whole scanned area of the filament.
2.5 Orientation-dependent Raman microscopyThe orientation-dependent response of the Ni-cofactor’s Raman signal was investigated for both native cable bacteria and fiber skeletons. In the Renishaw system, the microscope stage was rotated, so filaments were oriented in either the parallel (X) or perpendicular (Y) direction to the X-polarized light of the 405, 532, and 785 nm laser sources. The Horiba LabRam HR microscope system utilized an automated 1/2 waveplate in the common path to change the polarization of the 633 nm laser to either parallel or perpendicular to the orientation of filaments in the field of view. Note that the conductive fibers, and hence the electron currents, always run in parallel to the longitudinal axis of the filaments (Meysman et al., 2019).
2.6 Processing of Raman spectraRaman spectrum processing included the removal of cosmic ray spikes, background subtraction and baseline correction. Cosmic ray removal was done in the WiRe™ software (version 5, Renishaw). Background subtraction and baseline correction was done in R (version 4.2.2; R Core Team, 2018). Background spectra were averaged and subtracted from each individual sample spectrum. Baseline correction was done with the R package “baseline” (Liland et al., 2010) using asymmetric least squares baseline correction, which is based on 2nd derivative constrained weighted regression.
2.7 UV-Vis-NIR absorption spectroscopyNative cable bacterium filaments and fiber skeletons were prepared as for Raman microscopy and were either analyzed in dried or wet state. To this end, multiple filaments were deposited together in large, dense clumps on fused quartz microscopy slides (Micro-Tec GE124 fused quartz) and air-dried. Samples were wetted by adding a thin layer of mQ on the microscopy slide after filament deposition, covering the sample with a fused quartz coverslip, and sealing the edges with nail polish. The thin water layer on the microscopy slide reduced the reflectance of the fused quartz substrate.
Absorption spectra were measured with a Lambda 1050 spectrophotometer® (Perkin-Elmer) equipped with a Cassegrain-type microscope (Chassé et al., 2015). Light was focused to a focal spot of 150 μm onto dense spots with either cable bacteria or fiber skeletons, and spots without material for background correction. Transmitted light was collected and quantified with an array of three detectors: a CCD, an InGaAs photodiode, and a polycrystalline lead sulfide (PbS) detector. These detectors covered a spectral range from 210 to 2,500 nm. Spectrum processing was limited to background subtraction and averaging of spectra recorded under identical conditions.
3 Results 3.1 Multi-wavelength Raman microscopy of native cable bacterium filamentsNative cable bacteria were subjected to Raman microscopy using five different laser wavelengths (Figure 3; Table 1): blue (405 nm), green (532 nm), orange (633 nm), red (785 nm) and infrared (IR; 1,064 nm). For each laser wavelength, individual spectra were collected in many different cells, before being processed and averaged to derive the final spectrum. The resulting spectra show a set of peaks, which can be attributed to vibrational modes that originate from distinct classes of cellular compounds: general protein signals, cytochrome peaks, and modes that uniquely link to the novel Ni-cofactor (peak annotations are provided in Table 2).
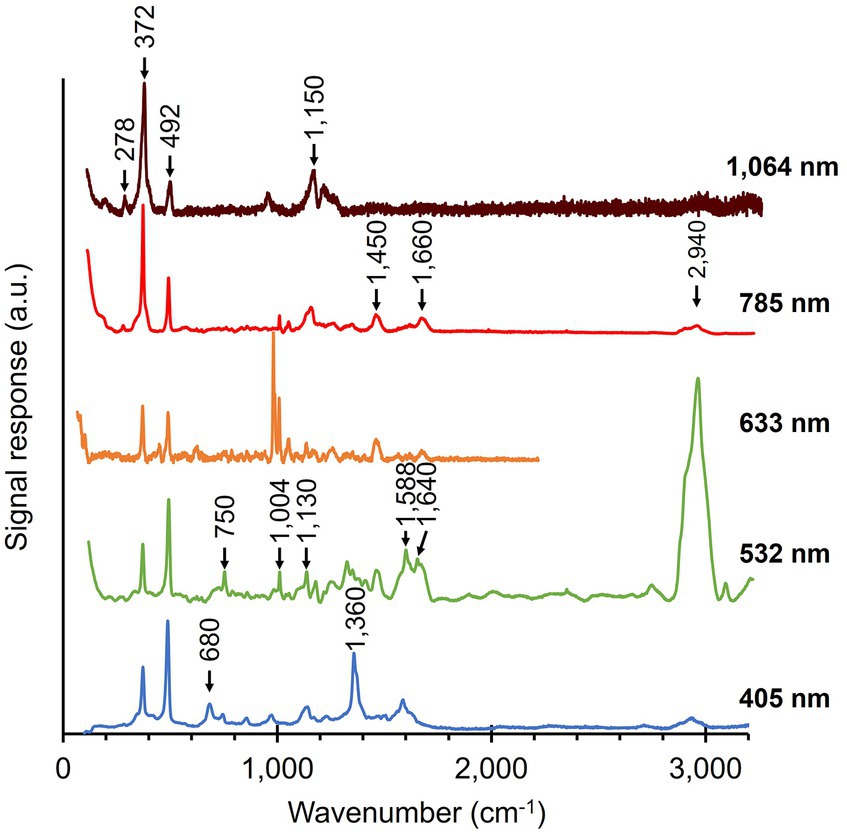
Figure 3. Raman spectra of native cable bacteria were collected with five different wavelengths (indicated on the right). Arrows and numbers indicate relevant modes specific to the fingerprint of cable bacteria. The depicted spectra represent averages of multiple, individually collected spectra. The number of spectra collected per wavelength was: 55 (405 nm), 110 (532 nm), 5 (633 nm), 38 (785 nm), and 70 (1,064 nm). a.u., arbitrary units. Spectra are off-set for clarity.
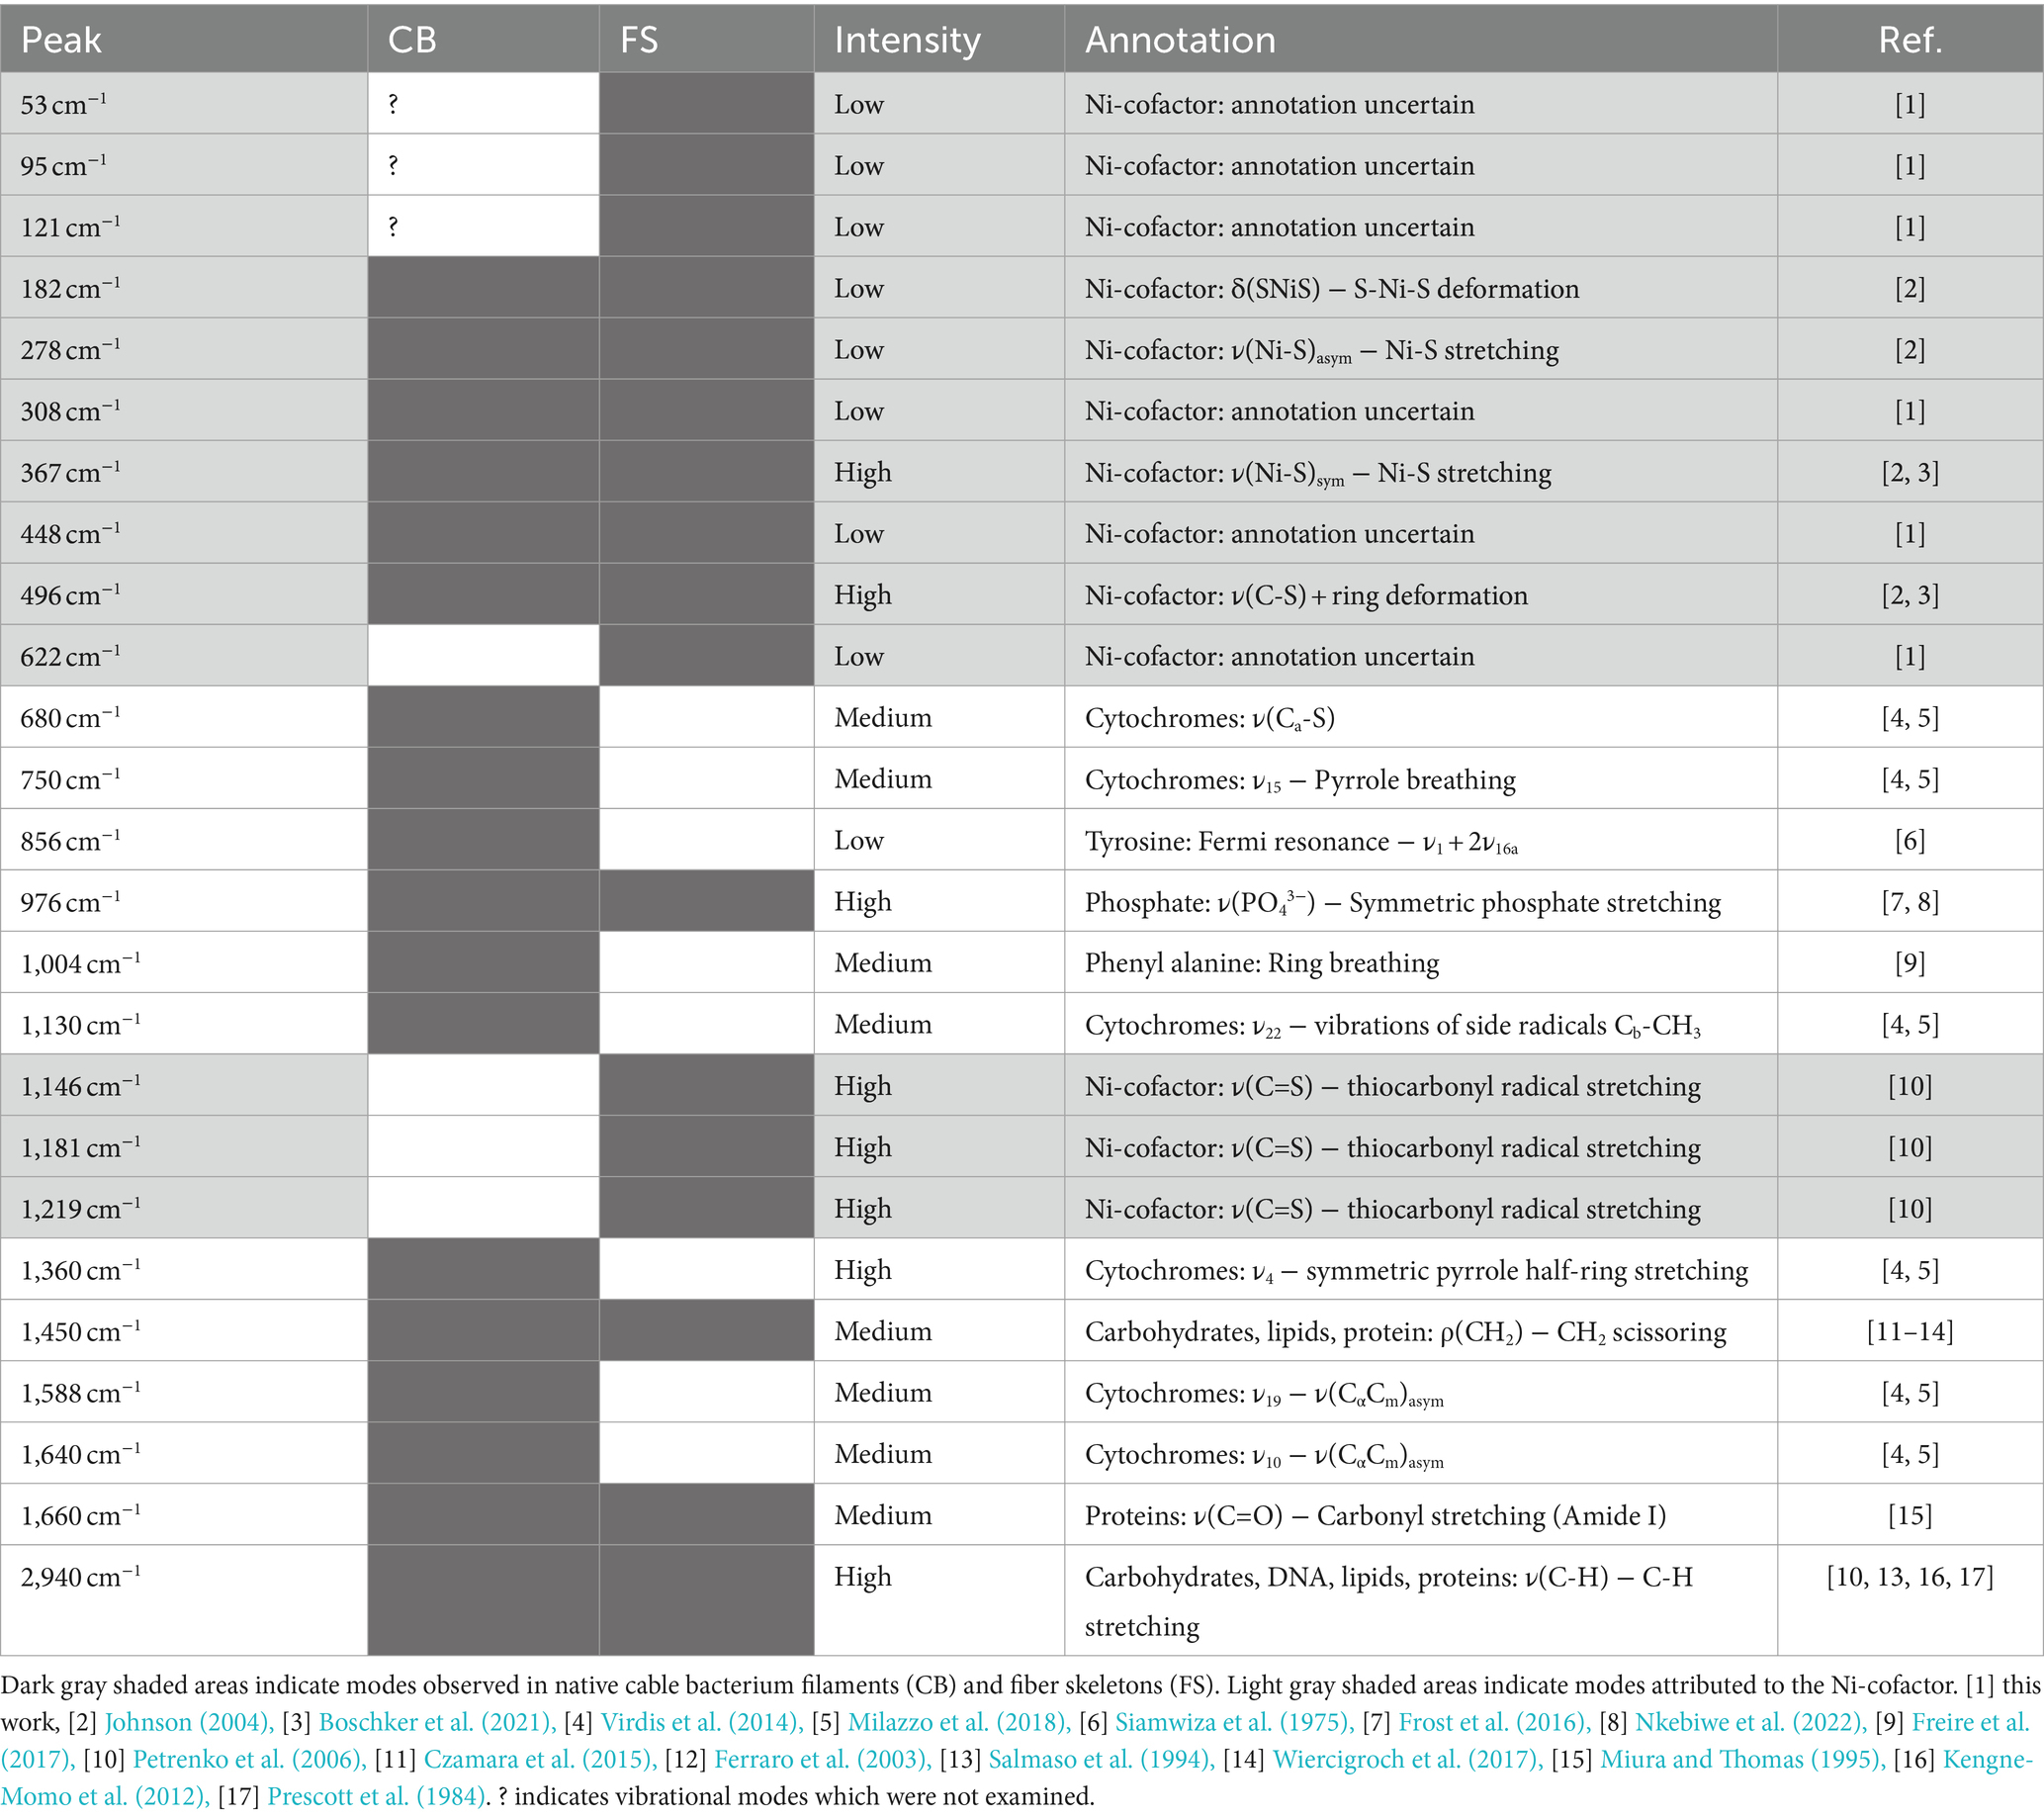
Table 2. Overview of Raman active modes found in cable bacteria.
Genome analysis reveals that several cytochrome genes are present in the genome of cable bacteria (Kjeldsen et al., 2019). Cytochromes are known to exhibit resonant Raman scattering as a result of absorption from the Soret (410 nm) and Q (530 nm) bands (Hu et al., 1993; Virdis et al., 2014), which are close to the wavelengths of the blue (405 nm) and green (532 nm) lasers employed. When using these lasers, we indeed detected strong peaks at the expected positions for cytochromes: 680, 750, 1,130, 1,360, 1,588, and 1,640 cm−1 (Virdis et al., 2014; Bjerg et al., 2018; Milazzo et al., 2018). In contrast, cytochrome signals were absent in Raman spectra recorded at longer wavelengths (633, 785, and 1,064 nm), consistent with the absence of cytochrome absorption bands beyond 550 nm (Liu and Webster, 1974).
The Raman spectra of native cable bacteria also show signals attributable to generic microbial biomass components. Two characteristic protein modes were identified upon irradiation with the 532, 633, and 785 nm laser. These vibrational modes include the phenyl alanine ring breathing (1,004 cm−1) and the Amide I mode (1,660 cm−1; Miura and Thomas, 1995; Freire et al., 2017). We observed weaker protein signals in the blue (405 nm) spectrum at 856 and 1,253 cm−1, which originate from tyrosine side chains and the Amide III mode of the protein backbone, respectively (Siamwiza et al., 1975; Miura and Thomas, 1995). Other vibrational modes linked to generic, organic compounds were the CH2 scissoring mode at 1,450 cm−1 detected with the green (532 nm) and red (785 nm) laser, and the C-H stretching modes around 2,940 cm−1 present in almost all spectra. These two vibrational modes are present in many cellular constituents like proteins, carbohydrates, DNA, and lipids (Prescott et al., 1984; Salmaso et al., 1994; Ferraro et al., 2003; Kengne-Momo et al., 2012; Czamara et al., 2015; Wiercigroch et al., 2017). Occasionally, an intense peak was observed at 971 cm−1, as seen in the orange (633 nm) spectrum. This peak likely originates from phosphate stretching (Frost et al., 2016; Nkebiwe et al., 2022) in the polyphosphate granules that are widely present in cable bacteria (Sulu-Gambari et al., 2016a; Geerlings et al., 2022). However, such polyphosphate granules are not present in every cell (Geerlings et al., 2022), explaining the occasional presence of the 971 cm−1 peak in the spectra. A complete annotation list of the Raman spectrum of native cable bacteria is provided in Supplementary Table 1.
A striking feature in the Raman spectra of native cable bacteria are the two peaks at 372 cm−1 and 492 cm−1 (Figure 3). Boschker et al. (2021) previously observed these peaks and assigned them to vibrational modes of the Ni-cofactor in the conductive fibers. Notably, these two peaks occur prominently in the Raman spectra of all the examined laser wavelengths. The height of these Ni-cofactor peaks with respect to other cell compounds in the spectra suggests the Raman signals are resonantly enhanced across a wide frequency range (Figure 3).
3.2 Multi-wavelength Raman microscopy of fiber skeletonsRaman spectra of fiber skeletons were obtained using the same workflow as that of native cable bacteria. The removal of cellular material during the extraction procedure is clearly reflected in all recorded spectra of fiber skeletons (Figure 4). Overall, fiber skeletons produced a much “simpler” Raman spectrum compared to native cable bacteria. We observed a substantial decrease in the number and magnitude of peaks associated with cytochromes and generic biomass components, though not for the two characteristic modes linked to the Ni-cofactor (i.e., 367 and 496 cm−1).
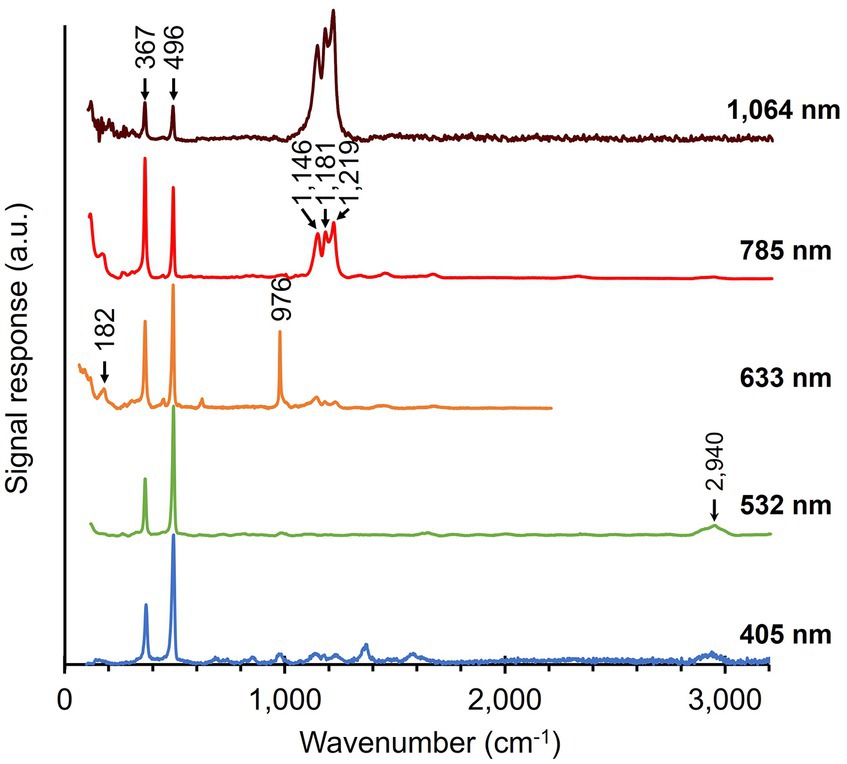
Figure 4. Raman spectra of fiber skeletons isolated from native cable bacteria. Multiple spectra, originating from different spots along fiber skeletons, were acquired for each of the five wavelengths. Arrows and numbers indicate prominent modes in the fiber skeleton samples. The number of collected spectra per wavelength: 50 (405 nm), 52 (532 nm), 5 (633 nm), 60 (785 nm), 150 (1,064 nm). a.u., arbitrary units. Spectra are off-set for clarity.
The cytochrome signals disappeared completely in the green (532 nm) spectrum and only small remnant peaks were observed in the blue (405 nm) spectrum. This confirms earlier findings that cytochromes are almost completely removed during the fiber extraction procedure (Meysman et al., 2019). The intensity of modes associated with general cellular compounds also decreased greatly upon extraction. As expected, the removal of the cytoplasm and membranes resulted in a substantial drop in the intensity of the protein-related modes (Phe ring breathing—1,004 cm−1 and Amide I—1,660 cm−1) and the CH2 scissoring (1,450 cm−1) and C-H stretching mode (2,940 cm−1) in spectra recorded with the green (532 nm), orange (633 nm), and red (785 nm) lasers. Curiously, we also detected the presence of leftover polyphosphate granules in fiber skeletons, as indicated by the strong signal at 976 cm−1 in the orange (633 nm) spectrum (Frost et al., 2016; Nkebiwe et al., 2022). This aligns with previous observations that polyphosphate granules are not completely removed during the fiber skeleton extraction procedure (Cornelissen et al., 2018). An annotation list of vibrational modes in both native cable bacteria and fiber skeletons is presented in Table 2.
Upon fiber skeleton extraction, the network of conductive fibers is retained, increasing the relative concentration of the embedded Ni-cofactors. This is directly reflected in the Raman spectra. The two low-frequency peaks in the spectra of native cable bacteria (Figure 3) also dominate all spectra of fiber skeletons (Figure 4). This indicates that the Ni-cofactor, although present at low concentration (Boschker et al., 2021), produces strong, potentially resonant Raman signals across a broad range of wavelengths. Curiously, we observed a peak shift beyond the spectral resolution for both modes in fiber skeletons compared to native cable bacteria. The peak at 372 cm−1 shifted down −5 cm−1 (372 → 367 cm−1), while the 492 cm−1 peak shifted up +4 cm−1 (492 → 496 cm−1) after the extraction procedure. This suggests a (moderate) impact of the extraction on the bond lengths of cofactor, while not affecting its functionality, as fiber skeletons remain equally conductive compared to native cable bacterium filaments (Meysman et al., 2019).
In the Raman spectra of fiber skeletons (Figure 4), three closely spaced peaks become visible in the mid-frequency range (1,146, 1,181, and 1,219 cm−1) of the orange (633 nm) spectrum and are very prominent in the red (785 nm) and infrared (1,064 nm) spectrum (Figure 4). These peaks comprise a feature that we refer to as the “castle,” which is absent upon irradiation with the blue (405 nm) and green (532 nm) lasers but increases notably in intensity toward longer wavelengths. Effectively, the castle feature entirely dominates the infrared (1,064 nm) spectrum (Figure 4).
3.3 Impact of stable isotope labeling on Raman spectraFiber skeletons were extracted from cable bacteria that were exposed to isotope labeling with either 13C (NaH13CO3) or 15N (15NH4Cl). Per isotopic label, 4 fiber skeletons were prepared, of which several cells were measured with the 532 nm laser source to determine an average Raman spectrum for each filament (Figure 5). Fiber skeletons obtained from non-labeled sediment incubations were used to collect control Raman spectra.
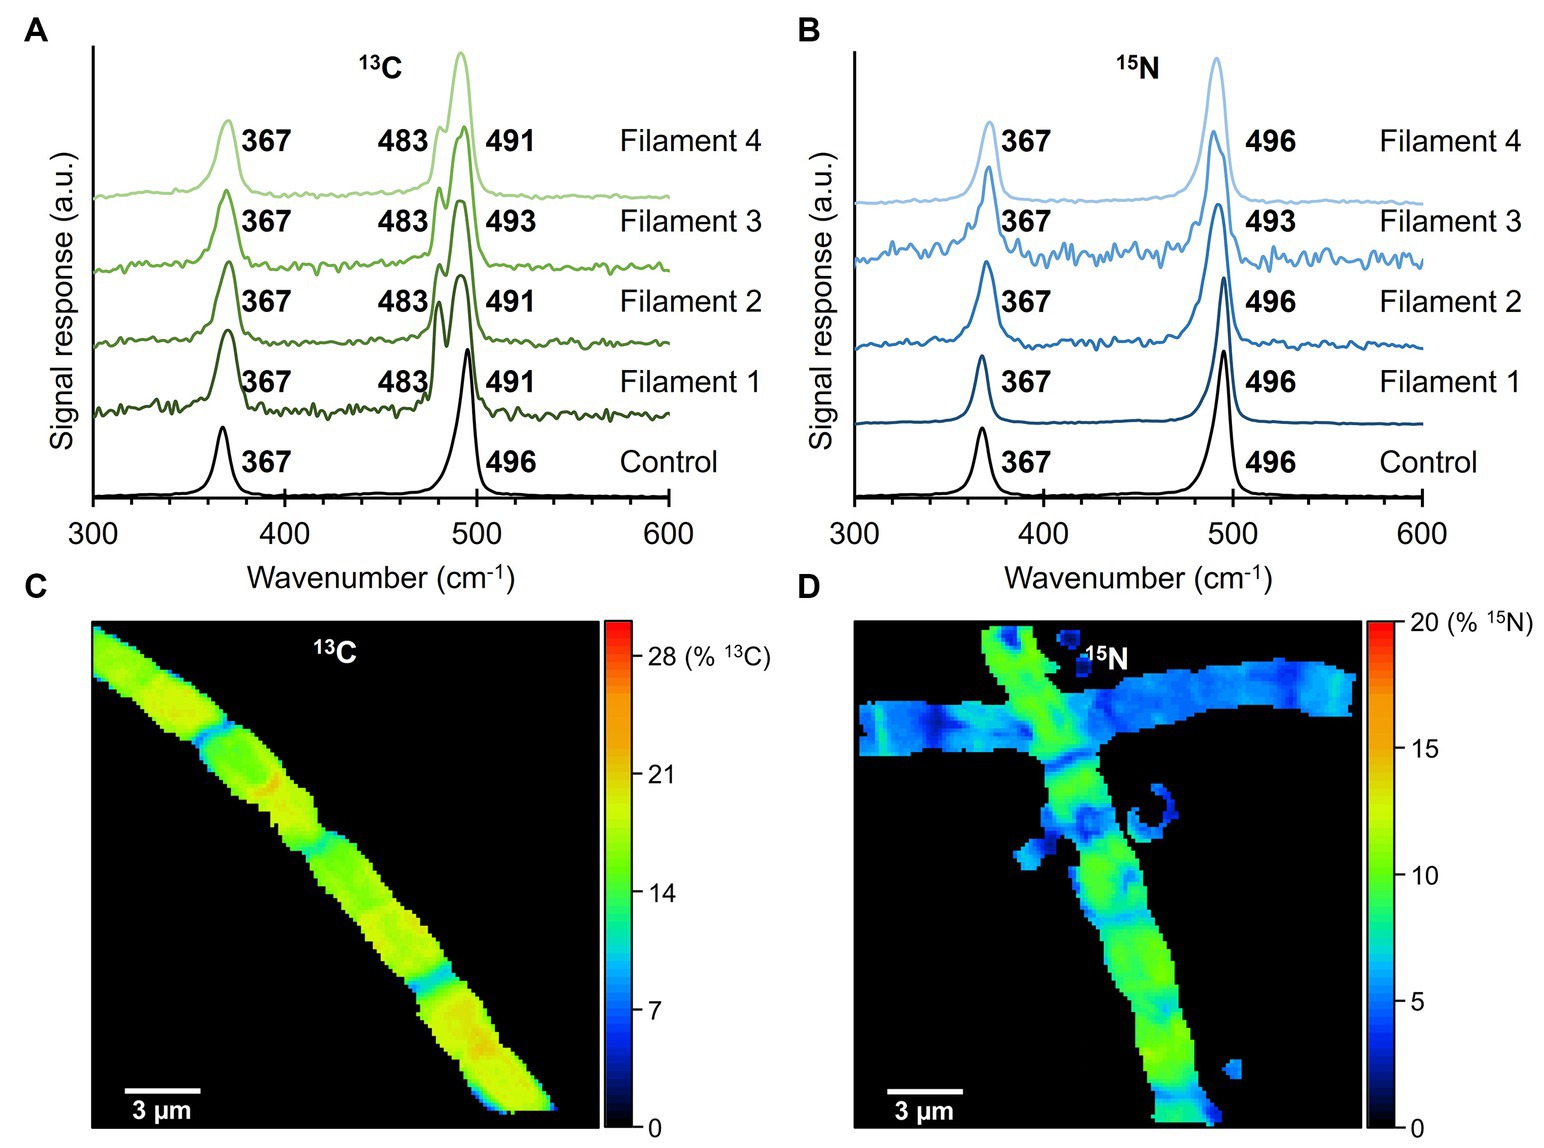
Figure 5. Raman spectra of fiber skeletons isolated from 13C- and 15N-labeled fiber skeletons. (A) Isotopic labeling with 13C (NaH13CO3) resulted in a large (−13 cm−1) and small (−5 cm−1) downward shift in the 496 cm−1 peak of the Ni-cofactor. (B) Incorporation of 15N in the cable bacterium biomass did not produce peak shifts. Control spectra of non-labeled fiber sheaths are indicated in black. Raman spectra were recorded with a 532 nm laser source. (C) The 13C-labeling and (D) 15N-labeling degree in the analyzed fiber skeletons were determined with NanoSIMS.
Comparison of the two dominant low-frequency modes of the Ni-cofactor in the Raman spectra of 13C-labeled and control filaments revealed that 13C incorporation produced downward shifts of the 496 cm−1 peak toward 483 cm−1 (−13 cm−1) and 491 cm−1 (−5 cm−1; Figure 5A). These shifts indicate that 13C was integrated into the biomass and Ni-cofactor, changing the frequency of the molecular vibration linked to the 496 cm−1 peak. Previous 34S-labeling experiments also resulted in a downward shift of this mode (Boschker et al., 2021). Consequently, both C and S must be involved in the molecular bond that produces the 496 cm−1 mode. The 13C labeling did not affect the 367 cm−1 peak. Similarly, the Raman spectra of 15N-labeled samples were compared to control spectra. The peak positions of the two low-frequency modes of the Ni-cofactor were determined to be at 367 and 496 cm−1 in both 15N-labeled and control samples (Figure 5B). Therefore, 15N incorporation does either not significantly affect the molecular vibrations in the Ni-cofactor, or alternatively, 15N-labeling was not successful.
To rule out the second option, samples were analyzed with NanoSIMS to verify and quantify 13C or 15N incorporation into the cable bacterium biomass. The labeling degree of 13C in fiber skeletons was consistent between cells of the same filament (Figure 5C) but varied between individual fiber skeletons. We detected labeling degrees ranging from 7% to 20% 13C, while the natural abundance of 13C was 1.11%. 15N-labeling varied between cells and fiber skeletons (Figure 5D). Still, cable bacteria incorporated 15N in their biomass, reaching labeling degrees varying between 1% and 19% 15N, while the natural abundance of 15N amounted to 0.38%. Thus, NanoSIMS confirms that cable bacteria successfully incorporated both the 13C and 15N label into their biomass, at labeling degrees sufficient to induce shifts in Raman peaks. Yet, only 13C causes a distinct shift in the vibrational modes of the Ni-cofactor.
3.4 Ni-cofactor modes display an orientation-dependent responseDuring Raman spectrum collection, we noticed that the intensity of the five most prominent Ni-cofactor peaks (367, 496, 1,146, 1,181, and 1,219 cm−1) varied strongly between filaments. Depending on the orientation and positioning of the filaments on the substrate, the signals associated with the Ni-cofactor changed substantially, while the signals of cytochromes and protein-related modes (Phe ring breathing, Amide I) remained invariant. The conductive fibers run in parallel to the longitudinal axis of the filaments (Figures 1C,D), thus suggesting that the Raman scattering intensity strongly correlates with the orientation of the fibers. Both Raman systems employed in this work (Renishaw inVia™ Qontor® and Horiba LabRam HR Evolution) use laser sources that produce polarized light. To examine this orientation effect systematically, cable bacterium filaments and fiber skeletons were oriented in two different directions: parallel and perpendicular to the polarization of the blue (405 nm), green (532 nm), orange (633 nm), and red (785 nm) laser.
The five most intense Ni-cofactor modes in fiber skeletons exhibited a two- to six-fold increase in Raman signal intensity when the filament direction was parallel to the laser polarization as compared to the perpendicular conformation (Figure 6; Supplementary Table 2). The magnitude of the orientation-dependent signal response of the Ni-cofactor varied for different modes (Figure 6; Supplementary Figure 1). We determined the sensitivity toward the laser source polarization of the Ni-cofactor modes in fiber skeletons and compared them to the Amide I mode, which should be unaffected by changes in polarization (Supplementary Table 2). This was done by calculating the ratio of the signal intensity of the peak recorded in the parallel conformation (PeakParallel) compared to the intensity of the same peak in perpendicular conformation (PeakPerpendicular). An overview of the ratios can be found in Supplementary Table 2. The observed variation in strength of the orientation effect is likely caused by imperfect polarization of the incident laser light and slight deviations in the orientation of the filaments.
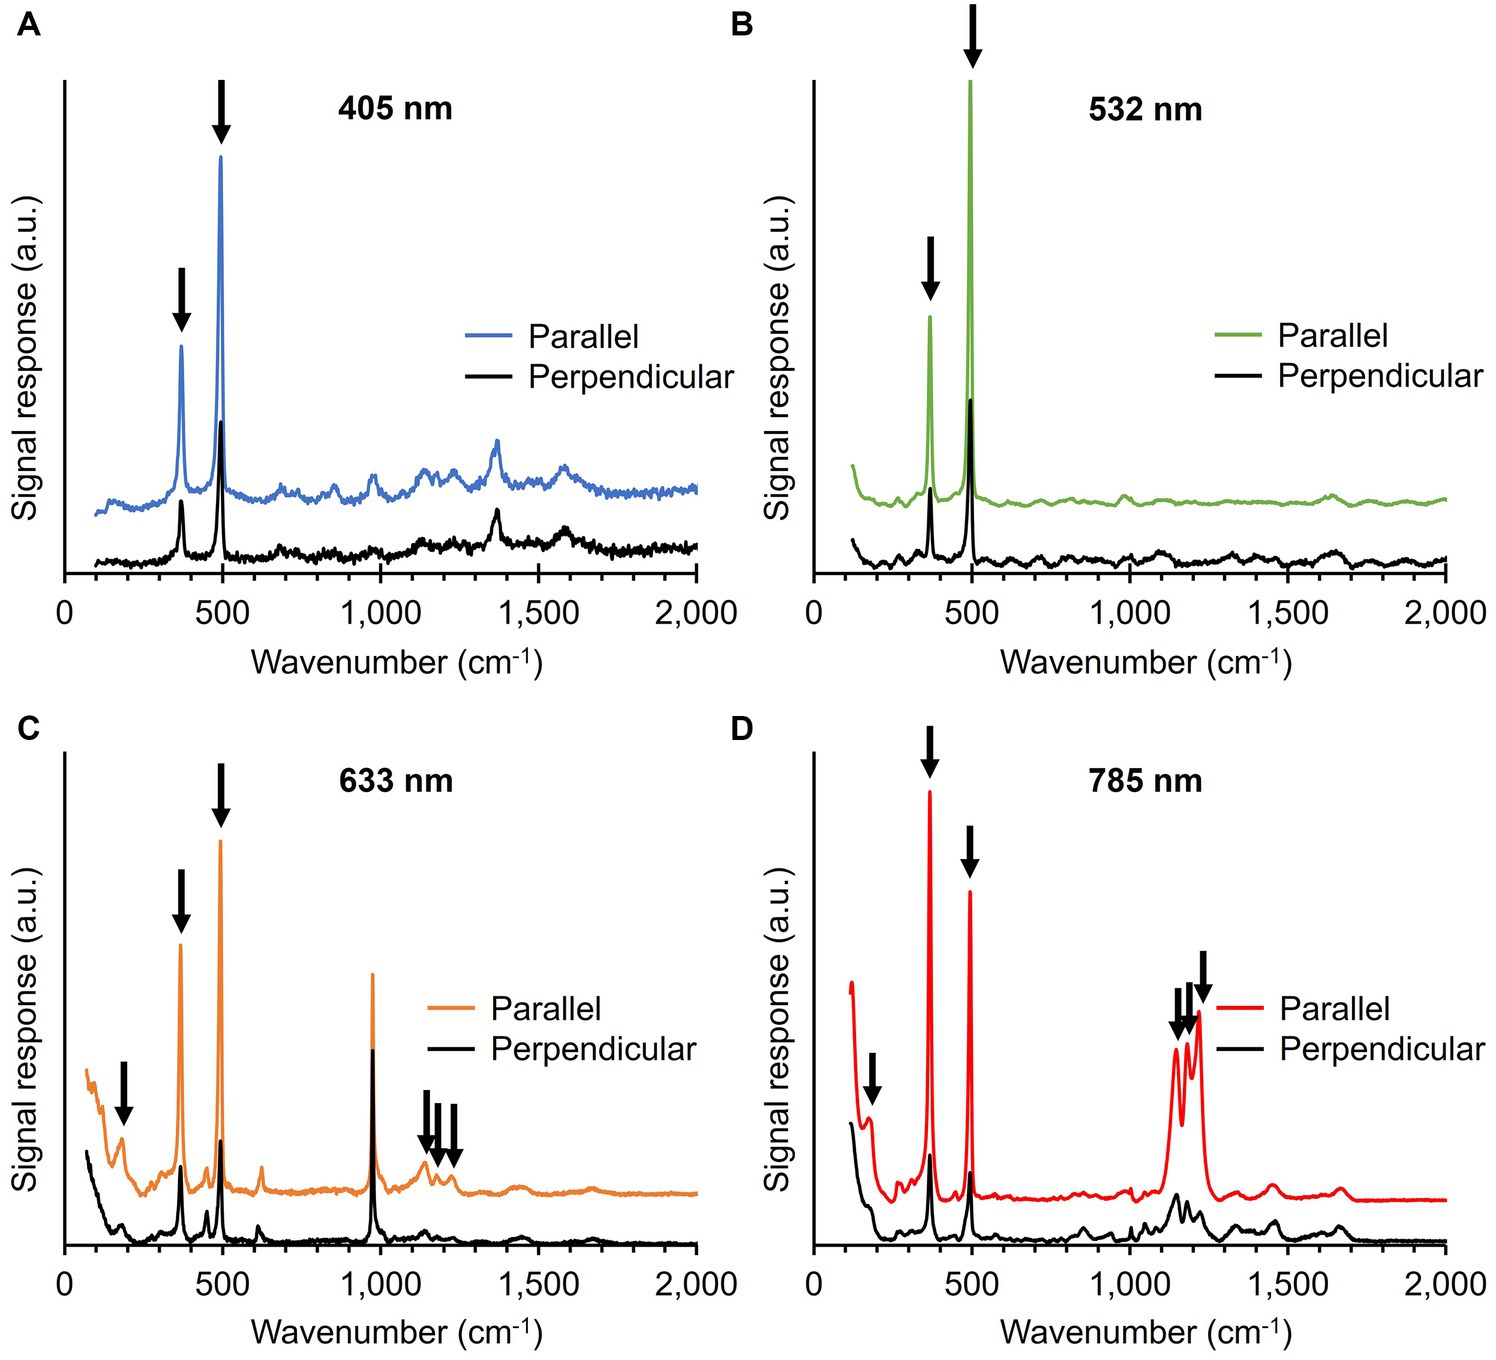
Figure 6. Raman spectra of fiber skeletons recorded with the 405 (A), 532 (B), 633 (C), and 785 nm laser (D). The incident laser light was either polarized parallel or perpendicular to the filament orientation. Vibrational modes associated with the Ni-cofactor, indicated with black arrows, display a strong, orientation-dependent Raman response. Spectra are off-set for clarity.
The ratio for both low-frequency modes (367 and 496 cm−1) was similar at all wavelengths and increased from 2 to 4 when moving toward longer wavelengths. The castle features (1,146, 1,181, and 1,219 cm−1) also displayed a clear orientation-dependent response, which was the largest with the red (785 nm) laser. The peaks are 3 to 6 times more intense upon parallel irradiation compared to perpendicular. The sensitivity toward the polarization of the incident light is thus of the same order of magnitude for the five most intense Ni-cofactor-related modes. The Amide I mode (1,660 cm−1) displayed a 10% decrease in Raman signal intensity when comparing parallel (X) to perpendicular (Y) irradiation, resulting in a ratio of 0.9. A ratio around 1 is expected since the protein backbone is assumed to have a random orientation in the protein structure of the conductive fibers.
The fact that all these modes consistently display the same, strong orientation dependence indicates that they are linked to the same molecular structure, i.e., the Ni-cofactor. This hypothesis is also supported by orientation-dependent measurements on native cable bacterium filaments. Also here, the signature Ni-cofactor modes (367 and 496 cm−1) exhibited a strong change in Raman intensity upon changing the filament orientation. In contrast, other compounds like cytochromes (680, 750, 1,130, 1,360, 1,588, and 1,640 cm−1) and proteins (Phe breathing mode—1,004 cm−1, Amide I—1,660 cm−1), produced Raman signals with a similar intensity upon both parallel and perpendicular irradiation (Supplementary Figure 1). This indicates that orientation-dependent Raman scattering in cable bacteria is unique to the Ni-cofactor in the conductive fibers.
3.5 Ultralow-frequency Raman microscopy of fiber skeletonsUpon inspection of the low-frequency region (100–250 cm−1), we noticed that this part of the fiber skeleton Raman spectrum featured several weak vibrational modes (Figures 3, 4). These modes are difficult to resolve since they are close to the cut-off frequency of the filters that remove the incident laser light (100 cm−1). Hence, we employed ultralow-frequency (ULF) Raman microscopy using the red (785 nm) laser source and an ULF filter set to access low-energy Raman signals down to 50 cm−1. To investigate the orientation-dependent Raman response, we tested irradiation of fiber skeletons with both parallel and perpendicularly polarized light. Doing so, we detected several low-frequency vibrational modes that can potentially be linked to the Ni-cofactor (Figure 7). We observed peaks at 53, 95, 121, 182, 278, 308, 448, and 622 cm−1 that have not previously been described. The peaks at 95, 121, 182, and 278 cm−1 exhibited a clear, orientation-dependent behavior as they were more intense upon parallel irradiation. As a result, we assign these peaks to molecular vibrations in the Ni-cofactor. The other peaks are smaller, making the orientation-dependent response less clear. Nevertheless, due to the relative enrichment of Ni-cofactors in fiber skeletons, it is likely these modes also originate from the cofactor. So far, we can only annotate two of these newly discovered modes with confidence, as they are also observed in certain Ni coordination complexes (see discussion below): S-Ni-S deformation (182 cm−1) and asymmetric Ni-S stretching (278 cm−1; Johnson, 2004).
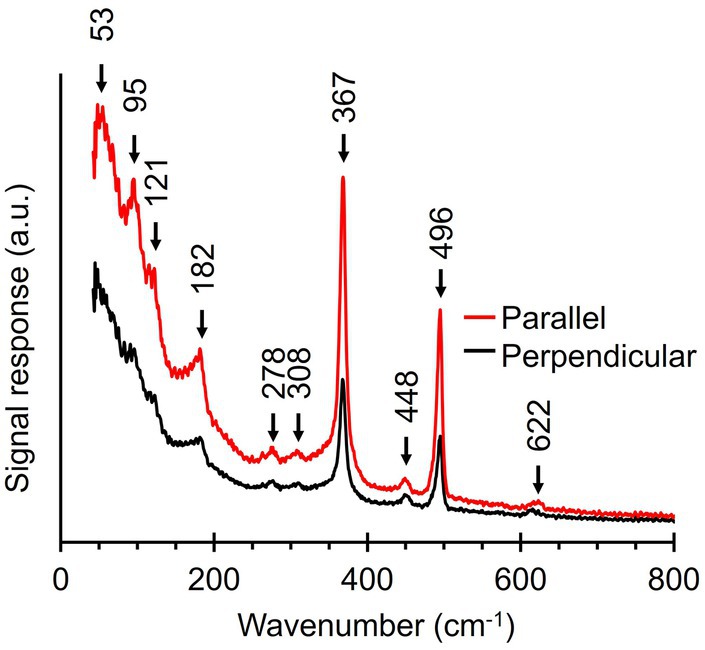
Figure 7. Ultralow-frequency Raman spectra obtained from fiber skeletons with a 785 nm laser source. Red line, laser polarization is parallel to the longitudinal axis of the filament. Black line, laser polarization is perpendicular to the longitudinal axis of the filament.
3.6 UV-Vis-NIR absorption spectroscopyThe strong Raman signals produced by the Ni-cofactor could result from resonant Raman scattering across the range of applied wavelengths (405–1,064 nm). Since resonant scattering occurs when the energy of incident photons is close to an electronic transition in the molecule, the Ni-cofactor must enable transitions and/or charge-transfers in this spectral range. The Raman scattering intensity is particularly strong in the (near)-infrared (NIR) region (785–1,064 nm), as indicated by the three “castle” modes that prominently emerge (Figure 4). As a result, we expect strong absorption in the NIR region caused by the Ni-cofactor. To uncover these potential transitions and charge-transfers causing absorption, we subjected native cable bacteria and fiber skeletons to UV-Vis-NIR absorption spectroscopy.
Native cable bacteria produced an absorption band at 410 nm, which is in the region where we expect Soret bands of various types of cytochromes (Figure 8). The broader and weaker Q band of cytochromes (~530 nm) was not detected (Azarkina et al., 1997; Oellerich et al., 2002; Mugnol et al., 2008; Diuba et al., 2023). Cytochrome signals were absent in fiber skeletons, as was the case for the Raman spectra, confirming that cytochromes are removed during the fiber skeleton extraction procedure (Meysman et al., 2019; Boschker et al., 2021). Both native cable bacteria and fiber skeletons yielded two absorption bands at 224 nm and 266 nm that likely originate from aromatic amino acids like tryptophan, phenyl alanine, and tyrosine, which have strong absorption bands in the UV region (Held, 2003). Fiber skeletons exhibited a weak and broad absorption band between 400 and 500 nm that could be caused by absorption from the Ni-cofactor. No absorption bands were observed in the NIR region, even though the Raman spectra suggest that the Ni-cofactor displays resonance at these wavelengths. This is most likely a problem of sensitivity. The Ni-cofactor is present at relatively low levels in fiber skeletons [Ni concentration < 1 p.p.t.; Boschker et al. (2021)], which is sufficient for detection by resonance Raman microscopy, but not by UV-Vis-NIR absorption spectroscopy.
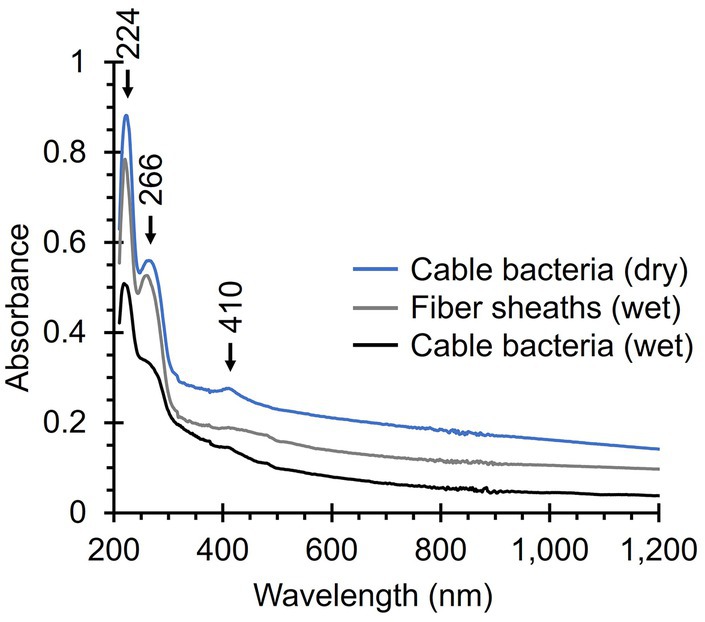
Figure 8. UV-Vis-NIR absorption spectra of native cable bacteria and fiber skeletons. Relevant absorption peaks are indicated with numbers and arrows. Three spectra were recorded per condition, background-corrected, and averaged. The noise between 800 and 900 nm is caused by detector switching.
4 Discussion 4.1 The Raman fingerprint of native cable bacterium filamentsRaman microscopy has a rich history in the f
留言 (0)