Materials
Lipopolysaccharide (LPS) from Escherichia coli O55:B5 was purchased from Sigma (USA). Adeno-associated virus 9 carrying wild-type HMGA1 gene (AAV9-HMGA1) and green fluorescent protein (AAV9-GFP) was constructed by Vigene Bioscience (Shandong, China). Adenovirus carrying wild-type HMGA1 gene (Ad-HMGA1) and green fluorescent protein (Ad-GFP) were generated from Vigene Bioscience (Shandong, China). Negative siRNA (si-NC) and HMGA1 siRNA (si-HMGA1) were obtained from Ribo Life Science (Suzhou, China). The anti-HMGA1 antibody (ab129153) is purchased from ABCAM company(UK). TRIzol reagent was purchased from Invitrogen (USA). Reverse transcription kit and SYBR Green I Master were purchased from Roche (Switzerland). CD45 antibody and CD68 antibody were purchased from Cell Signaling Technology (USA). Lipofectamine RNAiMAX transfection reagent was obtained from Thermo Fisher(USA). ApopTag® Plus In situ Apoptosis Fluorescein Detection Kit (S7111) was bought from Millipore Corporation (USA). Mitochondrial membrane potential detection kit (JC-1) and was purchased from Shanghai Biyuntian; MitoSOX Red Mitochondrial Superoxide Indicator was purchased from Invitrogen (USA). CellTiter-Glo®Luminescent Cell Viability Assay kit and Caspase-Glo® 3/7 Assay kit was obtained from Promega (USA).
Mice
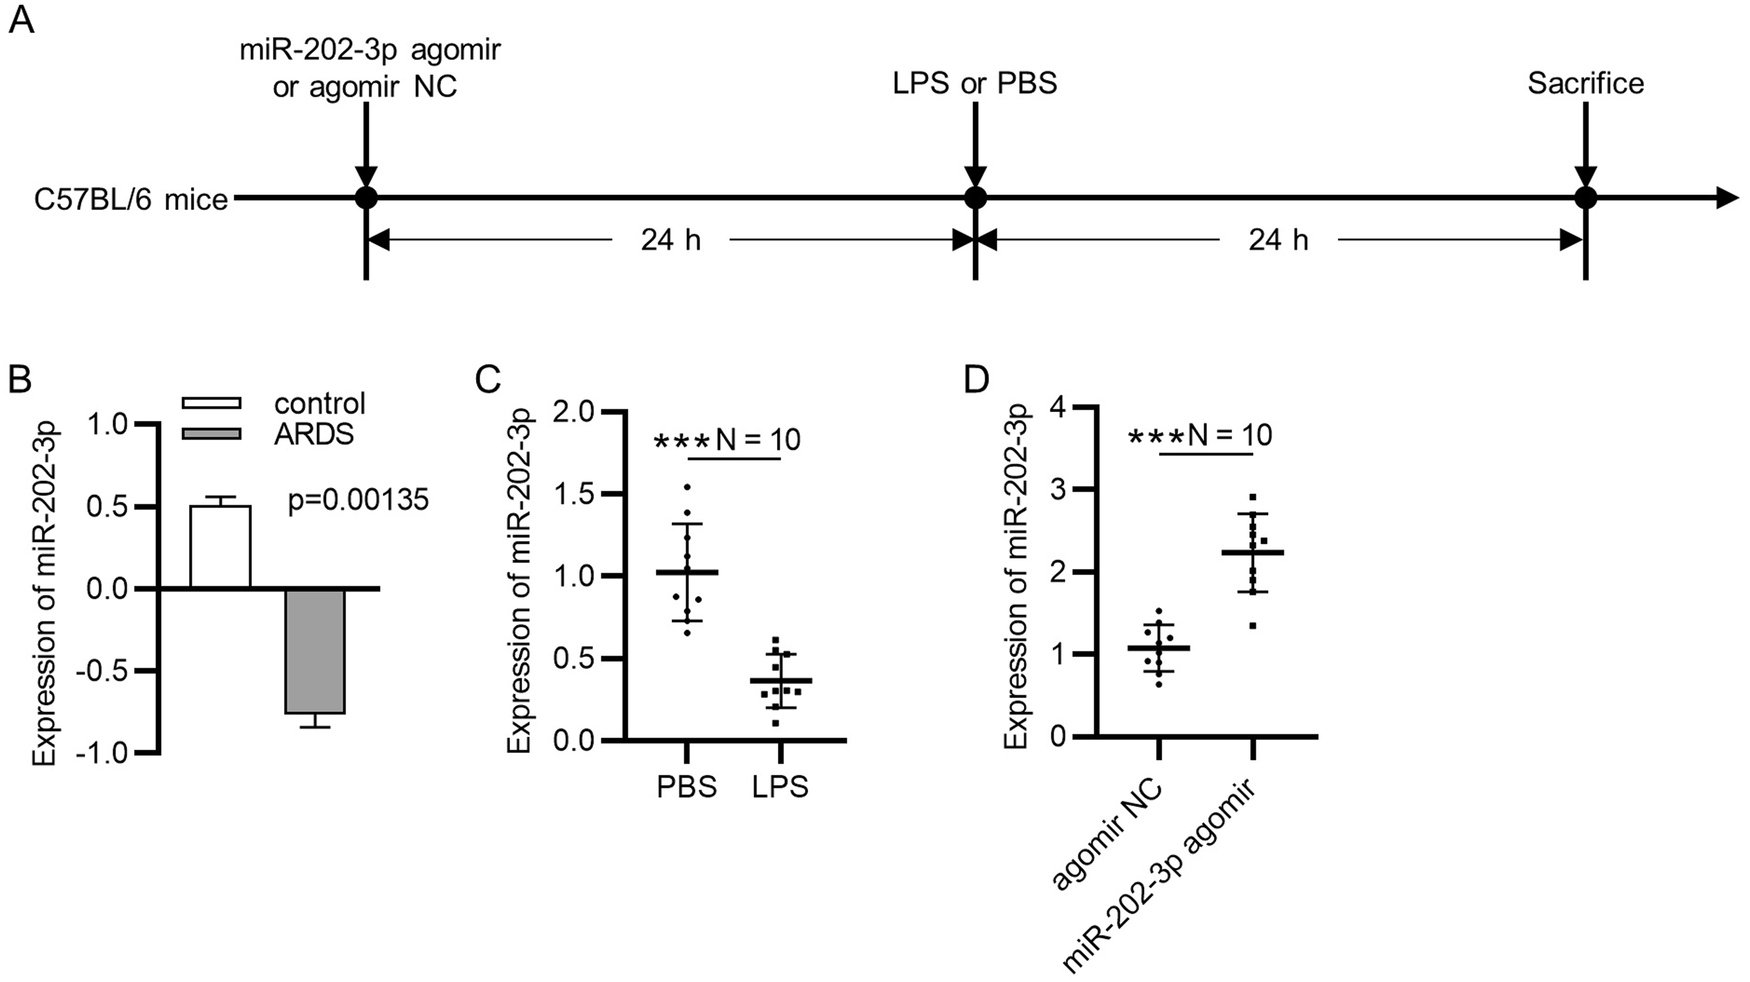
Eight to ten-week-old male C57BL/6 J mice, weighing between 23.5–27.5 g, were purchased from the Institute of Laboratory Animal Sciences, Chinese Academy of Medical Sciences, and housed in a specific-pathogen-free (SPF) animal facility. The mice were randomly divided into four groups: saline+AAV9-GFP group, saline+AAV9-HMGA1 group, LPS + AAV9-GFP group, and LPS + AAV9-HMGA1 group, with 15 mice in each group. The saline+AAV9-HMGA1 group and LPS + AAV9-HMGA1 group were injected intramyocardially with 1×10^11 viral genome particles per mouse of AAV9-HMGA1. Saline+AAV9-GFP group and LPS + AAV9-GFP group were injected intramyocardially with AAV9-GFP. After one week of myocardial viral injection, the mice received intraperitoneal injection of 10 mg/kg LPS in saline solution for 12 h. The mice were euthanized by cervical dislocation, followed by rapid thoracotomy. The intact hearts were quickly removed, fixed in 10% formaldehyde solution, dehydrated, embedded in paraffin, and then sectioned into 5 μm thick tissue slices.
Cell culture and treatment
The H9c2 cardiomyocyte cell line was purchased from the Cell Bank of the Chinese Academy of Sciences. The cells were cultured in DMEM medium containing 10% FBS and incubated at 37 °C in a humidified incubator with 5% CO2. When the cell density reached approximately 80%, the cells were digested with 0.25% trypsin for passage. H9c2 cardiomyocytes were infected with Ad-HMGA1 (MOI = 30) for 8 h to overexpress HMGA1 or transfected with si-HMGA1 for 12 h to knock down HMGA1. After that, H9c2 cardiomyocytes were stimulated with 1 μg/mL LPS for 12 h to induce inflammation.
Echocardiography
Prior to the experiment, the mouse’s chest hair should be shaved and it should be positioned in a supine manner on a detection table for ultrasound imaging. A suitable quantity of ultrasound coupling agent should be applied to the front area of the chest. The ultrasound probe should be gently placed on the coupling agent, positioned tangentially to the long axis of the mouse’s heart. Then, the position and direction of the probe should be adjusted until the short-axis section of the heart’s papillary muscle plane is clearly displayed. M-mode ultrasound should be employed to evaluate the left ventricular ejection fraction. Once the mouse’s breathing becomes stable, the imaging of the cardiac cycle and ventricular chamber movement should be recorded.
Western-blot
The mouse heart tissue or H9c2 cardiomyocytes from each experimental group were lysed in RIPA buffer. The resulting supernatant was collected following sonication and high-speed centrifugation. Protein concentrations were determined using the BCA Protein Assay Kit. Subsequently, the protein samples were separated on a 10% SDS-PAGE gel and transferred onto PVDF membranes. The membranes were then incubated overnight at 4 °C with specific primary antibodies, followed by incubation with secondary antibodies at 37 °C for 1 h. Finally, the protein bands were visualized using the ECL chemiluminescent system.
Total RNA isolation and quantitative real-time PCR
We extracted total RNA from left ventricle tissues and cultured cardiomyocytes using TRIzol® reagent from Invitrogen, following the manufacturer’s instructions. This RNA was then reverse-transcribed into cDNA using the Transcriptor First Strand cDNA Synthesis Kit by Roche. Quantitative real-time PCR amplification was performed using the SYBR Green PCR Master Mix provided by Applied Biosystems. Each PCR reaction was conducted in triplicate, and the results are presented as the mean of relative gene expression normalized to GAPDH gene expression. Primer sequences employed in this research in Table 1.
Table 1 The sequences of the primers for each geneImmunochemistry staining
After dewaxing the tissue sections with xylene and graded alcohols, antigen retrieval was performed using the high-pressure method with citric acid. After blocking with 3% hydrogen peroxide, the sections were incubated overnight at 4 °C with anti-CD45 antibody or anti-CD68 antibody. The next day, the sections were incubated with anti-rabbit EnVisionTM + /HRP reagent at room temperature for 20 min, followed by the addition of DAB working solution under an optical microscope. Finally, the nuclei were stained with hematoxylin, and the sections were dehydrated with graded alcohols and cleared with xylene before mounting.
TUNEL staining
Apoptosis detected by TdT-mediated dUTP nick end labeling (TUNEL) methods. TUNEL staining in cardiac sections was performed using a commercial kit and operated following the manufacturer’s instructions. Briefly, the cardiac tissue sections are dewaxed in xylene and dehydrated in a gradient of ethanol. Then, proteinase K without DNase (20 μg/ml) is added to the cardiac samples, and they are incubated at room temperature for 30 min. The sections are then rinsed with PBS three times, incubated for 20 min at room temperature in a 3% hydrogen peroxide solution (3% H2O2 in PBS), and subsequently rinsed three times with PBS. Post addition of 50 μl of biotin-labeled solution, the samples are rinsed with PBS, followed by the addition of 0.2 ml of labeling reaction termination solution. After that, the samples are incubated at room temperature for 10 min before being rinsed three times with PBS. Subsequently, 50 μl of Streptavidin-HRP working solution is added, and the samples are incubated at room temperature for 30 min, followed by three rinses with PBS. Finally, 0.3 ml of DAB staining solution is added, and the cell nuclei are stained with hematoxylin staining solution.
For the cell, TUNEL staining was performed to observe the apoptosis index following the standard protocol using the ApopTag® Plus Fluorescein in situ Apoptosis Detection Kit. the cells were treated with 1% paraformaldehyde for 10 min at room temperature. After that, a mixture of ethanol and acetic acid was applied for 5 min. Then, the cells were supplemented with the equilibration buffer at room temperature, and then treated with the TdT Enzyme working solution and the Stop/WashBuffer working solution. After incubating the cells with the Anti-Digoxigenin Fluorescein working solution for 30 min in the dark, the samples were sealed using SlowFade Gold Antifade Reagent (with DAPI) to preserve the fluorescence.
CK and LDH
After 12 h of lipopolysaccharide injection, mouse orbital venous blood was taken, left to stand for 30 min, and then centrifuged at 3000 rpm for 10 min at room temperature to obtain the supernatant. According to the manufacturer’s instructions, lactate dehydrogenase (LDH) and creatine kinase isoenzyme (CK-MB) levels were detected. In short, 2 μl of serum was diluted 20 times to 40 μl with ddH2O and added to a 96-well reaction plate. Immediately add 200 μl of LDH or CK-MB detection working solution and place it in a microplate reader for immediate detection. Measure the UV absorbance at a wavelength of 340 nm, read the OD value every minute for a total of 7 times, calculate the slope of OD values for each well in 7 consecutive readings, and calculate the relative change and absolute quantity of LDH or CK-MB. Absolute change value (U/L) = slope × 3376 × 20.
RNA interference
The siRNA was transfected in H9c2 cardiomyocytes using Lipofectamine RNAiMAX transfection reagent. After mixing siRNA and transfection reagent separately with opt-MEM, let them stand for 5 min. After mixing the aforementioned two reagents together and gently stirring, let the mixture stand for 10 min. Then, add the aforementioned mixture to the cell culture medium.
JC-1 assay
The JC-1 mitochondrial membrane potential detection kit was applied to detect mitochondrial membrane potential changes. When the mitochondrial membrane potential is at a high level, JC-1 aggregates inside the mitochondria and turns into red fluorescence. When the mitochondrial membrane potential is at a low level, JC-1 cannot accumulate inside the mitochondria and remains in the cytoplasm as green fluorescent monomers. To perform the staining, the culture medium in the 6-well plate was removed, and a mixture of JC-1 staining working solution and cell culture medium in a 1:1 ratio was added. The plate was then incubated at 37 °C in a dark room for 20 min. After washing twice with JC-1 staining buffer, cell culture medium was added, and the cells were observed and photographed under a fluorescence microscope.
MitoSox staining
The MitoSox assay was used to detect mitochondrial reactive oxygen species (ROS) production. The MitoSox dye is capable of permeating live cells and selectively targeting mitochondria. It undergoes specific oxidation by mitochondrial ROS, generating a red fluorescent product when it binds to nucleic acid. The cells were washed with PBS and stained with 5 μM MitoSOX Red at 37 °C for 30 min, protected from light. After washing with PBS, the cells were observed and photographed under a fluorescence microscope.
ATP and Caspase 3/7 activity
ATP is detected using the CellTiter-Glo® Luminescent Cell Viability Assay, while Caspase 3/7 activity is measured using the Caspase-Glo® 3/7 Assay. Cells are seeded in a 96-well plate and treated according to the experimental design, with the removal of the culture medium prior to testing. The assay reagents are mixed with PBS buffer in appropriate volumes, and 120 μl is added to each well. The plate is placed on a shaker and incubated for 30 min, avoiding light exposure. Then, 100 μl of the reaction mixture is transferred to a solid white, opaque 96-well plate to measure the intensity of the luminescent signal produced by the luciferase reaction. The relative value of caspase 3/7 activity is calculated.
Statistical analysis
The experimental data are presented as mean ± standard deviation (SD). To analyze the results of two groups, an unpaired t-test was conducted, assuming normal distribution for both groups. Differences were considered significant when the p-value was less than 0.05. For comparisons among three or more groups, a one-way ANOVA was performed, and a subsequent multiple comparison test was conducted.


留言 (0)