Data source
Data were collected for an evaluation of Headstart, a programme that focused on improving mental health difficulties and wellbeing, and preventing serious mental health difficulties, for children and young people aged 10 to 16 years (funded by the National Lottery Community Fund). For the present analysis, the dataset was collected between 2017 and 2019 from 104 schools from six local areas in England. The sample of schools was not drawn to be representative of all school children in England; it was based on local areas that were part of the HeadStart programme, and each of the local areas selected the schools to participate [34]. Every year, children and young people from specific year groups/grades in participating schools completed surveys using a secure online system during a usual school day as part of a teacher-facilitated session. Consent was obtained from parents/carers; children and young people provided assent prior to starting the survey, and ethical approval was received by the UCL ethics committee (reference: 8097/003).
Participants
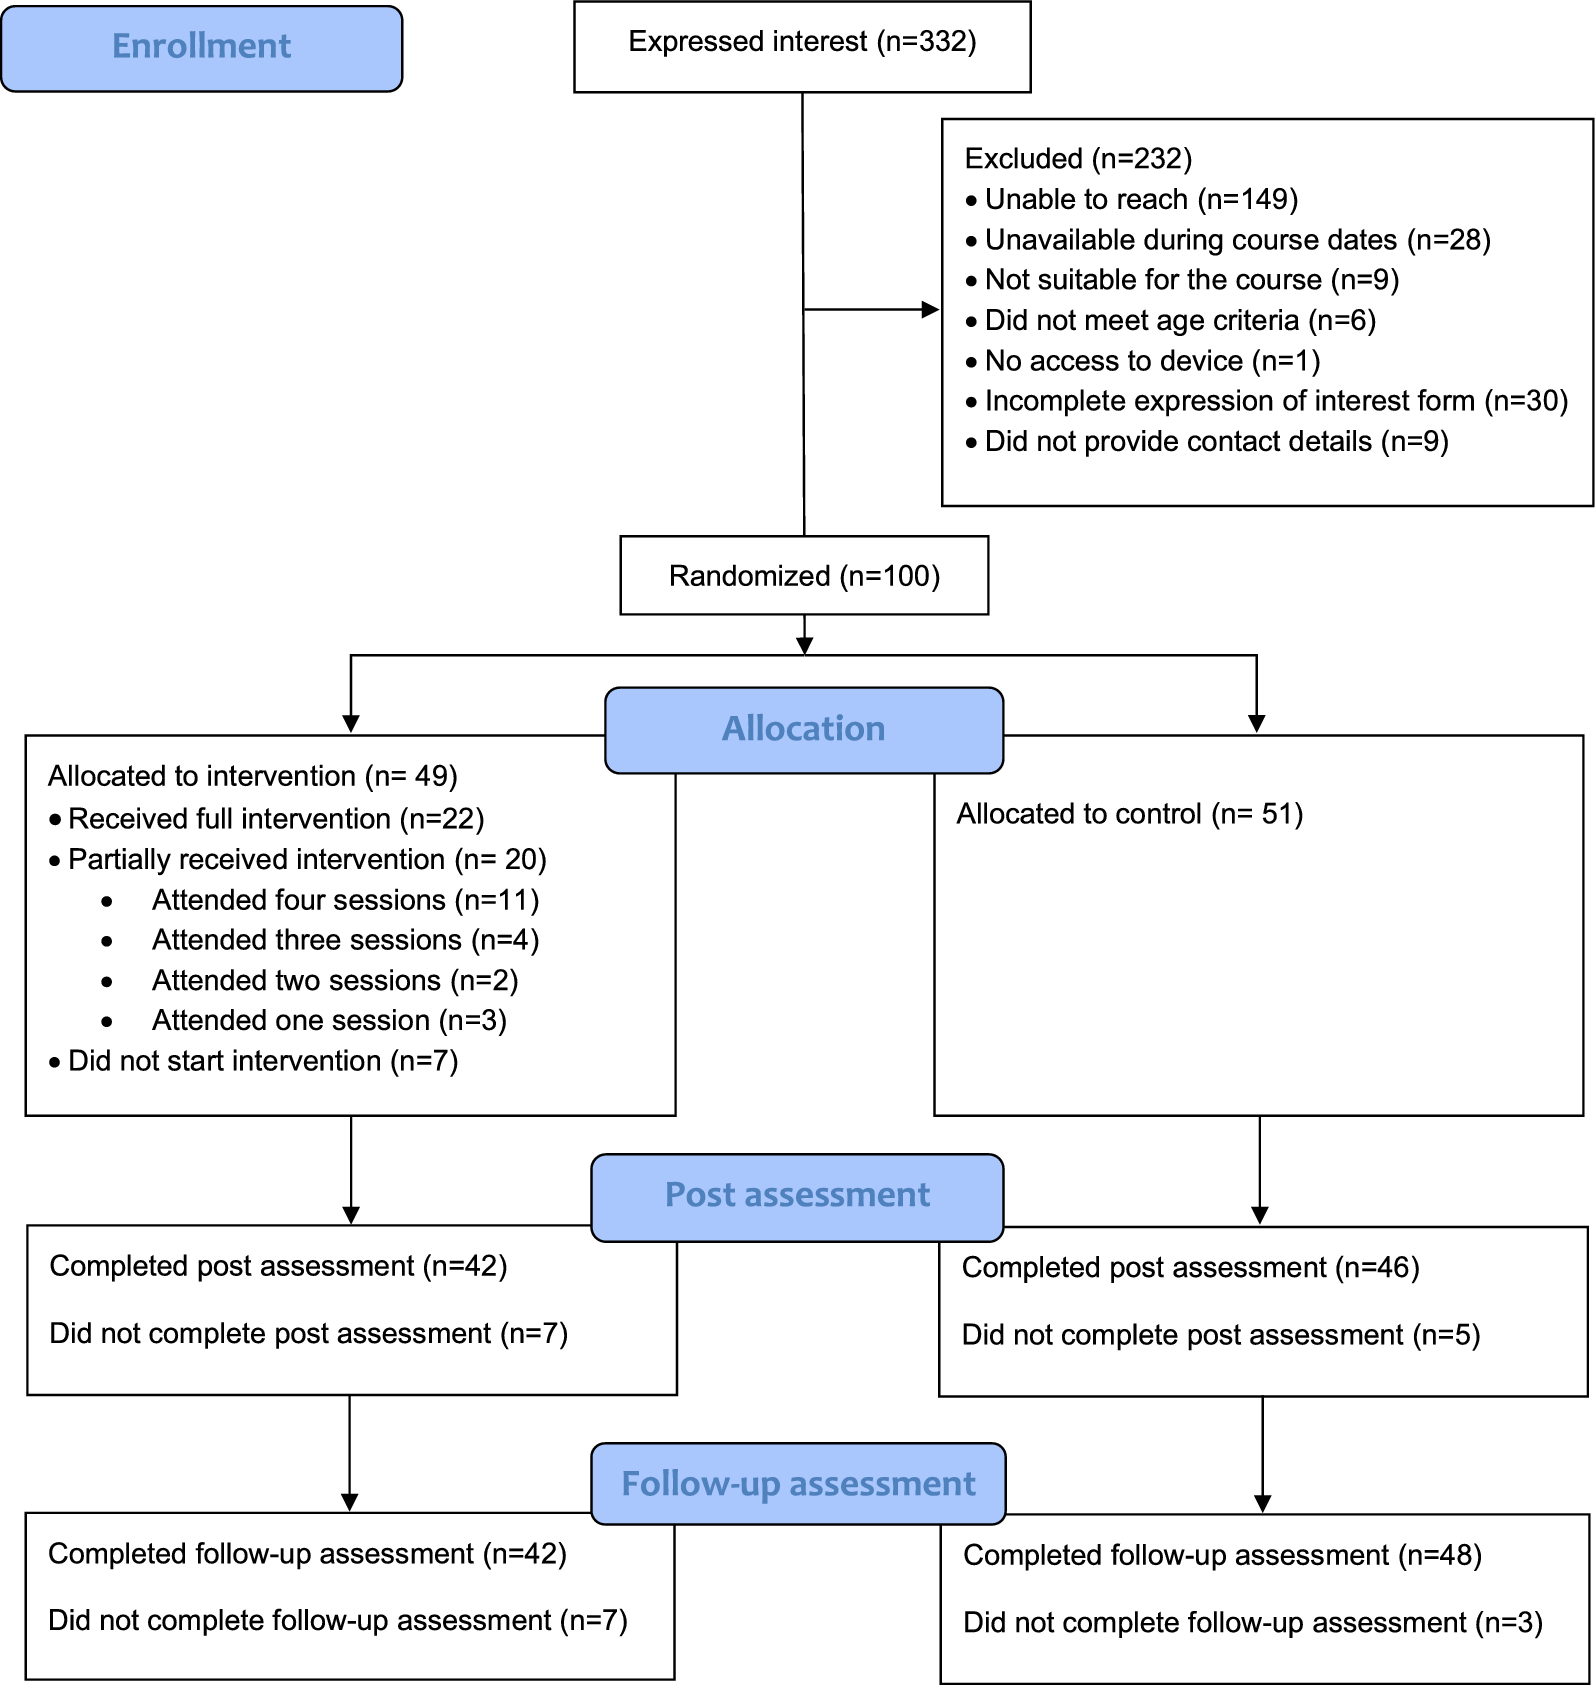
Out of the 15,476 children and young people who completed the survey in year 7 (ages 11 to 12), the analyses reported are based on N = 14,215 children and young people who completed at least one other annual survey in year 8 (ages 12 to 13) and/or year 9 (ages 13 to 14). Compared to the national average, the included sample had a slightly higher proportion of children and young people with higher levels of economic disadvantage, based on eligibility to receive free school meals (study sample: 16.3%, national average: 12.9%). The study sample had a lower proportion of children and young people with support for special educational needs (study sample: 11.8%, national average: 14.4%) and a slightly higher proportion of white children and young people (study sample: 76.0%, national average: 75.2%).
MeasuresSocio-demographic characteristics
The socio-demographic characteristics of children and young people were extracted through data linkage with the National Pupil Database (NPD), which comprises socio-demographic and education data on all children and young people in all schools in England.
Gender identity was extracted from the NPD. As this captured female vs. male, we supplemented the NPD data with self-reported gender identity for n = 2,742 young people who completed the year 11 survey, which had asked about gender identity and had an inclusive range of response options. These two sources resulted in three gender identities: female (cis and trans young women and girls), male (cis and trans young men and boys), and non-binary or questioning. We recognise non-binary and questioning are not the same gender identities; however, we chose to combine them so that we were able to represent diverse gender identities in the analysis. We also recognise that those for whom data were extracted from the NPD may have chosen another identity than female vs. male if they had been asked. We chose to retain the survey responses for the small sample so that we could prioritise the voice of participants who had self-identified and to represent diverse genders, even if not for the entire sample.
From the outset of the study, we worked with young people advisors, who highlighted the importance of using an inclusive definition of gender identity. Hence, while it was possible to distinguish between cis and trans young people (i.e., they were asked whether their gender was different from the sex they were assigned at birth), we have chosen to prioritise young people’s description of their gender. Young people could also choose to not respond to the self-reported gender identity question. We retained these responses in the analysis but do not report them because including this as a category of gender identity, when a person chose to not identify a gender, was conceptually inconsistent. We define gender identity as an aspect of who an individual is, how they are seen, and how they interact with the world around them.
Ethnicity, free school meal eligibility, special educational needs, and child in need status at baseline were extracted from the NPD. Ethnicity was grouped into five broad groupings (Asian, black, mixed race, “other” ethnic groups, and white). Whether a child or young person had ever being eligible to receive free school meals (0 = no, 1 = yes) is frequently used as an indicator of economic disadvantage as only families on income support are eligible. The presence of special educational needs (0 = no, 1 = yes) refers to formally identified needs. The presence of a child in need status (0 = no, 1 = yes) refers to social care needs, most frequently because of concerns about abuse or neglect, acute family stress, or family functioning.
Mental health difficulties
To measure mental health difficulties, the 25-item self-reported Strengths and Difficulties Questionnaire [SDQ; 35] was used. It comprises four difficulties scales (emotional difficulties, behavioural difficulties, hyperactivity and/or inattention difficulties, and difficulties with peer relationship) and a strengths-based prosocial behaviour scale. Each sub-scale has 5 items and each item of the SDQ is scored on a 3-point scale with 0 = not true, 1 = somewhat true and 2 = certainly true. Emotional difficulties and behavioural difficulty scores are created by combining 5 items of the respective subscales and scores ranged from 0 to 10, with higher scores indicating higher levels of difficulties. A total of the four difficulties subscales (20 items) are used to create an overall total difficulties score, with scores ranging from 0 to 40 with higher scores indicating higher levels of difficulties. We focussed on the emotional and behavioural difficulties scores, as they were of particular relevance to the research questions, and the total difficulties score, which also includes the remaining two subscales. The SDQ is a widely used measure with evidence of reliability and validity [36]. For the current study, the Cronbach’s alphas for total difficulties were 0.81, 0.82, and 0.82 for the first, second, and third years, respectively.
Analytic strategyRQ 1: are there distinct groups of trajectories for mental health over time?
Group-based trajectory models were used to determine whether distinct trajectory groups of mental health difficulties could be recovered from three time points between year 7 (ages 11 to 12) and year 9 (ages 13 to 14). Group-based trajectory models allow clusters of individuals who share similar trajectories over time to be identified [37]. The group-based trajectories over time were modelled in Stata 17 (StataCorp, 2021, College Station, Texas, USA) using the plugin Stata Traj [38]. Detailed documentation of the Traj procedure can be found at https://www.andrew.cmu.edu/user/bjones/.
We deviated from the pre-registered protocol by analysing data spanning three years (2017/18, 2018/19, 2019/20) instead of the planned four years (including 2020/21). This adjustment was made due to data availability constraints. Additionally, our focus narrowed to mental health difficulties exclusively, omitting wellbeing from the scope for increased precision.
Models were estimated separately for total difficulties, and then emotional and behaviour difficulties for a more detailed examination. To determine the number of trajectory groups that best fit the data, we fitted between one and nine trajectories for each outcome, using quadratic polynomial terms to allow for non-linear trajectories to be recovered. In the instance where there were estimation problems due to the polynomial terms, these terms were removed from the model for the groups where the terms were indicated to be problematic. As a sensitivity check, the solution was verified against the model with the same number of classes, but only linear terms were specified to test interpretation. We used the Bayesian Information Criterion (BIC) as a fit index for selecting the best fitting model [39, 40], where BIC values closest to zero denote a better fitting model. However, because BIC sometimes keeps improving (decreasing) when adding trajectory groups [37], we considered a model inferior when a trajectory group contained less than 5% of the sample and when the model no longer captured new distinctive features of the data [41]. The degree to which the models were able to classify children and young people into different groups was assessed using entropy and average posterior probabilities of class membership [37].
RQ 2: are young women and girls more likely to be represented in trajectory groups with higher levels of, and/or steeper increases in, mental health difficulties?
Once the solution with the optimal number of groups was selected, the mental health difficulties models were extended to incorporate the estimation of socio-demographic characteristics that may be associated with the probability of a group trajectory. For gender identity, male was selected as the reference category as the focus of the analysis was young women and girls. For ethnicity, white was selected as the reference category as it was the largest group. The use of full-information maximum likelihood meant that all children and young people providing outcome data for the first wave of data collection and at least one of the other assessments were retained in the analysis, under the assumption that data were missing at random (i.e., conditional on variables associated with missingness being included in the model).
The analysis was conducted using Stata 17.
RQ 3: which marginalised identities are more likely to be represented in trajectory groups with higher levels of mental health difficulties?
The trajectory models for the mental health difficulties included ethnicity, free school meal eligibility, special education needs status, and child in need status.
RQ 4: is there evidence for intersectional effects between gender and membership of other marginalised groups?
Multinomial logistic regressions were conducted predicting group membership (using the identified solution) with the socio-demographic characteristics and interaction terms between gender (female, male) and the remaining socio-demographic characteristics (ethnicity, free school meals, special educational needs, child in need). Due to the small number of individuals identifying as non-binary or questioning, it was not possible to examine interaction effects with predictors for this group. Models were weighted by the probability of class membership to account for classification uncertainty.

留言 (0)