
記住我


This school-based quasi-experimental study was conducted among 12 − 19 years school-going adolescents in grades 6 to 10 in two private schools in Banepa Municipality, Kavrepalanchok district of Nepal. Banepa is located about 25 km to the east of Kathmandu the capital city of Nepal. This study was conducted between February 2020 and July 2020. The study was reported using Transparent Reporting of Evaluations with Non-randomized Designs (TREND) guidelines [25].
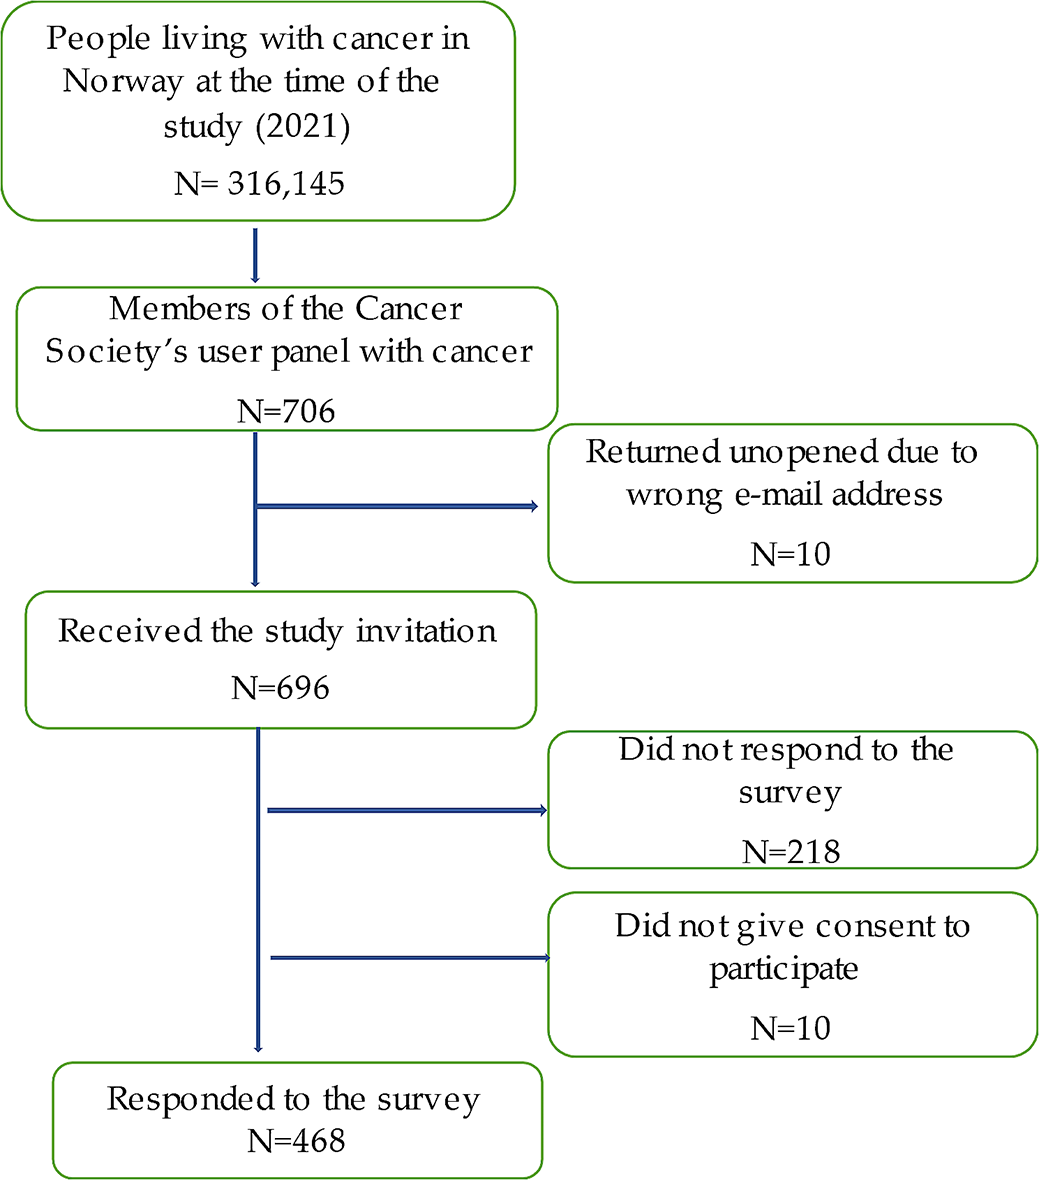
ParticipantsStudy participants included 226 school-going adolescents, aged 12 − 19 years who were studying in grades 6 to 10 (Fig. 1). Those students who were able to answer the questionnaire items from grade 6 to grade 10 were present on the day of data collection were included in this study. Adolescents with medical conditions, such as physical and psychological issues, as well as those who were reluctant to participate and were absent on program days, were excluded from the study.
Fig. 1
Flow diagram of the study
OutcomesThe primary outcome of this study was to measure the change in nutrition knowledge of participants after a 12-week nutrition educational intervention, and the secondary outcomes were to evaluate change in nutrition attitude and diet quality among school-going adolescents.
InterventionIn the intervention group, students were assigned to receive a nutrition education package, whereas the control group received no instruction regarding nutrition education, and they responded to questions based on regular health and nutrition education dissemination through the school curriculum/textbook. Follow-up data were collected after 12 weeks of nutrition education intervention. As per the nutrition education package, we provided 45 min of nutrition education sessions a day per week for intervention group in each grade (grade 6–10). Therefore, the students in the different grades received nutrition education session separately.
During the intervention phase, trained nutritionists/dietitians provided nutrition education to the intervention group using educational materials such as posters, leaflets, pamphlets, educational videos, and PowerPoint. The education package was developed by academic researchers and all materials reviewed by a multi-disciplinary expert group consisting of an academician and a dietitian before the intervention. A one-hour mini-lecture and interactive discussion session were conducted in the classroom. All the educational activities were carried out in the respective classroom for each section. The nutrition education sessions lasted approximately one hour in each class for five days and were held at the time of enrollment. Information and educational materials (posters, leaflets, pamphlets, educational videos, and PowerPoint) were handed out at the end of each session. The control group on the other hand did not receive the education package.
The nutrition education package contained important information on healthy eating habits, eating disorders in adolescents, food labels, knowledge of a balanced diet, and the consequences of poor eating habits. The origins and key roles of macro-and micronutrients, as well as the recommended dietary intake of various food items for teenagers and the principles of my plate, were also highlighted during the nutrition education session [26]. Follow-up visits were undertaken every four weeks to ensure the progression of healthy eating habits and a better understanding of nutrition.
Sample sizeThe sample size was determined using effect size estimations of the difference in means between two independent groups using nutrition knowledge as the primary outcome variable, with a significance level (two-tailed) of 0.05 and a statistical power of 90%. Based on a similar study conducted by Fahlman et al. (2008) [27] where, the proportion of the nutritional knowledge score in the intervention and control groups was 0.49 and 0.39, respectively. The final sample size was 226 (113 participants in the intervention group and 113 participants in the control group, respectively) with a 10% non-response rate. The sample size was calculated using a test comparing two means in Stata/MP version 14.1 (StataCorp LP, College Station, Texas).
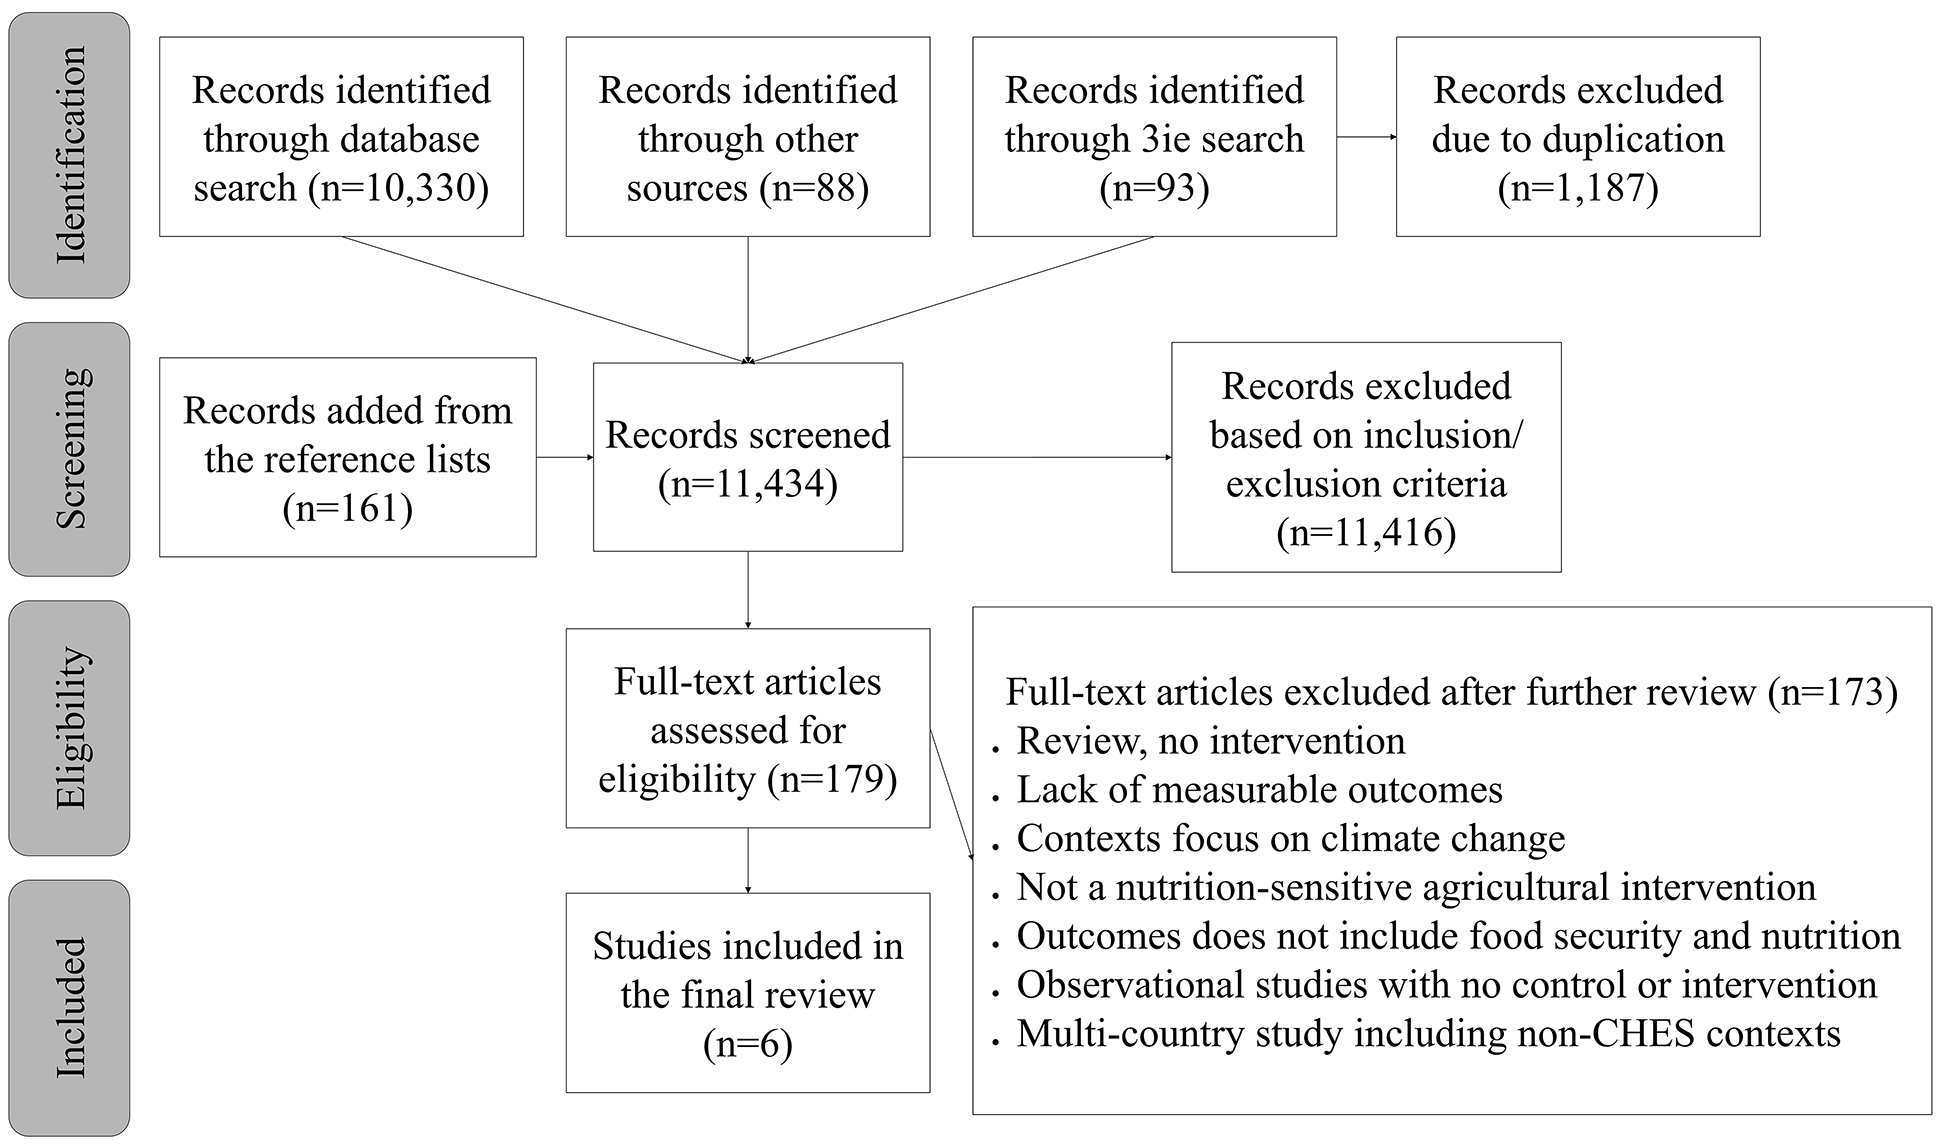
RecruitmentA list of private schools was obtained from Banepa Municipality. Each school has approximately 350 adolescents enrolled. Of 20 schools, only two private schools were chosen purposively chosen because the adolescent students in the two schools were adequate to meet the required sample size. The allocation of the intervention and control groups among the two schools was determined through the use of flipping a coin(Fig. 2). A complete list of sections/classes for each school was compiled with the help of a school’s administration registry. All students in grades 6 to 10 who were willing to participate in the study were enrolled individually from the two schools for both the intervention (n = 113) and control (n = 113) groups. The average number of students in each of the schools was around 350; however, the total number of students included in the study (n = 113 for each group) is less than the total number of students enrolled in the schools (N = 350). We approached all students to participate in the study, although the study sample size was determined to be 113 for each group. Among them, a few students dropped out due to loss of follow-up, unwillingness to give consent, absence on the day of enrollment, and illness. Thus, not all students were included in the study.
Fig. 2
Map showing study area. The map was created using ArcGIS desktop version 10.8. The shape file of the administrative districts and location for Nepal was obtained from the Government of Nepal, Ministry of Land Management, and Survey Department website and was publicly available for unrestricted use
Data collection tools and techniquesData was collected by postgraduate (MSc. Nutrition and Dietetics) students who were provided with three days of training that included the objective of the study, data collection procedure, sampling method, ethical aspects of the study, and data entry techniques. Face-to-face interviews were conducted using pre-tested semi-structured questionnaires. Baseline interviews lasted almost 30 min in each school, and post-test data collection was conducted after 12 weeks of nutrition education intervention. All the tools were originally developed in the English language. Further, the tools were translated into the Nepali language and back translated into English to ensure the validity (and reliability) of the tool. Pretesting of the tools was carried out among 28 students from the neighboring school of Banepa Municipality.
The socio-demographic information includes age, sex, grade, religion, ethnicity, parent’s occupation, and parent’s education. The nutrition knowledge, attitude, and diet quality questionnaires were adapted from a previous study [21] and then translated into Nepali. The research committee and faculty members reviewed the pre-tested questionnaire to establish its validity and reliability. The questionnaire was revised appropriately based on their feedback. The Nepali version of the nutrition knowledge, attitude, and diet quality questionnaire had acceptable internal consistency (Cronbach’s alpha of 0.62, 0.72, and 0.61, respectively). However, the internal consistency of a score/scale is good at ≥ 0.7, and findings of ≥ 0.6 have also been deemed satisfactory or acceptable [28, 29].
Nutrition knowledge levels were determined based on eighteen questions (Q1 − Q18). The short form of the Food Frequency Questionnaire for Polish Children (SF-FFQ4PolishChildren) was adopted first in English and developed by Whati et al. [30], then translated into Nepali and modified to fit the Nepalese context. Correct answers were scored one point, while wrong or “don’t know” answers and missing data were given zero. The points of each respondent were totaled and examined further.
Attitudes toward nutrition were determined using a three-factor eating questionnaire (TFEQ13) designed specifically for youngsters. We utilized a simplified version of the questionnaire (TFEQ10) used by Hamulka et al. [21]., which consisted of only ten statements that further modified and verified the questionnaire for Nepalese settings. Three subscales, in a shortened version, were developed: emotional eating (Q1, Q3), Uncontrolled Eating (Q2, Q4, Q5, Q6, Q8), and Cognitive Restraint of Eating (Q7, Q9, Q10). Each subscale’s score was determined as the total of points allocated to respondents’ responses. All the responses were scored such that the responder may pick one of four options for each question: “definitely yes” (3 points), “rather yes” (2 points), “rather not” (1 point), and “absolutely not” (0 points).
Participants were asked to specify their usual frequency of consumption for the past 12 months for breakfast and school meals and nine food items such as dairy products, fish, vegetables, fruits, fruits or mixed fruit-veggie juices, fast foods, sweetened carbonated drinks, energy drinks, and sweets or confectionery [21]. It consisted of 11 questions. The diet quality scores were used for pro-Healthy Diet Index (pHDI), which were obtained by adding the daily frequencies of specific food items (as previously described) and expressing them as a percentage (range: 0 to 100). The diet quality scores were established (a priori approach) based on usual food frequency consumption within the last 12 months [21].
Data management and analysisThe collected data were entered into EpiData software 3.1v and transferred into Stata/MP version 14.1 (StataCorp LP, College Station, Texas) for statistical analysis. The Chi-squared test was used to compare socio-demographic factors in the intervention and control groups at baseline. The student’s two-sample t-test was used to compare post-intervention magnitude of changes in nutrition knowledge, nutrition attitude, and diet quality scores between the intervention and control groups. To estimate changes between the control and intervention groups at baseline and follow-up, the Difference in Differences (DID) analysis was performed [31, 32]. We did not randomly assign the participants in the control and intervention group due to the nature of quasi-experimental study design. So, we used DID methods expecting to control heterogeneity between treatment and control group and achieve better exchangeability. In addition, there was a chance of both information and selection bias, which DID help minimize such bias by comparing changes in outcomes within each group. The statistical significance was considered at p-value < 0.05 and 95% confidence intervals (CIs).
Ethical considerationsThe ethical approval for this study was obtained from the Ethical Review Board (ERB) of the Nepal Health Research Council (Ref.no 1976). Formal permission was also obtained from the respective private schools. Written informed consent was obtained from all parents or legal guardians for eligible participants. The data collector also shared the objectives of the study with each participant before the baseline data collection and nutrition education. Participants and their parents or legal guardian were informed about voluntary participation, their right to refusal at any point, and the confidentiality of their identity.
留言 (0)