
記住我
The analysis of cellular lipidomics as a powerful tool to characterise cells or cellular states has gained a lot of attention throughout the last two decades [1]. Mass spectrometry-(MS) assisted lipidomic analyses have been developed as a routine to analyse lipidomes of basically any cell type, tissue or cell-organelle from any species [2][3][4][5][6]. Importantly, lipidomic changes can be associated with ageing [7][8][9] or manifest in a diversity of diseases. These include neurodegenerative diseases such as Alzheimer's disease and dementia [10] or cardiovascular diseases [11]. Lipidomics are further key to investigate lipotoxicity mechanisms which are fundamental to lipid-related diseases [12]. Hence lipidomics also offer potential use as diagnostic markers of disease and ageing.
–
The budding yeast Saccharomyces cerevisiae is used as a model organism in scientific research because of several reasons: It is easy to grow at large quantities, cultures are clonogenic, genetic modifications are easy to perform and an ever-growing number of yeast libraries [13] is available. S. cerevisiae has been harnessed to study cellular processes such as autophagy [14][15][16][17][18][19], ageing [20][21][22][23][24][25], cell death [26][27][28][29][30], lipid metabolism [31][32], lipid droplet (LD) dynamics [33][34][35][36], lipotoxicity [26][37][38][39], actin dynamics [40][41][42][43][44], vesicle traffic [45][46][47][48] and many others. A connecting feature of the before-mentioned cellular processes is the importance of cellular lipid analysis. Changes of cellular lipid homeostasis can significantly contribute to the regulation of cell health and death, which makes lipidomic analysis an important tool for the research community.
–
MS-assisted lipidomics are very sensitive and deliver precise pictures of lipidomes. One draw-back of MS-assisted lipidomics, however, is the need of expensive MS equipment including established lipidomic protocols or, alternatively if outsourced, high costs for lipidomic services offered by commercial companies. High-performance thin-layer chromatography (HPTLC) represents a low-cost alternative for lipidomic measurements. The method is not as sensitive as MS-assisted lipidomics but is suitable to detect the major neutral lipid and phospholipid classes especially if availability of sample material is not a limiting factor. Simple thin-layer chromatography (TLC) has been used extensively in the past for lipid quantification [49][50][51][52][53][54]. Importantly, HPTLC has emerged as a more powerful advancement of the technique, which is mainly achieved through the use of improved HPTLC plates. HPTLC plates still mostly contain silica gel coatings such as conventional TLC plates, but the plates are generally smaller, contain pre-coatings with smaller particle size and narrower particle size distribution [55]. The plates further contain thinner layers and the surface is smoother [55]. These features altogether reduce sample quantity requirements and allow for more economical and faster separation with reduced diffusion rates [55][56][57]. This results in higher sensitivity, more efficient separation and better sample resolution, and also positively affects reproducibility [55][56][57].
–
Here we describe a method to analyse basic lipidomics in yeast using HPTLC and offer comparison to measurement of the same samples with MS-based shotgun lipidomics. We further validate the lipidomic quantification method using two established yeast knock out models (1. dga1Δ lro1Δ are1Δ are2Δ (quadruple knock out; QKO), and 2. pah1Δ) both bearing characteristic impacts on lipid metabolism.
RESULTS AND DISCUSSIONWe aimed at establishing a standard protocol for HPTLC-based quantitative lipidomics in yeast. Since no one-dimensional separation system with a single solvent mixture is capable to fully separate neutral- and phospholipids in one run, we decided to separate the neutral lipids with n-hexane, n-heptane, diethylether, acetic acid (63/18.5/18.5/1 v/v/v/v) as mobile phase [58], whereas phospholipid separation was carried out using chlorofom (CHCl3), methanol (MeOH) and distilled water (dH2O) (32.5/12.5/2; v/v/v) as mobile phase [49][53][54]. Unmodified yeast lipids are invisible on HPTLC plates. We thus compared a number of common derivatisation procedures to visualise the lipid classes [49][57]. The most commonly used procedures for non-specific lipid derivatisation include carbonisation (also called charring) by heating after spraying with 10-50% H2SO4 or MnCl2. These derivatisation steps irreversibly alter the lipid moieties which can be problematic if further analysis of the lipids is desired. Reversible staining with iodine vapor or usage of the fluorescent dye primuline are alternative non-destructive methods for visualisation [56][57]. We decided to use the fluorophore primuline as a revealing agent which in fact is not a derivatising agent as it only involves non-covalent interaction of the fluorophore with the lipid [57]. Primuline unspecifically interacts with the lipid hydrocarbon chains by dipole-induced dipole interaction. This interaction with long hydrocarbon chains leads to an increase in Primuline's-fluorescence intensity [59]. Primuline-based detection offers good sensitivity while at the same time not being limited to unsaturated or saturated fatty acid moieties. However, the fluorescence intensity signal may vary upon the hydrocarbon chain length.
–
1. Establishing suitable lipid standards for neutral and phospholipid analysis
We first established standard mixtures of pure single component lipids for neutral and phospholipid separation. We tried to select lipid components, which structurally relate the most to yeast lipids with regard to carbon chain length and saturation/unsaturation-level. Thus, we chose substances containing palmitate (16:0), palmitoleate (16:1), stearate (18:0) and oleate (18:1), which are the predominant acyl-moieties in S. cerevisiae [31][60][61]. We reasoned that our choice of lipids in the standard emulates the main components of the yeast lipidome to allow for an accurate quantification of the main lipid classes.
–
The single component TLC run of the neutral lipid standard shows single bands for almost all of the components which include oleic acid (OA) as representative for fatty acids (FA), triolein as representative for triglycerides (TG), cholesterylformate (CF), which was used as internal standard, and cholesteryl-oleate as representative sterol ester (SE; Fig. 1A). However, ergosterol (Erg) unexpectedly delivered two bands, one at the expected Rf distance and an additional one at the origin of application, which was considered as impurity and thus ignored. As diglyceride (DG) standard we used 1-palmitoyl-2-oleoyl-sn-glycerol, which also delivered two bands. The main band at the bottom was considered to correctly relate to 1-palmitoyl-2-oleoyl-sn-glycerol, whereas the upward-shifted second band at lower intensity was considered to be a result of limited acyl-migration yielding 1,3-derivatives. Since this second band is not properly separated from the Erg band, which runs at approximately the same height, the results for Erg are to be used cautiously or better be analysed in a separate run. The use of an alternative Erg product should also be considered to get rid of the unspecific band at the origin of application.
–
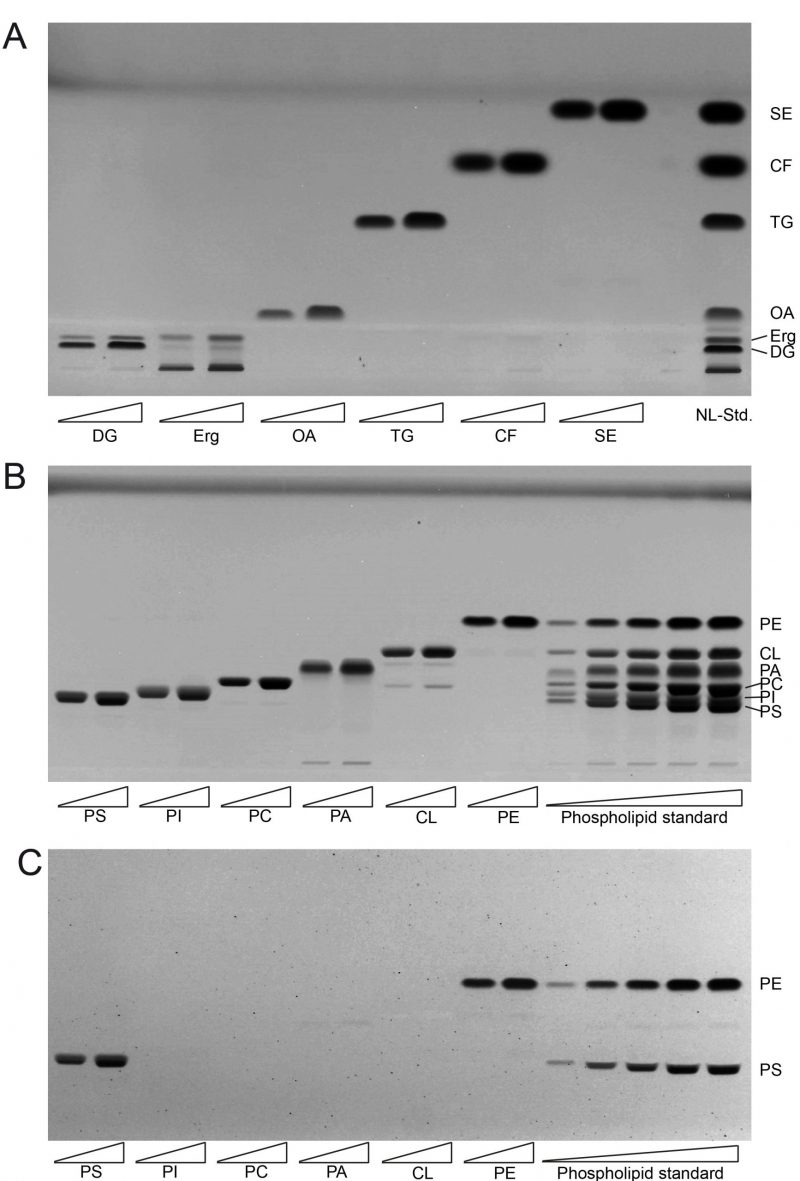
FIGURE 1: Establishing lipid standards for HPTLC. (A) Developed HPTLC plate showing single components of neutral lipid standard (NL-Std.) with an absolute input of 5 µg (left) and 10 µg (right). (B) Developed HPTLC plate showing single components of phospholipid standard (PL-Std.) with an absolute input of 5 µg (left) and 10 µg (right). In the final five lanes the whole PL-Std.-mixture was applied at increasing concentrations from 500 ng to 12.5 µg absolute mass. (C) The developed HPTLC-plate from panel B was derivatised using ninhydrin to visualise PS and PE only. FA, fatty acid; TG, triglyceride; CF, cholesterylformate; SE, sterol ester; Erg, ergosterol; DG, diglyceride, PI, phosphatidylinositol; PC, phosphatidylcholine; PE, phosphatidylethanolamine; PS, phosphatidylserine; CL, cardiolipin; PA, phosphatidic acid.
–
The single component standard of phospholipids included phosphatidylethanolamine (PE), cardiolipin (CL), phosphatidic acid (PA), phosphatidylcholine (PC), phosphatidylinositol (PI), and phosphatidylserine (PS). HPTLC-based separation of the individual standards at two concentrations revealed one major band representative for each phospholipid (Fig. 1B). Additional minor bands were only observed at very low densities which was the case for PA (at the origin of application) and for CL (at the approximate Rf-values corresponding to PA and PC). The combined mixture of PL (phosphor lipid)-standards could be separated efficiently at low PL-input levels. At higher application concentrations a full separation of PI and PS could not be achieved. Additional derivatisation with ninhydrine however revealed single bands for PE and PS only (Fig. 1C). Derivatisation with ninhydrine was thus considered mandatory to allow for precise PS quantification at high concentrations, excluding any PI in our HPTLC-system.
–
2. All major lipid classes of whole cell yeast extracts can be separated and quantified in two separate runs for neutral and phospholipid analysis using HPTLC
We next cultivated yeast in synthetic complete medium with 2% glucose and additional inositol (SCD+Ino; see note 2) for 6, 12 and 24 hours and extracted the total lipids by Folch extraction according to our standard protocol. Neutral lipids and phospholipids were separated in two distinct HPTLC analyses runs as described in results part 1 and in the methods section. All neutral lipids which include SE, CF (internal standard), TG, OA, Erg, and DG could be separated efficiently using the yeast lipid extracts at any tested timepoint and attributed to references in the neutral lipid standard (Fig. 2A, B). OA-levels are at the detection limit with a total sample application volume of 20 µl, but efficient separation is documented in the 6-hour-samples, where OA-levels are highest.
–
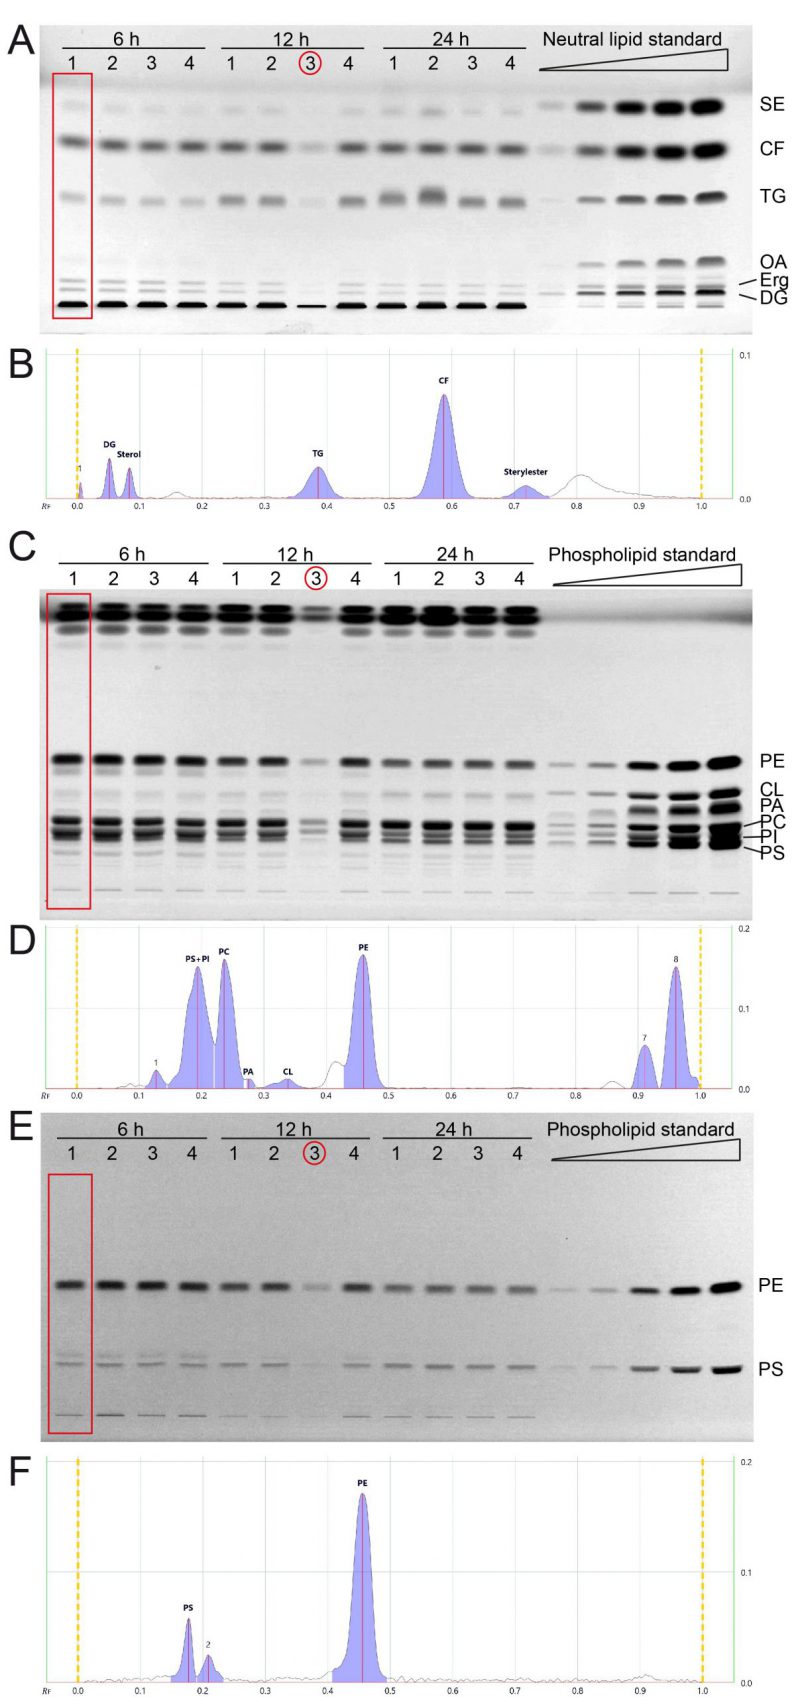
FIGURE 2: All major lipid classes of whole cell yeast extracts can be separated and quantified in two separate runs for neutral and phospholipid analysis using HPTLC. (A) Neutral lipids were separated by HPTLC with a mobile phase consisting of n-hexane, n-heptane, diethylether, and acetic acid (63/18.5/18.5/1 v/v). Lipids were derivatised using primuline. (B) Example chromatogram with peak integration of lane 1, corresponding to the red rectangle in panel A (Wt 1, 6 h) (C, E) HPTLC plate showing phospholipid separation, sequentially derivatised using Primulin (C) to visualize all lipids and then applying ninhydrin (E) to visualise lipids containing free amino-groups such as PE and PS. As an example of chromatogram peak integration, representative chromatograms of lane 1 from (C) and (E) are shown in (D) and (F), respectively. *During the lipid preparation of the third replicate of the 12 h condition (indicated by red circle) material was lost, which resulted in lower overall concentration/yield.
–
The phospholipids PE, CL, PA, and PC could be separated efficiently using the developing system described in the methods section (Fig. 2C, D). PI and PS could only be separated at lower concentrations, which is the case for samples harvested at 12 and 24 hours. The 6 hour-samples have higher PI (and PS) levels which results in inefficient peak separation (Fig. 2D). However, additional derivatisation with ninhydrin, which visualises compounds containing free amino groups, was used to additionally measure PS and PE (Fig. 2E, F). This ninhydrin-based measurement of PS can be used to separately quantify PS without PI and subsequent calculations deliver the remaining values for PI as well. We further noticed a third band on the ninhydrin-derivatised plates (Fig. 2E) which relates to peak 2 in the chromatogram (Fig. 2F), which runs slightly further than the main PS band, and is best visible in the 6 h samples. We reason that this band is representative for PS-species or derivatives which occur at lower abundance in yeast.
–
3. & 4. Comparison of HPTLC-based lipidomic quantification of major lipid classes to MS-based shotgun lipidomics
We next wanted to quantify and compare the results obtained by HPTLC-based lipidomics with MS-based shotgun lipidomic analyses of the exact same samples. The samples were sent to Lipotype, a company which commercially offers lipidomic analyses. The data obtained from lipotype were converted from molar concentrations into absolute mass concentrations according to our conversion table (accessible at Mendelay data) to allow for direct comparison with HPTLC results. The bulk graphical representations of both analyses deliver a similar overall picture for neutral (Fig. 3A, B) and phospholipid (Fig. 3C, D) quantities, which suggests good comparability of both methods for lipid analysis (see also note 3). Please note that a relative representation of these data is given in the supplemental data (Fig. S1A-D). A Pearson correlation analysis of absolute data pairs attested highest correlation at the 6 h timepoint. The correlation analysis further suggests that comparability is most robust for PA (except for the 24 h timepoint, where PA was beyond detection limit with HPTLC), PI, PE, and DG at all tested time points and PC and PS at 6 h and 12 h time points (Fig. 3E, Fig. S2). An analysis of Pearson correlation using the relative datasets as shown in the supplemental data (Fig. S1E) suggests highest correlation for TG and DG at all tested time points, PE at 6 h and 24 h, CL at 12 h, PA at 6 h and 12 h and PS at 12 h.
–
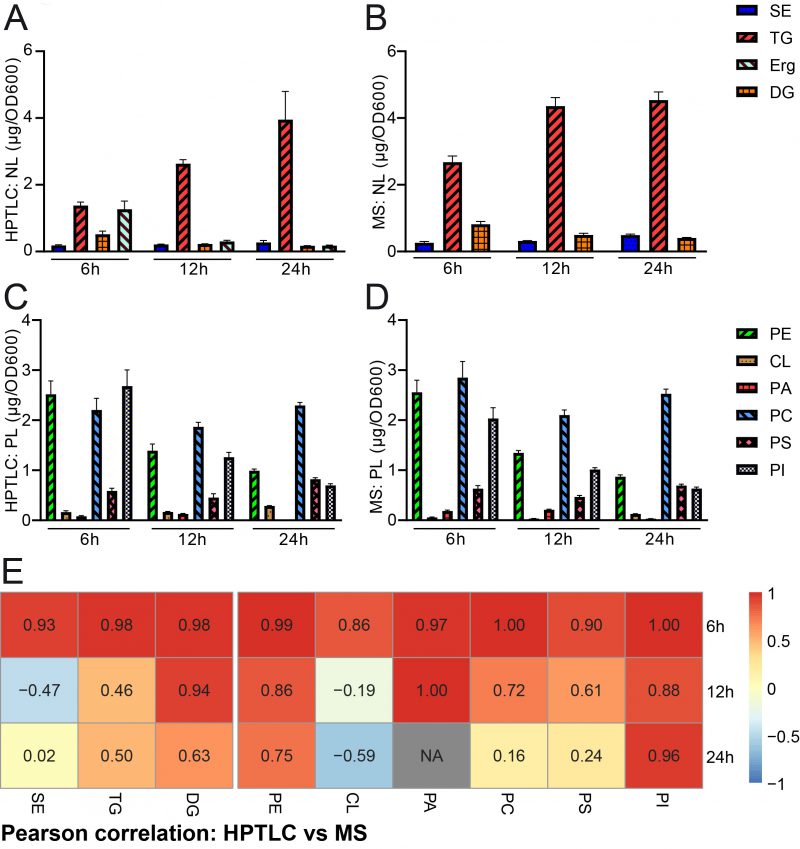
FIGURE 3: Comparative quantification of HPTLC-lipidomics and MS-assisted shotgun lipidomics. (A, B) HPTLC-derived neutral lipidomic quantification (A) and analysis of the same samples by MS-based shotgun lipidomics (B) deliver comparable results regarding absolute amounts of total neutral lipids in yeast. (C, D) HPTLC-derived phospholipidomic quantification (C) and analysis of the same samples by shotgun lipidomics (D) deliver comparable results regarding absolute amounts of the major phospholipid classes in yeast. (E) Pearson correlation analysis comparing HPTLC with MS results. Additional relative data quantification in mol % is depicted in Fig. S1 and scatter plots visualising individual pairs for Pearson correlation are shown in Fig. S2.
–
Pairwise statistical testing for significant difference between both measurements was assessed for individual lipid classes comparing the absolute values (Fig. 4 A–I) and relative values (Fig. S3 A-I). The absolute results for SE (Fig. 4A) and PS (Fig. 4H) do not differ significantly at any tested timepoints no matter which detection method was used (HPTLC or MS). Likewise, TG (Fig. 4B) and PC (Fig. 4G) results do not significantly differ at 12 h and 24 h time points. Absolute PE (Fig. 4D) comparisons are best at 6 h and 12 h showing no statistical differences between both methods. Statistical differences however were detected for TG at 6 h (Fig. 4B), DG at 6 h and 24 h (Fig. 4C), PE at 24 h (Fig. 4D), CL at all timepoints (Fig. 4E), PA at 6 h and 12 h, PC at 6 h and PI at all tested timepoints. We noted that DG quantification delivered higher values by MS as compared to the HPTLC method, which is significant at 6 h and 24 h measurements (Fig. 4C). This could be explained either due to limited sample degradation in HPTLC samples or a matter of working on the edge of detection sensitivity. Additionally, we observed that scattering of individual data points is higher at earlier time points. This seems reasonable as during exponential growth small differences in growth can lead to substantial difference in lipid content, whereas arrival in stationary phase rather stabilises and compensates for potential differences.
–
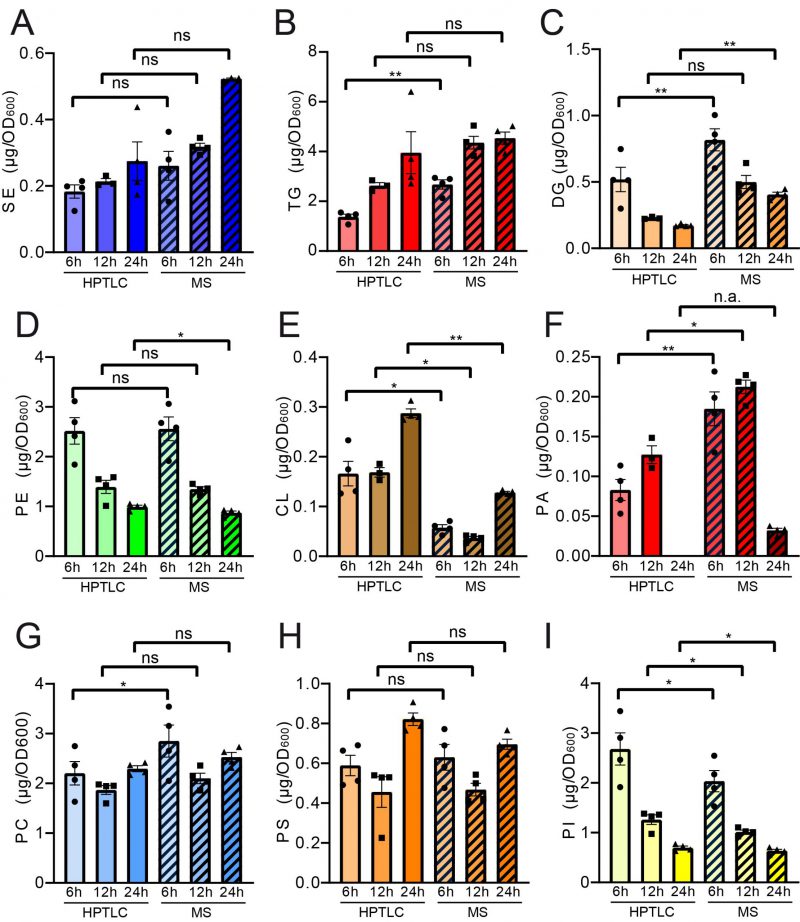
FIGURE 4: Paired statistical analysis of individual lipid classes (absolute) for HPTLC-lipidomics vs. MS-assisted shotgun lipidomics reveals similarities and differences between both methods. Neutral lipids are compared in panels (A-C) and phospholipid comparisons are given in panels (D-I). Statistical analysis was performed using paired tests: TG, DG, SE, CL, PA, PC, PS and PI were analysed using mixed effects analysis with Sidaks's multiple comparisons test; PE was analysed using RM ANOVA with Holm-Sidak's multiple comparisons test. Relative representation in mol % is depicted in Figure S3.
–
In summary, our analysis suggests acceptable overall comparability between both methods for lipid analysis. However, with very stringent statistical testing of data pairs statistical difference can be detected for some lipid classes at critical time points.
–
5. & 6. Validation of HPTLC-based lipidomic method by quantification of example yeast strains with described lipidomic changes
The next step to fully validate the HPTLC-based lipidomics method was to measure and quantify total lipids of a set of yeast strains which have already been described to have significantly altered lipid profiles. We chose the dga1Δ lro1Δ are1Δ are2Δ (QKO) and the pah1Δ strain. The QKO has been used in several studies and completely lacks LDs, since neutral fat synthesis is completely abrogated when all four genes encoding acyltransferases are deleted [26][36][62]. PAH1 on the other hand encodes the phosphatidate phosphatase called lipin [63]. The pah1Δ strain thus shows numerous changes in the lipid profile which we use as a reference to validate our data.
–
Analysis of the QKO lipidome with the HPTLC method revealed the expected results, which are in line with previous descriptions of the knock out mutant (Fig. 5 and 6). We could confirm complete lack of the neutral lipids TG (Fig. 6A) and SE (Fig. 6B). For DG an increase was only observed as a non-significant trend (Fig. 6C), whereas free Erg was significantly increased (Fig. 6D). Since FA levels of the wildtype are at the detection limit (Fig. 2A, 5A, note 4), we only quantified FA for the QKO and pah1Δ mutants (Fig. 5D, 6E). Similarly, DG-levels of pah1Δ were beyond detection limit and excluded from statistical analysis (Fig. 5D, 6C). Regarding the phospholipids in the QKO we detected a slight but significant reduction of PE (Fig. 6F) and PC (Fig. 6I) whereas the decrease in PS was very strong and significant (Fig. 6J). PA was below detection level in the QKO (Fig. 6H), and a non-significant trend was observed for CL reduction (Fig. 6G).
–
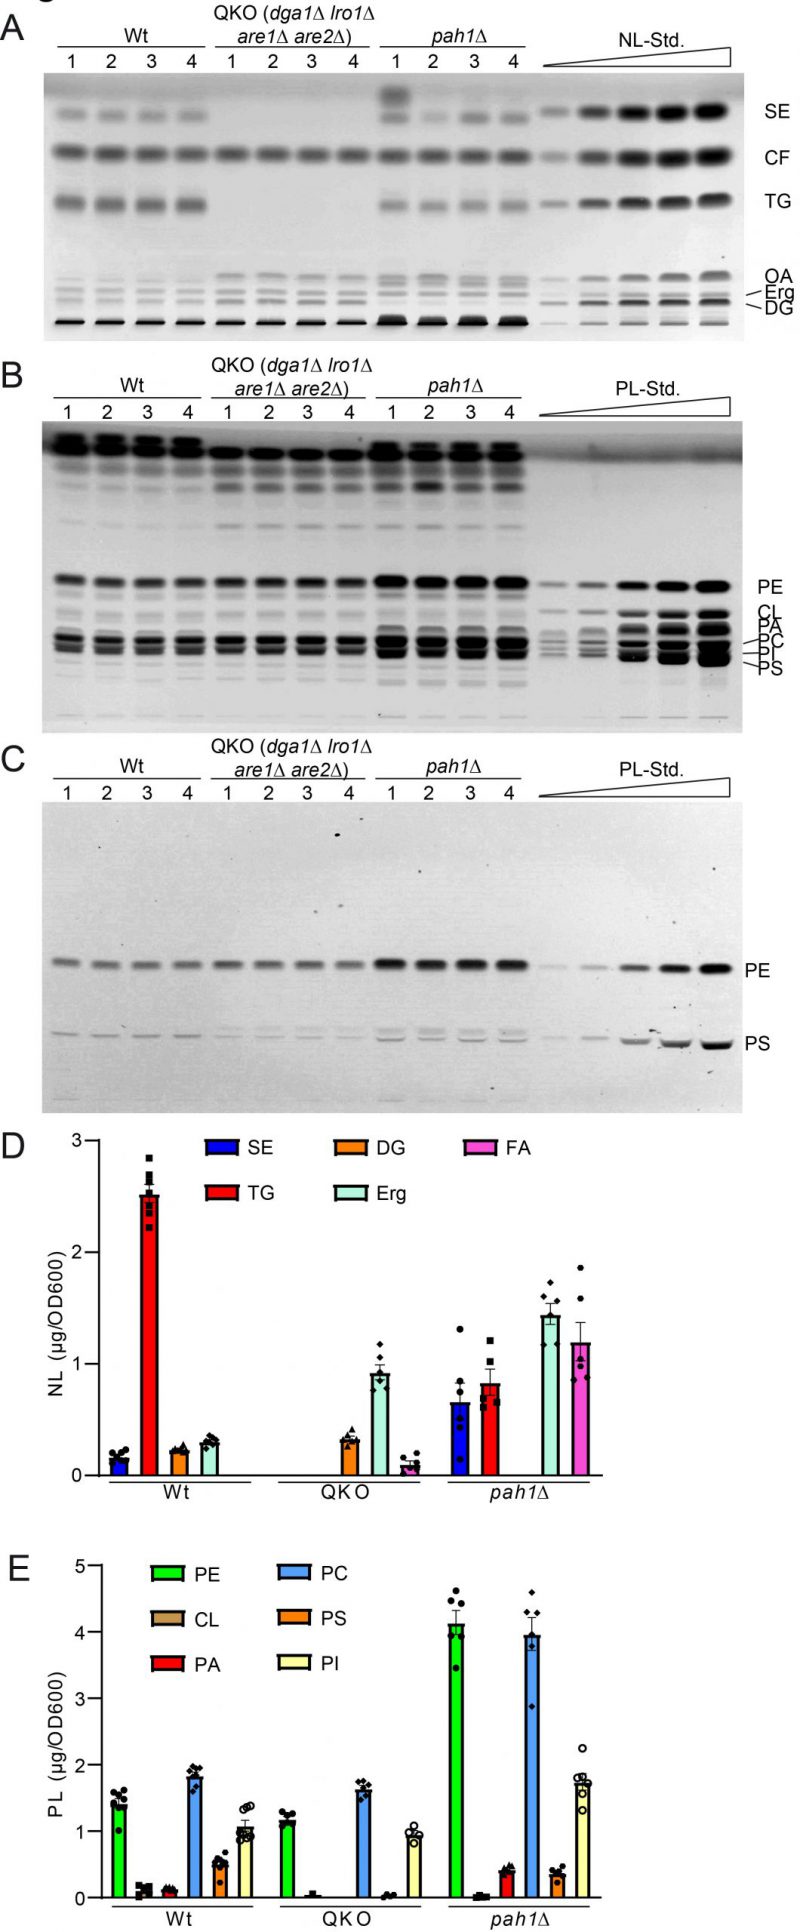
FIGURE 5: Further validation of HPTLC-based lipidomic method by quantification of yeast strains with known lipidomic changes. (A) HPTLC plate showing neutral lipid separation of wildtype (wt), dga1Δ lro1Δ are1Δ are2Δ (QKO), and pah1Δ each in quadruple. (B, C) HPTLC plate showing phospholipid separation, derivatised using Primulin (B) visualising all lipids and ninhydrin (C), which visualizes PS and PE only. (D, E) Lipidomic quantification of neutral lipids (D) and phospholipid classes (E).
–
The pah1Δ strain has been reported to have reduced levels of DG, TG, and PS whereas PA, PI and SE should be increased [63]. We could confirm all of these changes by our HPTLC-measurements (Fig. 5 and 6). Additionally, we observed significant increase of Erg, PE and PC (Fig. 6), which showed varying quantities depending on the time of analysis (exponential vs. stationary phase) in the formerly published analyses [63].
–
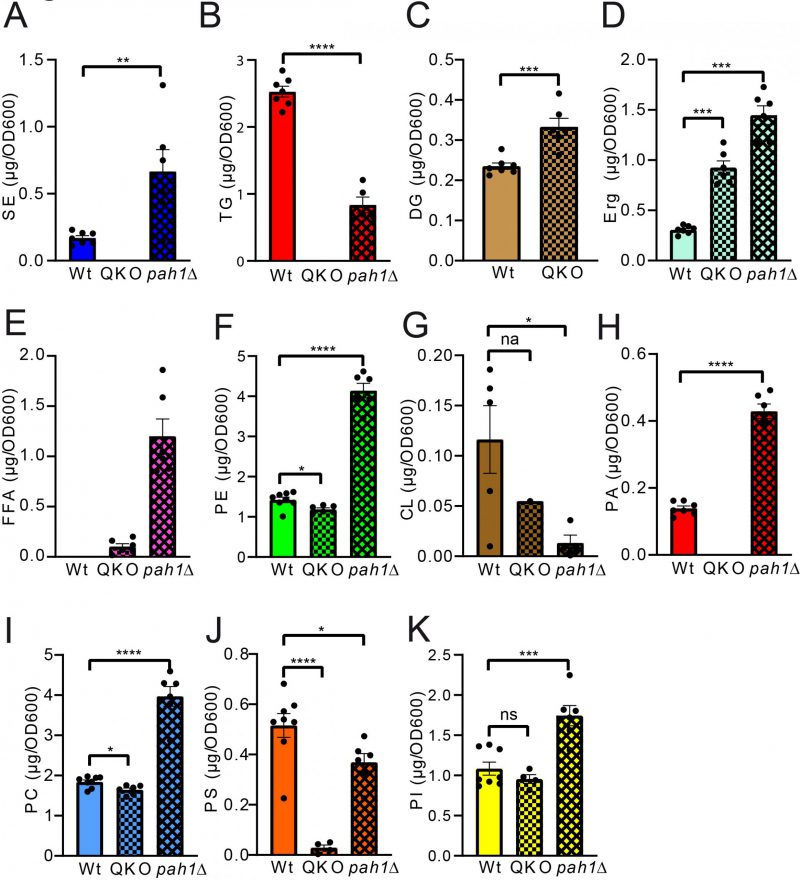
FIGURE 6: Statistical analysis of individual lipid classes comparing QKO and pah1Δ to wildtype. Neutral lipids are compared in panels (A-E) and phospholipid comparisons are given in panels (F-K). SE, TG, DG, CL, and PA were analysed using unpaired T-test; PS and PI using ordinary one-way-ANOVA; TG, SE, PC, PS, and PI using Kruskal-Wallis test and PC, Erg and PE using Brown-Forsythe and Welch ANOVA.
–
In summary we observed that all major changes in the lipid profile of QKO and pah1Δ in S. cerevisiae can be detected using HPTLC according to our here-described protocols. This suggests that the method is adequate for scientific lipid analysis in yeast especially when sample quantity is not a limiting factor.
MATERIAL AND METHODSLaboratory Equipment
Pyrex glass tubes (30x100mm & 18x100mm)
–
Acid-washed glass beads (0.4 – 0.6 mm, VWR, LENZ05124005)
–
HPTLC plates (Sigma/Merck 1.05641.0001)
–
Automatic equipment (for optimised results and reproducibility)
Heidolph Multi Reax shaker
–
Automatic TLC sample applicator (ATS 4, CAMAG, 022.7400)
–
Automatic developing chamber (ADC 2, CAMAG, 022.8380)
–
Derivatizer (CAMAG, 022.6000)
–
Filter paper for chamber saturation (CAMAG, 022.8371)
–
TLC plate heater (CAMAG, 022.3306)
–
CAMAG TLC Visualizer 2 (022.9810)
–
CAMAG TLC software visionCATS basic (028.0000)
–
CAMAG visionCATS Visualizer Enhanced Evaluation Package (028.2020)
–
Manual equipment (low-cost alternative)
Filter paper (Whatman)
–
Twin trough glass thin-layer chromatography (TLC) developing chambers (CAMAG)
–
Reagents
Acetic acid (Roth 3738.4), ROTIPURAN® 100 %, p.a.
–
Acetone (Roth 9372.2), ROTIPURAN® ≥99,8 %, p.a., ACS, ISO
–
Chloroform (Roth 4432.1), ROTISOLV® ≥99,8 %, UV/IR Grade, stabilised
–
Diethylether (Roth 3942.6), ROTIPURAN® ≥99,5 %, p.a., stabilised
–
Ethanol (Roth P075.4), 96 %, Ph. Eur., extra pure
–
Isopropanol (Sigma Aldrich 33539M), puriss. p.a., ACS reagent, reag. ISO, reag. Ph. Eur., ≥99.8% (GC)
–
Methanol (Roth 4627.2), ROTIPURAN® ≥99,9 %, p.a., ACS, ISO
–
n-hexane (Roth 7573.1), ROTISOLV® Pestilyse® plus ≥99 %
–
n-heptane (Roth 7566.1), ROTISOLV® Pestilyse® plus ≥99 %
–
Petroleum ether (Roth T170.1), ROTISOLV® Pestilyse®
–
Phosphatidylcholine 34:1 (Avanti Polar Lipids 850457P)
–
Phosphatidylethanolamine 34:1 (Avanti Polar Lipids 850757P)
–
Phosphatidylserine 34:1 (Avanti Polar Lipids 840034P)
–
L-α-phosphatidylinositol (Avanti Polar Lipids 840042P)
–
Diacylglycerol (16:0-18:1; Avanti Polar Lipids 800815O)
–
L-α-phosphatidic acid from chicken egg, mixture of fatty acids (16:0 (34.2 %), 16:1 (1 %), 18:0 (11.5 %), 18:1 (31.5 %), 18:2 (18.5 %), 20:4 (2.7 %), 22:6 (0.7 %); (Avanti Polar Lipids 840101P)
–
Cholesteryloleate (Avanti Polar Lipids 700269P)
–
Cardiolipin (18 : 1) (Avanti Polar Lipids 710335P)
–
Triolein (Avanti Polar Lipids 870110O)
–
Ergosterol (Acros Organics 117810050, see note 1)
–
Oleic acid (Sigma O1008)
–
Cholesterylformate (Sigma, S448532)
–
Primuline (Sigma 206865)
–
Ninhydrine spray reagent (Sigma N1286)
–
Yeast strains and growth conditions
All experiments were carried out in BY4741 (Mata his3Δ1; leu2Δ0; met15Δ0; ura3Δ0) obtained from Euroscarf. The quadruple knock out mutant (QKO, BY4741), which was generated and described previously [26][62], was genetically manipulated as follows: ycr048wΔ::KanMX4 ynr019wΔ::KanMX4 yor245cΔ::KanMX4 ynr008wΔ::KanMX4. The pah1Δ strain (also in the genetic background of BY4741) was a kind gift from Heimo Wolinski.
–
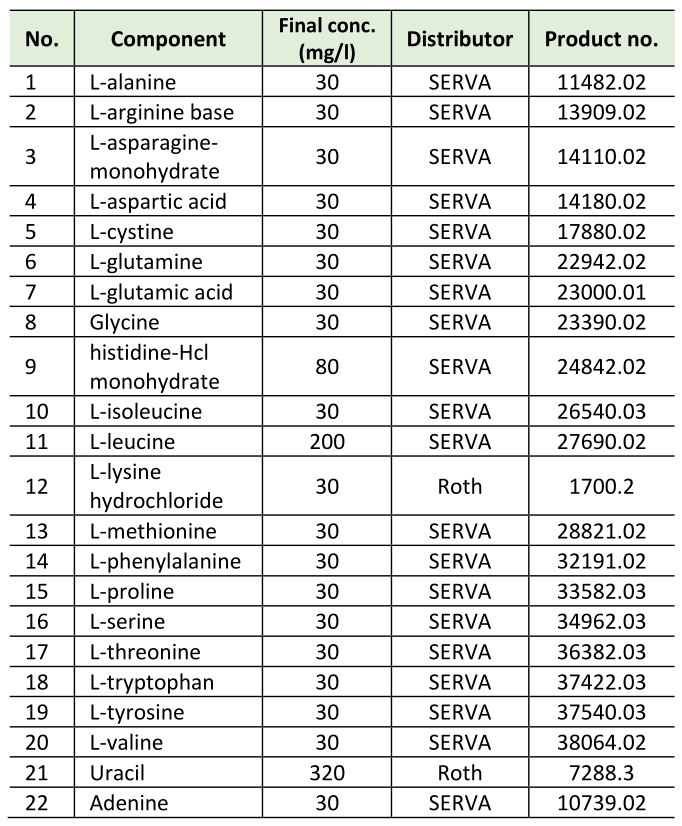
All experiments were carried out in synthetic complete medium with 2 % D-(+)glucose (Roth) with additional myo-inositol (SCD+Ino). SCD+Ino medium contains 0.17% yeast nitrogen base (BD Difco, 233520), 0.5% (NH4)2SO4 (Roth, 9218.1), 2% D-(+)glucose (Roth), 8 mg/L myo-inositol and amino acids, adenine and uracil according to Table 1.
–
Table 1. Amino acids, adenine and uracil.
–
All media were prepared with ultrapure water (MilliQ) and subsequently autoclaved (20 min, 121°C, 110 kPa). Amino acid mixture (including uracil and adenine) and glucose were sterilised separately as 10× stocks and added after autoclaving. Myo-inositol (Sigma, I5125) was added from a sterile filtered 10,000 x stock (80 g/L) after autoclaving. All yeast cultures were inoculated from a stationary overnight culture to an OD600 = 0.1 and then grown at 30°C and 145 rpm shaking for 6, 12 or 24 hours.
–
Total yeast lipid extraction
In total, 80 OD600 units were harvested at indicated time points after inoculation. Total lipids were extracted with chloroform/methanol (CHCl3/MeOH) 2:1 (v/v) according to Folch et al. [64] and essentially as described before [65]. Samples were transferred into thick-walled glass tubes with screw caps (Pyrex 30 x 100 mm) and combined with 1 ml acid washed glass beads, 5 ml CHCl3/MeOH (2:1; v/v) and 125 µg cholesterylformate (CF) (Sigma, S448532) as internal standard. Subsequently cells were lysed by shaking in a Heidolph Multi Reax shaker at an intensity of 8 for 30 minutes. 1 ml of dH2O was added to each sample and samples were shaken for 10 more minutes. Subsequently, samples were centrifuged at 2500 rpm for 5 minutes and the aqueous phase was discarded. 2 ml of artificial upper phase consisting of methanol/H2O/chloroform (48/47/3; v/v/v) was added to the samples and samples were vortex-mixed. The washed samples were again centrifuged at 2500 rpm for 5 minutes to achieve phase separation. The aqueous upper phase was discarded and the organic phase at the bottom was collected using a Pasteur pipette. The entire organic phase was harvested avoiding any contamination of watery phase. The lipid extracts were transferred to fresh pyrex tubes (18 x 100 mm) and the solvent was evaporated completely under a stream of nitrogen. The dried lipid samples were dissolved in 1 ml chloroform/methanol (2:1; v/v), transferred to 1.5 ml glass vials with caps and stored at -20°C.
–
Quantification by high-performance thin-layer chromatography
For neutral lipid and phospholipid separation a total of 20 µL of lipid extracts was applied on HPTLC silica gel 60 plates, 20 x 10 cm (Merck, 1.05641.001) using a CAMAG automatic TLC sampler (ATS4). Lipid separation was performed using a CAMAG automatic developing chamber (ADC2). Neutral lipids were separated with n-hexane, n-heptane, diethylether, acetic acid (63/18.5/18.5/1; v/v/v/v) as mobile phase [58], whereas phospholipid separation was carried out using CHCl3/MeOH/water (32.5:12.5:2; v/v/v) mixture as mobile phase [49][53][54]. HPTLC plates were derivatized with 0.01% primuline (dissolved in 80% acetone) applied in a CAMAG derivatizer followed by mild heating to 40°C for 2 minutes on a CAMAG TLC plate heater 3. Developed HPTLC plates were imaged using a CAMAG TLC visualizer 2 with VisionCATS software. Since peak separation of PI and PS was not ideal in all samples, we conducted an additional derivatisation step with ninhydrin spray reagent (Sigma Aldrich, N1286), which only stains phospholipids containing free amino groups and thus allows quantification of PS without PI. HPTLC bands were processed into chromatograms and quantified by polynomial regression of standard curves calculated from the applied standards. For phospholipids the standard contained l-α-phosphatidylinositol (840044P), phosphatidylcholine (16:0-18:1; 850457P), phosphatidylethanolamine (16:0-18:1; 850757P), phosphatidylserine (18:1-18:1; 840034P), cardiolipin (18:1-18:1; 710335P), phosphatidic acid (16:0 (34.2%), 16:1 (1%), 18:0 (11.5%), 18:1 (31.5%), 18:2 (18.5%), 20:4 (2.7%), 22:6 (0.7%); 840101P) each at 500 ng/µl all purchased individually from Sigma Aldrich. The PL-standard was dissolved in chloroform/methanol (2/1). As a neutral lipid standard, we used a custom-made neutral lipid standard consisting of a mix of cholesteryl-oleate (700269P), cholesterylformate (S448532), triolein (870110O), diacylglycerol (16:0-18:1); 800815O)), oleic acid (O1008) all purchased individually from Sigma Aldrich, and ergosterol from Thermofisher Scientific (117810050) each at 500 ng/µl. The NL-standard was dissolved in heptane/isoproanol (1/1). Both standards were applied at increasing quantities for phospholipids from 0.25 µg to 10 µg; for neutral lipids 0.5-10 µg absolute mass.
–
Lipid quantification by shotgun lipidomics
Shotgun lipidomics were performed by the company Lipotype on a commercial basis following standard protocols [2]. Basic analysis of yeast cells, covering nine of the most important lipid classes was performed, which included PA, PC, PE, PG, PI, PS, DG, TG, and EE. Additionally, CL quantification was selected. The original report is accessible at Mendeley data (doi: 10.17632/gf9z9ky3h5.1).
–
Statistical analysis
Tests for statistical significance were performed using GraphPad Prism 8.4.3. The obtained data from HPTLC and MS analyses were processed as paired data, since they were generated from exactly the same samples. Normal distribution of datasets was assessed using Shapiro-Wilk tests. In case of negative Shapiro-Wilk test a ROUT analysis with Q=10% to identify likely outliers was conducted and cleaned datasets were used for further statistical analysis. Repeated measure (RM) one-way ANOVA with Sidak's multiple comparisons test was conducted if no missing values were present; for datasets containing missing values a mixed effects analysis with Holm-Sidak's multiple comparisons test was performed. All original GraphPad Prism files are accessible at Mendelay data.
–
Pearson correlation analysis of lipid species by HPTLC and MS measurements was conducted using R (version 4.3.2.; Table 2). Data was imported from MS Excel via the readxl package [66], cleaned and transformed using the packages dplyr [67], stringr [68] and tidyr [69] from the tidyverse collection. Correlation calculations were performed with the rstatix package [70]. Packages ggplot2 [71], RColorBrewer [72] and pheatmap [73] were used for plotting.
–
Table 2. R packages used in this study.
–
Notes
1) The analysis of Erg could possibly be improved using an alternative source as ergosterol standard. It seems like there is substantial impurity in the Erg which was used here, which has an impact on the precise estimation of Erg levels.
–
2) Inositol is not sufficient in standard SC medium [74], which is why it was additionally provided as a supplement.
–
3) Erg quantification was not included in the MS-approach by lipotype, which is why a comparison for Erg is not applicable. MS-based quantification of Erg and sterolesters is generally difficult because stable-isotope-labelled compounds are not available.
–
4) The analysis of FA in wildtype which is at detection limit could be overcome by increasing total lipid amounts for application. This can be achieved easily by evaporation of total lipid extracts under a stream of nitrogen and resolubilisation in less solvent.
–
Data availability
The original data are accessible at Mendeley Data: Meyer, Thorsten; Knittelfelder, Oskar; Rockenfeller, Patrick (2023), “Quantifying yeast lipidomics by high-performance thin-layer chromatography (HPTLC) and comparison to mass spectrometry-based shotgun lipidomics.”, Mendeley Data, V1, doi: 10.17632/gf9z9ky3h5.1
AUTHOR CONTRIBUTIONConceptualisation PR; Methodology, TM, OK and PR; Validation, TM, and PR; Formal Analysis, TM, MS and PR; Investigation, TM; Data Curation, MS and PR; Writing-Original Draft Preparation, PR; Writing-Review and Editing, TM, OK, and MS; Figure Visualisation, PR and MS; Supervision, Project Administration, and Funding Acquisition, PR. All authors have read and agreed to the published version of the manuscript.
–
PR is supported by the “NRW Rückkehr Programm” from the Ministry of Culture and Science of the German State of North Rhine-Westphalia”.
REFERENCES Han X, Gross RW (2022). The foundations and development of lipidomics. J Lipid Res 63(2). 10.1016/j.jlr.2021.100164 Ejsing CS, Sampaio JL, Surendranath V, Duchoslav E, Ekroos K, Klemm RW, Simons K, and Shevchenko A (2009). Global analysis of the yeast lipidome by quantitative shotgun mass spectrometry. Proc Natl Acad Sci USA 106(7): 2136–2141. 10.1073/pnas.0811700106 Schuhmann K, Almeida R, Baumert M, Herzog R, Bornstein SR, and Shevchenko A (2012). Shotgun lipidomics on a LTQ Orbitrap mass spectrometer by successive switching between acquisition polarity modes. J Mass Spectrom 47(1): 96–104. 10.1002/jms.2031 Schuhmann K, Thomas H, Ackerman JM, Nagornov KO, Tsybin YO, and Shevchenko A (2017). Intensity-Independent Noise Filtering in FT MS and FT MS/MS Spectra for Shotgun Lipidomics. Anal Chem 89(13): 7046–7052. 10.1021/acs.analchem.7b00794 Schuhmann K, Srzentić K, Nagornov KO, Thomas H, Gutmann T, Coskun Ü, Tsybin YO, and Shevchenko A (2017). Monitoring Membrane Lipidome Turnover by Metabolic 15N Labeling and Shotgun Ultra-High-Resolution Orbitrap Fourier Transform Mass Spectrometry. Anal Chem 89(23): 12857–12865. 10.1021/acs.analchem.7b03437 Sales S, Knittelfelder O, and Shevchenko A (2017). Lipidomics of Human Blood Plasma by High-Resolution Shotgun Mass Spectrometry. Methods Mol Biol 1619: 203–212. 10.1007/978-1-4939-7057-5_16 Hornburg D, Wu S, Moqri M, Zhou X, Contrepois K, Bararpour N, Traber GM, Su B, Metwally AA, Avina M, Zhou W, Ubellacker JM, Mishra T, Schüssler-Fiorenza Rose SM, Kavathas PB, Williams KJ, and Snyder MP (2023). Dynamic lipidome alterations associated with human health, disease and ageing. Nat Metab 5(9): 1578–1594. 10.1038/s42255-023-00880-1 Contrepois K, Mahmoudi S, Ubhi BK, Papsdorf K, Hornburg D, Brunet A, and Snyder M (2018). Cross-Platform Comparison of Untargeted and Targeted Lipidomics Approaches on Aging Mouse Plasma. Sci Rep 8(1): 17747. 10.1038/s41598-018-35807-4 Gonzalez-Covarrubias V (2013). Lipidomics in longevity and healthy aging. Biogerontology 14(6): 663–672. 10.1007/s10522-013-9450-7 Tiwari V, and Shukla S (2023). Lipidomics and proteomics: An integrative approach for early diagnosis of dementia and Alzheimer's disease. Front Genet 14: 1057068. 10.3389/fgene.2023.1057068 Joshi A, Rienks M, Theofilatos K, and Mayr M (2021). Systems biology in cardiovascular disease: a multiomics approach. Nat Rev Cardiol 18(5): 313–330. 10.1038/s41569-020-00477-1 Yoon H, Shaw JL, Haigis MC, and Greka A (2021). Lipid metabolism in sickness and in health: emerging regulators of lipotoxicity. Mol Cell 81(18): 3708–3730. 10.1016/j.molcel.2021.08.027 Yofe I, Weill U, Meurer M, Chuartzman S, Zalckvar E, Goldman O, Ben-Dor S, Schütze C, Wiedemann N, Knop M, Khmelinskii A, and Schuldiner M (2016). One library to make them all: Streamlining yeast library creation by a SWAp-Tag (SWAT) strategy. Nat Methods 13(4): 371–378. 10.1038/nmeth.3795 Ichimura Y, Kirisako T, Takao T, Satomi Y, Shimonishi Y, Ishihara N, Mizushima N, Tanida I, Kominami E, Ohsumi M, Noda T, and Ohsumi Y (2000). A ubiquitin-like system mediates protein lipidation. Nature 408(6811): 488–492. 10.1038/35044114 Fujioka Y, Alam JM, Noshiro D, Mouri K, Ando T, Okada Y, May AI, Knorr RL, Suzuki K, Ohsumi Y, and Noda NN (2020). Phase separation organizes the site of autophagosome formation. Nature 578(7794): 301-305. 10.1038/s41586-020-1977-6 Matoba K, Kotani T, Tsutsumi A, Tsuji T, Mori T, Noshiro D, Sugita Y, Nomura N, Iwata S, Ohsumi Y, Fujimoto T, Nakatogawa H, Kikkawa M, and Noda NN (2020). Atg9 is a lipid scramblase that mediates autophagosomal membrane expansion. Nat Struct Mol Biol 27(12): 1185-1193. 10.1038/s41594-020-00518-w Nakatogawa H, Suzuki K, Kamada Y, and Ohsumi Y (2009). Dynamics and diversity in autophagy mechanisms: lessons from yeast. Nat Rev Mol Cell Biol 10(7): 458–467. 10.1038/nrm2708 Sawa-Makarska J, Baumann V, Coudevylle N, von Bülow S, Nogellova V, Abert C, Schuschnig M, Graef M, Hummer G, and Martens S (2020). Reconstitution of autophagosome nucleation defines Atg9 vesicles as seeds for membrane formation. Science 369(6508): eaaz7714. 10.1126/science.aaz7714 Yin Z, Pascual C, and Klionsky DJ (2016). Autophagy: machinery and regulation. Microbial Cell 3(12): 588–596. 10.15698/mic2016.12.546. Fabrizio P, Pozza F, Pletcher SD, Gendron CM, and Longo VD (2001). Regulation of longevity and stress resistance by Sch9 in yeast. Science 292(5515): 288–290. 10.1126/science.1059497 Eisenberg T, Knauer H, Schauer A, Büttner S, Ruckenstuhl C, Carmona-Gutierrez D, Ring J, Schroeder S, Magnes C, Antonacci L, Fussi H, Deszcz L, Hartl R, Schraml E, Criollo A, Megalou E, Weiskopf D, Laun P, Heeren G, Breitenbach M, Grubeck-Loebenstein B, Herker E, Fahrenkrog B, Fröhlich K-U, Sinner F, Tavernarakis N, Minois N, Kroemer G, and Madeo F (2009). Induction of autophagy by spermidine promotes longevity. Nat Cell Biol 11(11): 1305–1314. 10.1038/ncb1975 Rockenfeller P, Koska M, Pietrocola F, Minois N, Knittelfelder O, Sica V, Franz J, Carmona-Gutierrez D, Kroemer G, and Madeo F (2015). Phosphatidylethanolamine positively regulates autophagy and longevity. Cell Death Differ 22(3): 499–508. 10.1038/cdd.2014.219 Howitz KT, Bitterman KJ, Cohen HY, Lamming DW, Lavu S, Wood JG, Zipkin RE, Chung P, Kisielewski A, Zhang L-L, Scherer B, and Sinclair DA (2003). Small molecule activators of sirtuins extend Saccharomyces cerevisiae lifespan. Nature 425(6954): 191–196. 10.1038/nature01960 Lin SJ, Defossez PA, and Guarente L (2000). Requirement of NAD and SIR2 for life-span extension by calorie restriction in Saccharomyces cerevisiae. Science 289(5487): 2126–2128. 10.1126/science.289.5487.2126 Zimmermann A, Hofer S, Pendl T, Kainz K, Madeo F, and Carmona-Gutierrez D (2018). Yeast as a tool to identify anti-aging compounds. FEMS Yeast Res 18(6): foy020. 10.1093/femsyr/foy020 Rockenfeller P, Ring J, Muschett V, Beranek A, Büttner S, Carmona-Gutierrez D, Eisenberg T, Khoury C, Rechberger G, Kohlwein SD, Kroemer G, and Madeo F (2010). Fatty acids trigger mitochondrion-dependent necrosis. Cell Cycle 9(14): 2908–2914. 10.4161/cc.9.14.12346 Madeo F, Fröhlich E, and Fröhlich K-U (1997). A Yeast Mutant Showing Diagnostic Markers of Early and Late Apoptosis. J Cell Biol 139(3): 729–734. 10.1083/jcb.139.3.729 Madeo F, Herker E, Maldener C, Wissing S, Lächelt S, Herlan M, Fehr M, Lauber K, Sigrist SJ, Wesselborg S, and Fröhlich K-U (2002). A Caspase-Related Protease Regulates Apoptosis in Yeast. Mol Cell 9(4): 911–917. 10.1016/S1097-2765(02)00501-4 Rockenfeller P, and Madeo F (2008). Apoptotic death of ageing yeast. Exp Gerontol 43(10): 876–881. 10.1016/j.exger.2008.08.044 Büttner S, Eisenberg T, Carmona-Gutierrez D, Ruli D, Knauer H, Ruckenstuhl C, Sigrist C, Wissing S, Kollroser M, Fröhlich K-U, Sigrist S, and Madeo F (2007). Endonuclease G Regulates Budding Yeast Life and Death. Mol Cell 25(2): 233–246. 10.1016/j.molcel.2006.12.021 Klug L, and Daum G (2014). Yeast lipid metabolism at a glance. FEMS Yeast Res 14(3): 369–388. 10.1111/1567-1364.12141 Henry SA, Kohlwein SD, and Carman GM (2012). Metabolism and Regulation of Glycerolipids in the Yeast Saccharomyces cerevisiae. Genetics 190(2): 317–349. 10.1534/genetics.111.130286 Choudhary V, and Schneiter R Lipid droplet biogenesis from specialized ER subdomains. Microbial Cell 7(8): 218–221. 10.15698/mic2020.08.727 Schuldiner M, and Bohnert M (2017). A different kind of love – lipid droplet contact sites. Biochim Biophys Acta Mol Cell Biol Lipids 1862(10, Part B): 1188–1196. 10.1016/j.bbalip.2017.06.005. Wolinski H, Kolb D, Hermann S, Koning RI, and Kohlwein SD (2011). A role for seipin in lipid droplet dynamics and inheritance in yeast. J Cell Sci 124(22): 3894–3904. 10.1242/jcs.091454 Sorger D, Athenstaedt K, Hrastnik C, and Daum G (2004). A yeast strain lacking lipid particles bears a defect in ergosterol formation. J Biol Chem 279(30): 31190–31196. 10.1074/jbc.M403251200 Rockenfeller P, Smolnig M, Diessl J, Bashir M, Schmiedhofer V, Knittelfelder O, Ring J, Franz J, Foessl I, Khan MJ, Rost R, Graier WF, Kroemer G, Zimmermann A, Carmona-Gutierrez D, Eisenberg T, Büttner S, Sigrist SJ, Kühnlein RP, Kohlwein SD, Gourlay CW, and Madeo F (2018). Diacylglycerol triggers Rim101 pathway–dependent necrosis in yeast: a model for lipotoxicity. Cell Death Differ 25(4): 765. 10.1038/s41418-017-0014-2 Carmona-Gutierrez D, Reisenbichler A, Heimbucher P, Bauer MA, Braun RJ, Ruckenstuhl C, Büttner S, Eisenberg T, Rockenfeller P, Fröhlich K-U, Kroemer G, and Madeo F (2011). Ceramide triggers metacaspase-independent mitochondrial cell death in yeast. Cell Cycle 10(22): 3973–3978. 10.4161/cc.10.22.18212 Fakas S, Qiu Y, Dixon JL, Han G-S, Ruggles KV, Garbarino J, Sturley SL, and Carman GM (2011). Phosphatidate Phosphatase Activity Plays Key Role in Protection against Fatty Acid-induced Toxicity in Yeast. J Biol Chem 286(33): 29074–29085. 10.1074/jbc.M111.258798 Gourlay CW, Carpp LN, Timpson P, Winder SJ, and Ayscough KR (2004). A role for the actin cytoskeleton in cell death and aging in yeast. J Cell Biol 164(6): 803–809. 10.1083/jcb.200310148 Audhya A, Loewith R, Parsons AB, Gao L, Tabuchi M, Zhou H, Boone C, Hall MN, and Emr SD (2004). Genome-wide lethality screen identifies new PI4,5P2 effectors that regulate the actin cytoskeleton. EMBO J 23(19): 3747–3757. 10.1038/sj.emboj.7600384 Novick P, and Botstein D (1985). Phenotypic analysis of temperature-sensitive yeast actin mutants. Cell 40(2). 10.1016/0092-8674(85)90154-0 Kaksonen M, Toret CP, and Drubin DG (2006). Harnessing actin dynamics for clathrin-mediated endocytosis. Nat Rev Mol Cell Biol7(6): 404–414. 10.1038/nrm1940 Davis J, Meyer T, Smolnig M, Smethurst DGJ, Neuhaus L, Heyden J, Broeskamp F, Edrich ESM, Knittelfelder O, Kolb D, Haar T von der, Gourlay CW, and Rockenfeller P (2023). A dynamic actin cytoskeleton is required to prevent constitutive VDAC-dependent MAPK-signalling and aberrant lipid homeostasis. iScience 26(9): 107539. 10.1016/j.isci.2023.107539 De Camilli P, Emr SD, McPherson PS, and Novick P (1996). Phosphoinositides as Regulators in Membrane Traffic. Science 271(5255): 1533–1539. 10.1126/science.271.5255.1533 Südhof TC, and Rothman JE (2009). Membrane fusion: grappling with SNARE and SM proteins. Science 323(5913): 474–477. 10.1126/science.1161748 Yoshihisa T, Barlowe C, and Schekman R (1993). Requirement for a GTPase-activating protein in vesicle budding from the endoplasmic reticulum. Science 259(5100): 1466–1468. 10.1126/science.8451644 Balderhaar HJ kleine, and Ungermann C (2013). CORVET and HOPS tethering complexes – coordinators of endosome and lysosome fusion. J Cell Sci 126(6): 1307–1316. 10.1242/jcs.107805 Schneiter R, and Daum G (2006). Analysis of yeast lipids. Methods Mol Biol 313: 75–84. 10.1385/1-59259-958-3:075 Peterson BL, and Cummings BS (2006). A review of chromatographic methods for the assessment of phospholipids in biological samples. Biomed Chromatogr 20(3): 227–243. 10.1002/bmc.563 Fuchs B, Süβ R, Teuber K, Eibisch M, and Schiller J (2011). Lipid analysis by thin-layer chromatography—A review of the current state. J Chromatogr A 1218(19): 2754–2774. 10.1016/j.chroma.2010.11.066 Esther CT Forgács (1996). Introduction to Techniques and Instrumentation. In: Practical Thin-Layer Chromatography. CRC Press. Knittelfelder OL, and Kohlwein SD (2017). Thin-Layer Chromatography to Separate Phospholipids and Neutral Lipids from Yeast. Cold Spring Harb Protoc 2017(5). 10.1101/pdb.prot085456 Mangold HK (1961). Thin-layer chromatography of lipids. J Am Oil Chem Soc 38(12): 708–727. 10.1007/BF02633061 Jain R, and Sherma J (2006). Planar Chromatography in Clinical Chemistry. In: Encyclopedia of Analytical Chemistry. John Wiley & Sons, Ltd. Handloser D, Widmer V, and Reich E (2008). Separation of Phospholipids by HPTLC – An Investigation of Important Parameters. J Liq Chromatogr Relat Technol 31(13): 1857–1870. 10.1080/10826070802188940 Cebolla VL, Jarne C, Vela J, Garriga R, Membrado L, and Galbán J (2021). Scanning densitometry and mass spectrometry for HPTLC analysis of lipids: The last 10 years. J Liq Chromatogr Relat Technol 44(3–4): 148–170. 10.1080/10826076.2020.1866600 Schmitz G, Assmann G, and Bowyer DE (1984). A quantitative densitometric method for the rapid separation and quantitation of the major tissue and lipoprotein lipids by high-performance thin-layer chromatography: I. Sample preparation, chromatography, and densitometry. J Chromatogr 307: 65–79. 10.1016/S0378-4347(00)84073-6 Cebolla VL, Mateos E, Garriga R, Jarne C, Membrado L, Cossío FP, Gálvez EM, Matt M, and Delgado-Camón A (2012). Changes in fluorescent emission due to non-covalent interactions as a general detection procedure for thin-layer chromatography. Chemphyschem 13(1): 291–299. 10.1002/cphc.201100590 Tuller G, Nemec T, Hrastnik C, and Daum G (1999). Lipid composition of subcellular membranes of an FY1679-derived haploid yeast wild-type strain grown on different carbon sources. Yeast 15(14): 1555–1564. 10.1002/(SICI)1097-0061(199910)15:14<1555::AID-YEA479>3.0.CO;2-Z Viljoen BC, Kock JL, and Lategan PM (1986). Long-chain fatty acid composition of selected genera of yeasts belonging to the Endomycetales. Antonie Van Leeuwenhoek 52(1): 45–51. 10.1007/BF00402686 Petschnigg J, Wolinski H, Kolb D, Zellnig G, Kurat CF, Natter K, and Kohlwein SD (2009). Good Fat, Essential Cellular Requirements for Triacylglycerol Synthesis to Maintain Membrane Homeostasis in Yeast. J Biol Chem 284(45): 30981–30993. 10.1074/jbc.M109.024752 Han G-S, Wu W-I, and Carman GM (2006). The Saccharomyces cerevisiae Lipin Homolog is a Mg2+-dependent Phosphatidate Phosphatase Enzyme. J Biol Chem 281(14): 9210. 10.1074/jbc.M600425200 Folch J, Lees M, and Stanley GHS (1957). A Simple Method for the Isolation and Purification of Total Lipides from Animal Tissues. J Biol Chem 226(1): 497–509. 10.1016/s0021-9258(18)64849-5 Knittelfelder OL, and Kohlwein SD (2017). Lipid Extraction from Yeast Cells. Cold Spring Harb Protoc 2017(5): pdb.prot085449. 10.1101/pdb.prot085449 Wickham H, and Bryan J (2023). readxl: Read Excel Files. R package version 1.4.3, https://readxl.tidyverse.org, https://github.com/tidyverse/readxl Wickham H, François R, Henry L, Müller K, and Vaughan D (2023). dplyr: A Grammar of Data Manipulation. R package version 1.1.4, https://github.com/tidyverse/dplyr, https://dplyr.tidyverse.org Wickham H (2023). stringr: Simple, Consistent Wrappers for Common String Operations. R package version 1.5.1, https://github.com/tidyverse/stringr, https://stringr.tidyverse.org Wickham H, Vaughan D, and Girlich M (2023). tidyr: Tidy Messy Data. R package version 1.3.1, https://github.com/tidyverse/tidyr, https://tidyr.tidyverse.org Kassambara A (2023). rstatix: Pipe-Friendly Framework for Basic Statistical Tests. R package version 0.7.2, https://rpkgs.datanovia.com/rstatix/ Wickham H (2016). ggplot2: Elegant Graphics for Data Analysis.
留言 (0)