
記住我

According to forecasts from trading economics and data from recent census figures, the total population of Ethiopia was 115.0 million by 2020 [23]. The EDHS 2019 final report includes inclusive data at the country level from the nine regional states and two municipal administrations. The administrative levels were divided into zones, woreda, and so forth. Spatial and multilevel analysis were conducted on children less than 24 months. Women between the ages of 15 and 49 and children in selected households across the country were the target groups. The EDHS collects pertinent information mainly regarding maternity health care utilization, marriage and sexual behavior, child feeding practice, children and women’s dietary condition, and children’s and adult mortality. Data collection was carried out from March to June 2019 [24].
Data extraction and populationFirst, the project proposal was sent to the Demographic and Health Surveys (DHS) Program. After a detailed review process, the DHS program accepted the proposal and granted access with an approval letter to use the survey datasets. Data extraction was done to select mothers of children aged less than twenty-four months. The data extraction was conducted between August 1 and 30, 2023. All Ethiopian mother of children aged less than twenty-four months were the source population, whereas all Ethiopian mother of children aged less than twenty-four months in the selected enumeration area were the study population.
Data quality control and data collectionTo ensure the integrity and reliability of data gathered for this research, the DHS quality control team employed robust data quality control mechanisms. During data collection, data collection instruments and procedures were meticulously reviewed to minimize errors and inconsistencies. As per the EDHS 2019 report, Interviewers were trained on the DHS questionnaires and data collection procedures. Data collection spanned from March to June 2019. Following the selection of a representative sample of households across nine regions and two administrations, Interviewers visited selected households to conduct interviews with women of reproductive age. The interviews were typically conducted in the respondent’s home. For this study, data profiling techniques were also employed to identify data anomalies, outliers, and missing values. Additionally, recourse methodology was utilized throughout the study.
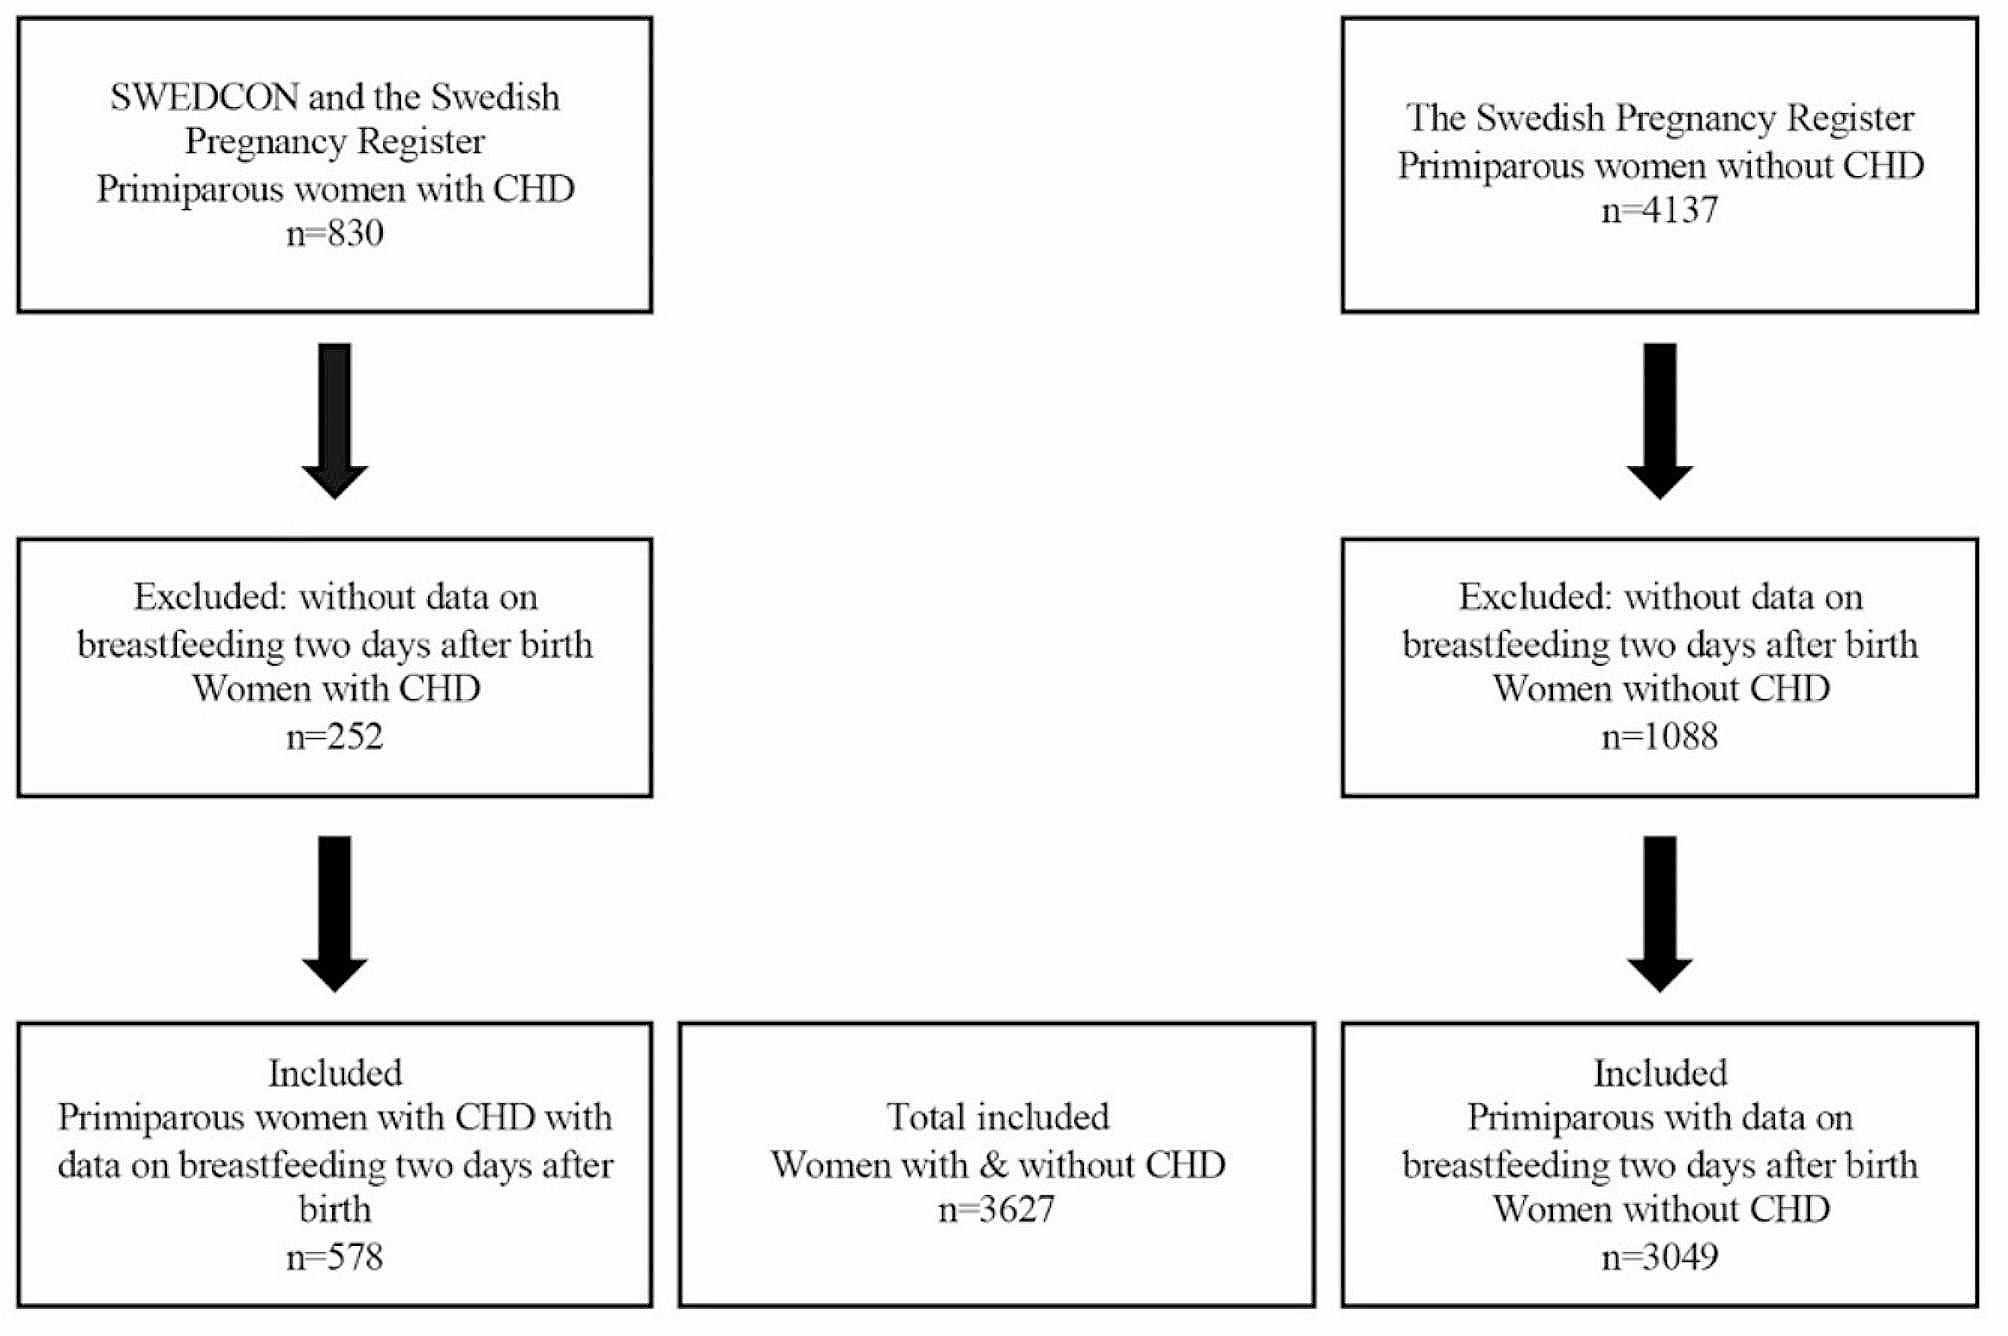
Sampling methodsThe EDHS 2019 sample was stratified and selected in two levels. Twenty one sampling strata were produced after stratifying each region into urban and rural areas. Using probability proportion, 305 enumeration areas (93 from urban and 212 from rural) were selected in the first stage. Newly formed household listing was used in the second stage to choose a set number of 30 households per cluster with an equal probability of systematic selection. Sample allocation was done to verify that survey precision was equivalent across regions. Thirty five enumeration areas were selected from the three largest regions. Twenty five enumeration areas were selected from eight regions (including two city administrations). The complete sampling procedure is available in the EDHS 2019 final report. In the current study, a total of 1982 weighted mothers of children under twenty-four months participated. The spotlight sampling technique for the present study is shown in the Fig. 1.
Fig. 1
Schematic representation of the sampling procedures in the study of spatial variation and determinants of delayed breastfeeding initiation in Ethiopia, EDHS, 2019 N.B EAs = Enumeration Areas
Study variablesThe dependent variable is delayed breastfeeding initiation. This study considered different independent variables to identify determinants of delayed breastfeeding initiation. (Table 1). The community poverty level is constructed using individual-level factors at the cluster (community) level, thereby classified as lower or higher by using median value as a cut-off point if the distribution is not normal. Furthermore, the distribution was checked by using a histogram.
Table 1 List of independent variables for the assessment of Spatial variation and determinants of delayed breastfeeding initiation in EthiopiaDefinitionsDelayed initiation of breastfeeding is defined as failure to initiate breastfeeding within one hour after birth as WHO recommendation [25]. The outcome variable is dichotomized as “1” for delayed initiation and “0” for timely initiation.
Data processing and analysisData was extracted from the EDHS 2019 individual record folder using STATA version 17. The data was sorted and listed to identify any missing values. Frequency and percentage were computed for descriptive statistics. Date weighting, cleaning, editing, and recording were carried out. ArcGIS Pro and Sat Scan version 9.6 were used for mapping the visual presentation of delayed breastfeeding initiation at the regional and district levels. STATA version 17 was used for descriptive and non-spatial analysis.
Spatial autocorrelation analysisSpatial autocorrelation with Global Moran’s I was computed to determine whether delayed breastfeeding imitation is randomly distributed, clustered, or dispersed. Global Moran’s I value near “0” indicates delayed breastfeeding is randomly distributed, near “–1” shows dispersed, and close to “+1” indicates clustered. Spatial autocorrelation is declared at a statistically significant Moran’s I P - value less than 0.05.
Hot spot analysisHot Spot Analysis was done using Getis-Ord Gi* Spatial Statistics to identify statistically significant spatial clusters of minimum value (cold spots) and maximum value (hot spots). P - values and Z-score were used to measure statistical significance, thereby deciding whether or not to reject the null hypothesis. The null hypothesis could not be rejected if the Z-score value is between − 1.96 and + 1.96 at a P - value greater than 0.05. The null hypothesis was rejected if the Z-score is not within the range at a P - value of significance. The possible cause of a statistically significant spatial pattern was explored further. In addition, a high Gi* statistical result shows a “hotspot,” and a low Gi* revealed a “cold spot.”
Spatial interpolationSpatial interpolation was employed to estimate the value of unsampled areas from sampled data points. Empirical Bayesian Kriging (EBK) was used to account for the error made by estimating the semi variogram model.
Multilevel logistic regression analysisMultilevel mixed-effect logistic regression analysis was computed to identify significant determinants of delayed breastfeeding initiation. Multilevel modelling is a statistical model used to analyze data drawn from different levels.
Model one (null model): \( \mathbf\left(\varvec\varvec\varvec\right)=\varvec\mathbf\mathbf+\varvec\mathbf\varvec: \)where: πij is the probability of the outcome (delayed breastfeeding initiation) for individual i in community j, β00 is the overall intercept and u0j is the random effect for community j.
Model two (Individual-Level Factor): \( \text\text\text\text\text\left(\pi ij\right)=\beta 0+\beta 1\times ij+uj\): where: xij is the value of the individual-level factor for individual i in community j and β1 is the coefficient for the individual-level factor.
Model three (Community-Level Factor): \( \mathbf\mathbf\mathbf\mathbf\mathbf\left(\varvec\varvec\varvec\right)=\varvec00+\varvec2\varvec\mathbf\varvec+\varvec\mathbf\varvec\): where: z0j is the value of the community-level factor for community j and β2 is the coefficient for the community-level factor.
Model four (Both Individual- and Community-Level Factors): \( \mathbf\mathbf\mathbf\mathbf\mathbf\left(\varvec\varvec\varvec\right)=\varvec\mathbf\mathbf+\varvec1\times \varvec\varvec+\varvec2\varvec\mathbf\varvec+\varvec0\varvec\): where: xij is the value of the individual-level factor for individual i in community j, β1 is the coefficient for the individual-level factor, z0j is the value of the community-level factor for community j and β2 is the coefficient for the community-level factor [26].
A multilevel model was fitted because of the hierarchical nature of the EDHS data. Four models were considered. Model 1 considers only the dependent variable to explore the degree of cluster variation on delayed breastfeeding initiation. Model 2 and Model 3 contain individual-level factors and community-level factors, respectively. Model 4 is adjusted for both individual and community levels concurrently. Adjusted odds ratio (AOR) and respective 95% confidence interval were computed to identify significant determinants of delayed breastfeeding initiation. Variance inflation factor and tolerance value were used to check the exitances of multicollinearity between variables. A VIF above 4 or tolerance below 0.25 indicated multicollinearity might exist [27]. To estimate the variation between clusters, proportional change variance (PCV), intra-class correlation (ICC), and median odd ratio (MOR) were computed.
ICC shows the degree of heterogeneity of delayed breastfeeding initiation between clusters and calculated as:
$$ ICC=\frac^}^+_^\right)},$$
where σ2 represent community level variance, \( _^\) indicates individual level variance [28].
MOR is the median variations of odds ratio between high-risk areas of delayed breastfeeding initiation and low risk during randomly picking out of clusters. It is calculated as:
$$ \text\text\text=^_\right)0.6745}\right]}=^_}\right]},$$
where VA represents the area level variance.
PCV measures the total variation in delayed breastfeeding initiation attributable to factors in successive models. It is computed as: \( PCV=\frac-VA}}*100\text\), where Vnull is variance in null model and VA is variance in successive model.
留言 (0)