
記住我
Iron availability is known to determine the growth of phytoplankton in aquatic environments [1], [2]. Iron is of high importance for cyanobacterial growth due to the existence of iron-containing proteins in the photosynthetic apparatus and in enzymes of the nitrogen fixation machinery [3]. As a consequence, the intracellular concentration of iron in cyanobacteria is one order of magnitude higher than in Escherichia coli [4]. The high iron demand stands in contrast to the availability of iron in aquatic environments.
–
Several dissolved iron species exist in marine systems, which are all only present in the nanomolar to subnanomolar range [5]. Moreover, about 99% of the iron is bound to various organic ligands [6][7][8][9]. Considering the low availability of iron, aquatic organisms resorted to different mechanisms to use the various iron species to be able to adapt to the constantly changing conditions and iron availabilities in the ecosystem. One example for the sequestering of iron are siderophores, which are low molecular weight organic compounds that are able to chelate iron with high affinities [10]. They are known to be secreted by species of all domains and kingdoms of life [11]. Siderophore synthesis and secretion is in general linked to iron availability and increases with iron limitation [12].
–
The acquisition of substrates that exceed the diffusion size limit for porins or that exist in low quantities in the environment like iron-siderophore complexes is dependent on active TonB-dependent transport systems [13], [14]. TonB-dependent transporters (TBDT) are embedded in the outer membrane. They consist of a 22-stranded β-barrel protein with an N-terminal globular plug domain and a TonB box [15]. Additionally, the Ton system is embedded in the plasma membrane and consists of the proteins ExbB, ExbD and TonB, which interacts C-terminally with the TonB box of the TBDT [16]. The transport of the siderophore relies on the electrochemical potential across the plasma membrane and the energy is transmitted to the TBDT through the TonB protein [14]. Upon substrate binding by the TBDT, which is thought to be energy independent, conformational changes are induced to allow transport across the outer membrane.
–
Another way of iron acquisition that follows similar uptake principles as the ones of siderophores is uptake of heme. Besides its importance as iron source, heme acquisition was found to be crucial for the survival and virulence of bacterial pathogens [17]. Heme belongs to the porphyrins that are characterized by a tetrapyrrole ring, which permits the complexation to different metal cations [18], [19]. Heme is involved in important biochemical functions such as photosynthesis, respiration and nitrogen fixation [4]. Apart from being a substrate for the binding of iron, porphyrins are important in oxygen transport, storage and reduction as well as electron transfer and hydrogen peroxide utilization [20]. In cyanobacteria heme is also an essential intermediate, e.g., for the synthesis of phycobilins [21]. However, heme concentrations within the cell have to be regulated as heme catalyzes the formation of reactive oxygen species resulting in cellular damage and oxidative stress [22], [23].
–
The biosynthesis of heme depends strongly on iron availability [24][25][26][27]. The synthesis of heme and chlorophyll a up to protoporphyrin IX follow the same pathway. Subsequently, heme is synthesized from protoporphyrin IX by Fe2+ insertion whereas Mg2+ insertion is the first step to the chlorophyll a pathway. Besides synthesis, some bacteria can utilize external sources of heme. The principals of the uptake of external heme by different Gram-negative bacterial pathogens can take up free heme or heme-containing proteins like hemoglobin (Hb) or hemopexin [17]. Moreover, pathogens such as Pseudomonas aeruginosa contain heme-uptake systems [28]. The system involves one outer membrane heme receptor (PhuR) of the TBDT family, a periplasmic heme-transport protein (PhuT) and inner membrane proteins (PhuUVW, [28]).
–
The model organism Anabaena sp. PCC 7120 (hereafter Anabaena) is a heterocyst-forming filamentous cyanobacterium. A filament comprises individual cells surrounded by plasma membrane and a peptidoglycan layer. The outer membrane is, however, continuous along the whole filament, which might consist of hundreds of cells [29]. In the genome of Anabaena 22 putative TBDTs were found by bioinformatic analysis [30], [31]. Four of these TBDTs are already experimentally characterized, namely the iron and copper transporter IacT [32] and three proteins that are part of the schizokinen uptake system [4]. The latter are homologs of the hydroxyl-carboxylate siderophore transporter IutA [33] and are annotated as SchT (Alr0397), IutA1 (Alr2209) and IutA2 (Alr2581) in Anabaena [[34][35][36]]. They are required for the uptake of the siderophore secreted by Anabaena [37].
–
The other 18 TBDTs in Anabaena have been assigned by bioinformatics analysis, e.g., as heme transporting TBDTs [30], but their function has not been experimentally confirmed. Two of them were previously assigned as HutA-like [30] based on sequence characteristics, and we extend the annotation to HutA1 encoded by alr2153 and HutA2 encoded by alr3242. The insertional mutants of alr2153 (hutA1) and alr3242 (hutA2) did not show any alteration of uptake of Fe-schizokinen and Fe-aerobactin when compared to wild-type [36]. Interestingly, although heme uptake by cyanobacteria has not been experimentally established, about 30% of all cyanobacteria code for HutA-like proteins in their genome [4]. Consequently, heme uptake by Anabaena and the function of the proteins encoded by alr2153 (hutA1) and alr3242 (hutA2), namely HutA1 and HutA2, respectively, was explored. We demonstrate that Anabaena can use external heme as iron source. Moreover, we present gene expression analysis evidence for a relevance of the two individual proteins under different environmental conditions. The phenotype analysis of mutants generated by plasmid insertion of these genes suggests a function of the two TBDTs in heme uptake.
RESULTSAnabaena utilizes heme as iron source
–
The capacity of Anabaena to utilize heme as an iron source was analyzed by comparison of the growth in medium without iron after supplementation with heme as the only iron source. The growth was compared to the growth in standard YBG11 medium as well as in iron-depleted YBG11 medium. The culture changed from green to cyan color in response to iron starvation, because of the decrease of chlorophyll a (Figure 1A). Moreover, the culture growth was recovered when the iron-depleted YBG11 medium was supplemented with 0.5 and 10 µM heme (Figure 1). Further, the growth in the absence of iron was reduced and after seven days the culture density was 30% of that in the presence of normal iron sources (Figure 1B). The growth in the absence of iron was restored when 10 µM of heme was added to the medium (Figure 1B). Consistent with a recovery from starvation, the chlorophyll a content, used as marker for iron starvation [35], decreased 10-fold when Anabaena was grown in iron depleted medium, but not when grown in the iron-free medium supplemented with 10 µM heme (Figure 1C). This result indicates that Anabaena is able to use heme as an iron source, either directly as a metabolite or by release of iron through decomposition of heme.
–
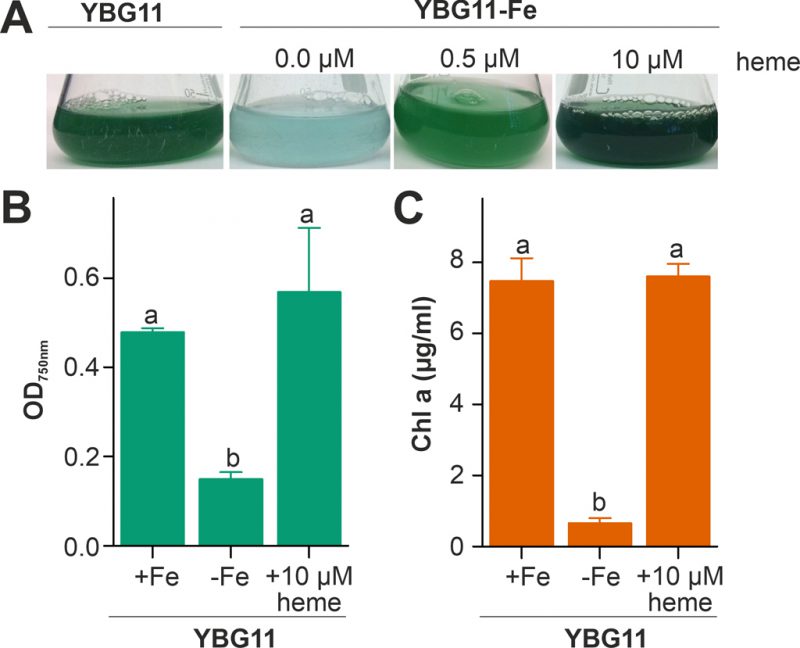
FIGURE 1: Heme utilization by Anabaena. (A) Anabaena was grown in YBG11 (left), YBG11 without iron (second), YBG11 without iron but with 0.5 µM heme (third) or 10 µM heme (right). 50 ml cultures were inoculated to OD750 nm = 0.02 and previously grown in YBG11 medium. Images were taken seven days after inoculation and representatives of multiple replicas are shown. (B, C) The optical density (B) or the chlorophyll a content (C) of Anabaena grown as in (A) was measured and is represented as average of n≥4 experiments with indicated standard deviation. In (B) and (C) the statistical analysis was performed using ANOVA with ranks indicated with p<0.05.
–
Heme and chlorophyll a synthesis pathways are regulated by iron and heme availability
–
The recovery of the chlorophyll a level after heme addition prompted the analysis of the expression of the chlorophyll a synthesis pathway by RT-PCR (Figure 2A). All genes analyzed were expressed in pre-starved cultures by growth for 21 days in the absence of iron (Figure 2B, lane 2) and most of the genes had a comparable or even reduced mRNA level upon prolongation of starvation for additional seven days (lane 4). After transfer of the pre-starved cultures into YBG11 with iron, all genes were reduced in expression after seven days of growth, except of hemD, which remained stable (lane 3).
–
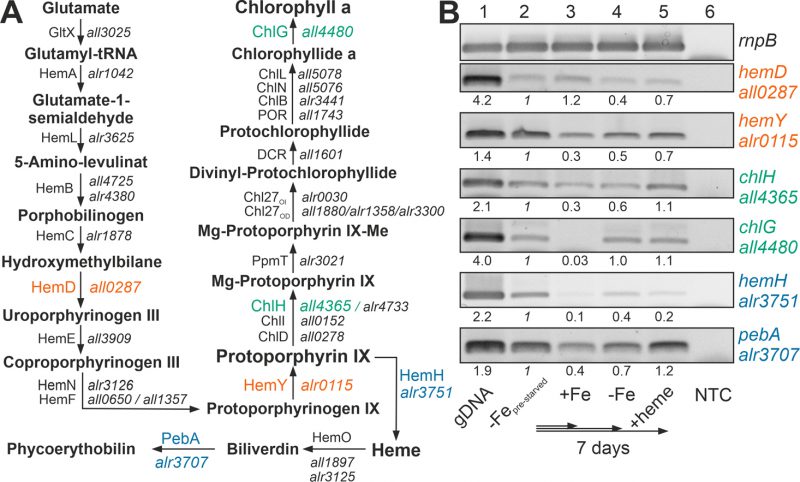
FIGURE 2: Expression of genes involved in chlorophyll a and heme synthesis after iron starvation or heme supply. (A) The synthesis pathway of heme and chlorophyll a, as well as the first steps of the heme degradation pathway, are shown. Intermediate metabolites, proteins involved and the gene coding for these proteins in Anabaena are indicated. Orange color indicates genes of the common pathway analyzed; green, genes analyzed of the chlorophyll a synthesis; blue, genes analyzed of the heme metabolism. HemF: O2-dependent coproporphyrinogen oxidase; HemN: O2-independent coproporphyrinogen dehydrogenase, CHL27OD/CHL27OI: aerobic/anaerobic magnesium-protoporphyrin IX monomethyl ester cyclase. Note: hemN and hemO are transcribed in a transcriptional unit; ChiL, ChiN and ChlB form a complex. (B) RNA was isolated from pre-starved Anabaena (lane 2) transferred for seven days to YBG11 (lane 3), YBG11 without iron (lane 4) or YBG11 without iron but 30 µM heme (lane 5). RT-PCR was performed using oligonucleotides for amplification of the indicated genes. The efficiency of the primer was controlled on isolated gDNA (lane 1), and RNA isolation was probed by RT-PCR without reverse transcriptase (NTC, lane 6). Amplification of rnpB is shown as control. The intensity of the bands shown was quantified with ImageJ, normalized to the expression of the genes in the pre-starved cultures and shown for guidance.
–
The presence of 30 µM heme for seven days did not result in a decline of the expression of the genes involved in chlorophyll a synthesis in comparison to the pre-starved cultures (Figure 2B, lane 5). However, the expression of hemH, which is required for the synthesis of heme from protoporphyrin IX, was largely reduced in the presence of external heme (lane 2 vs. 5), and the level of expression of the gene encoding the enzyme involved in the decomposition of heme (pebA) was 3-fold higher when compared to cultures grown in the presence of iron (lane 3 vs. 5).
–
Thus, comparing pre-starved cultures (Figure 2B, lane 2) and cultures supplemented with iron (lane 3) suggests that iron starvation results in an enhanced expression of the tested genes except of hemD. This is consistent with the observed dependence on FurA of the genes of the heme synthesis pathway [38]. In contrast, prolonged starvation repressed the conversion of protoporphyrin IX to heme by reduction of the mRNA level of hemH (lane 2 vs. 4). The addition of heme resulted in repression of the endogenous heme synthesis by a reduced expression of hemH, which was similar to the level in the presence of iron (lane 3 vs. 5). More importantly, iron starvation as well as addition of heme enhanced the expression of pebA (lane 3 vs. 2 or 5). This suggests that iron-loaded heme will likely be decomposed to release iron for other pathways during iron starvation or by addition of heme.
–
Expression of hutA1 and hutA2 is iron- and heme-supply sensitive
–
Considering that Anabaena can utilize heme (Figure 1), the expression of the two genes, hutA1 (alr2153) and hutA2 (alr3242) was analyzed. The two genes coded for HutA-like TBDTs as previously proposed based on bioinformatics analysis [30]. Fusions of the green fluorescent protein (GFP) to the promoter regions of hutA1 and hutA2 were generated. These fusions contain the start codon of the respective gene and are under the control of the endogenous promoters. The constructs were transferred into Anabaena to generate the strains AFS-I-PhutA1 and AFS-I-PhutA2 (Figure 3A; Table 2). The genome insertion was confirmed, while we did not probe for segregation (data not shown).
–
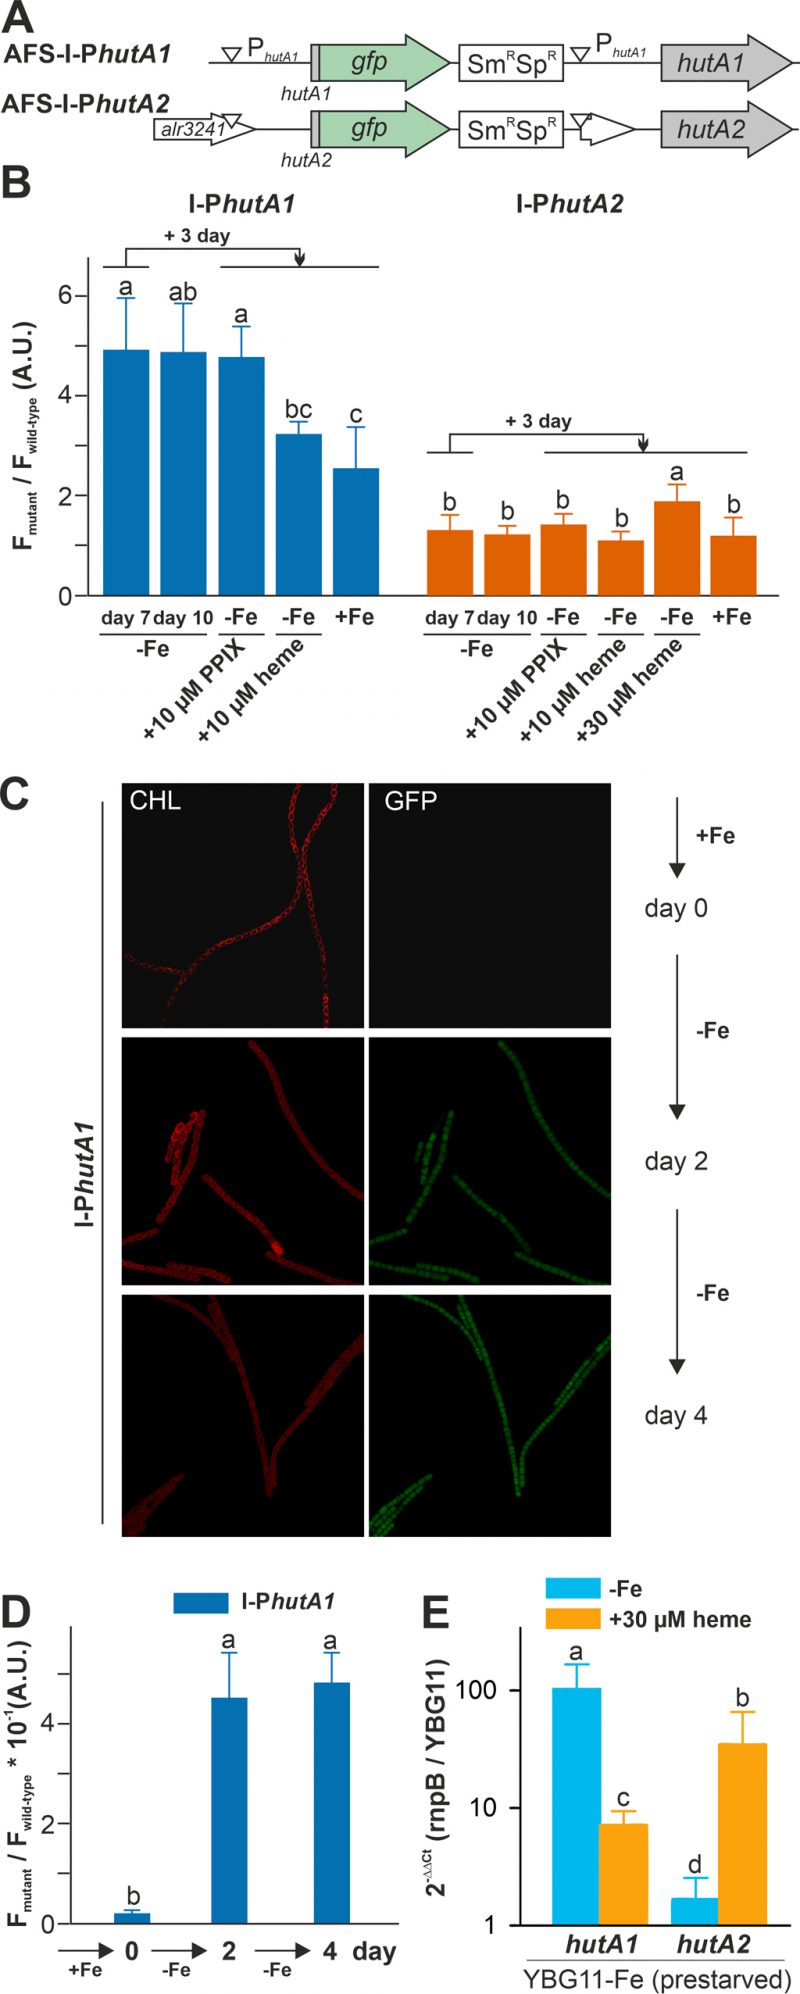
FIGURE 3: hutA1 and hutA2 are expressed in iron- and heme-dependent manner. (A) Strategy for genomic plasmid insertion to generate AFS-I-PhutA1 and AFS-I-PhutA2. The white downward triangles indicate the predicted promoter start sites. (B) Anabaena wild-type, AFS-I-PhutA1 (left) and AFS-I-PhutA2 (right) strains were grown in YBG11 medium without iron for seven days (first bar). After seven days the culture was transferred into a new medium for growth for three days in YBG11-Fe (second bar), YBG11 medium without iron but with 10 µM protoporphyrin IX (third bar), 10 µM (forth bar) or 30 µM heme (fifth bar for AFS-I-PhutA2) or in YBG11, which contains iron (last bar). The ratio of the GFP fluorescence of the mutant strain and the background in wild-type Anabaena is shown. The results represent the average of at least three independent experiments. (C) AFS-I-PhutA1 was grown in YBG11-Fe medium cultures (OD750 nm = 0.02) supplemented with 10 mM NaHCO3 and bubbled with CO2-enriched air (1% CO2 v/v). Growth was monitored on day 0 (top), day 2 (middle) and day 4 (bottom). Images are representative for multiple replicas and autofluorescence (left) and GFP fluorescence (right) are shown. (D) Images of Anabaena wild-type and AFS-I-PhutA1 strains were taken from (C) and the GFP fluorescence was quantified using a cross section of representative cells. The results represent the average of five independent cultures. (E) Anabaena pre-starved for 21 days was transferred to YBG11 medium, YBG11 medium without iron or YBG11 medium without iron but with 30 µM heme. After three days of incubation, RNA was extracted and qRT-PCR was performed. Ct values for rnpB and for the indicated gene in cultures grown in YBG11 medium were used to calculate the presented values. The average and standard deviation of n>3 independent biological replicas are shown. The statistical analysis in (B), (D) and (E) was performed using ANOVA with ranks indicated with p<0.05.
–
Both strains were pre-starved by growth in iron-depleted medium for seven days. Subsequently, cell cultures were inoculated in iron-depleted medium, iron-depleted medium supplemented with 10 µM protoporphyrin IX (PPIX) representing the last precursor in heme synthesis, 10 µM of heme or standard medium containing iron, and grown for three days. Wild-type Anabaena was used in parallel to control endogenous fluorescence signals. The GFP fluorescence was visualized and quantified and the ratio to the background signal in wild-type Anabaena is presented.
–
GFP fluorescence above background was observed after seven or ten days of iron starvation in filaments of AFS-I-PhutA1, but not in AFS-I-PhutA2 (Figure 3B; bars one and two). The addition of 10 µM protoporphyrin IX did not alter the GFP-fluorescence level in the two mutant strains (bar three). However, the signal in AFS-I-PhutA1 was reduced when cells were grown in iron-free medium supplemented with 10 µM heme or in standard medium (bars four and five). These observations indicate that AFS-I-PhutA1 is upregulated under iron starvation and that the induction of expression is iron and not backbone dependent, because protoporphyrin IX does not repress expression despite heme and protoporphyrin IX have an almost identical structure. The GFP fluorescence signal in AFS-I-PhutA2 was almost not detectable under any condition. Only after the addition of heme at a higher concentration (30 µM) an increase of the GFP signal was observed (bar five).
–
The velocity of hutA1 induction in the mutant AFS-I-PhutA1 was also determined. The strains were grown in YBG11 medium and then exposed to iron starvation by transfer into iron-free YBG11 medium to monitor the GFP signal. At the time of inoculation in YBG11-Fe medium, no GFP signal was detectable (Figure 3C and 3D, day 0). After two and four days of growth in the absence of iron, a comparable GFP signal was observed (second and third panels). This shows that starvation occurs faster than expected from typical chlorophyll a monitoring [35].
–
The genetic approach was complemented by the analysis of the mRNA abundance by qRT-PCR in the wild-type. Anabaena was pre-starved for 21 days and then transferred to either YBG11 medium, iron-depleted medium or iron-depleted medium supplemented with 30 µM heme. After seven days, mRNA was analyzed and the expression was normalized to rnpB levels and the level of the gene in cells grown in YBG11 medium. The high expression of hutA1 observed during continuous iron starvation in comparison to growth in YBG11 medium (Figure 3E, blue) parallels the observation with the mutant strain (Figure 3B). Similarly, the transcript abundance of hutA1 was reduced in the presence of heme when compared to iron-depleted medium, although the expression was still enhanced compared to the one found in cells grown in standard medium (Figure 3E, orange bar). For hutA2, qRT-PCR analysis confirmed the results observed using the GFP reporter as well. A similar transcript abundance of hutA2 was found when cells were grown in iron-depleted or iron-containing medium (Figure 3E, blue bar). In the presence of heme, the mRNA level of hutA2 was enhanced when compared to that of cells grown in YBG11 medium (Figure 3E, orange bar).
–
Taken together, our results show that the expression of hutA1 is clearly dependent on the level of iron supply, which confirms previous observations [30], [35], [39], [40]. Its induction occurs shortly after sensing of iron starvation, which is more rapid than the one seen for the schizokinen sensing system [35], [36]. Moreover, its induction can in part be hampered by addition of heme, but not by addition of the protoporphyrin IX, which supports the dependence on iron rather than on the heme backbone (Figure 3). In contrast, the expression of hutA2 appears to be independent of iron starvation, which parallels previous reports [30], [40]. However, hutA2 expression is dependent on elevated levels of heme and, interestingly, is also regulated by FurA [38]. Thus, the increase of expression of hutA2 might be related to the observed heme dependence of FurA in Anabaena [41] and, therefore, FurA might serve as a sensor of heme availability for hutA2.
–
The function of HutA1 and HutA2 is related to heme uptake
–
Anabaena is able to take up and utilize exogenous heme (Figure 1, 2) and the expression of hutA1 and hutA2 appears to be iron and heme dependent (Figure 3). To gain insight into their function, plasmid insertion mutants previously generated and annotated as AFS-I-hutA1 and AFS-I-hutA2 (Figure 4A; [36]) were analyzed. Segregated colonies were isolated for both mutants (Figure 4B), indicating that the genes are not essential. It is worth mentioning that we were unable to create a double mutant, even when grown in normal media.
–
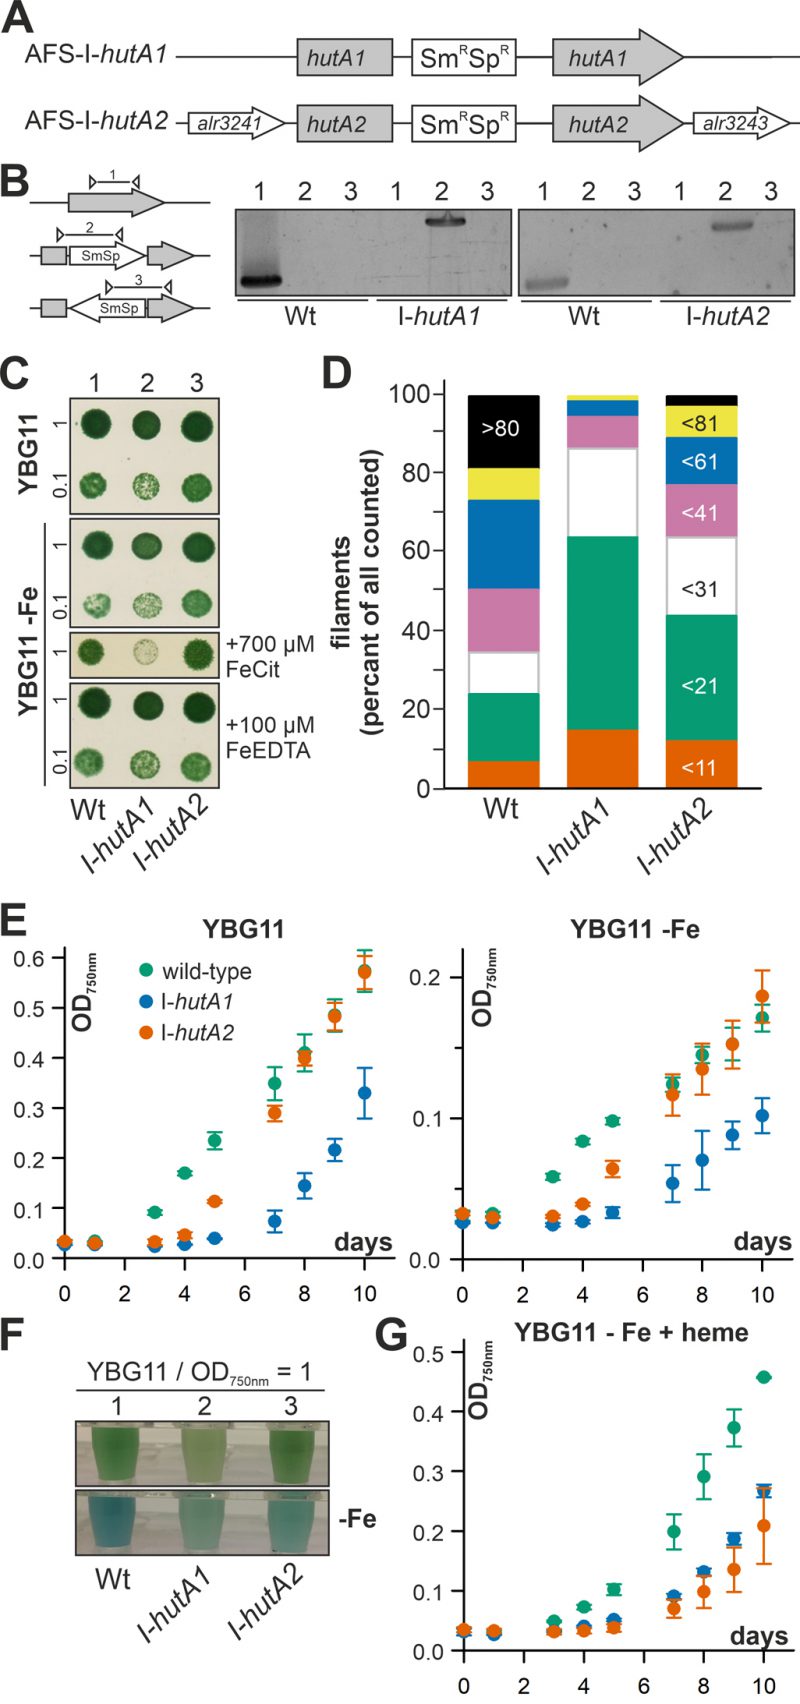
FIGURE 4: Role of alr2153 and alr3242 in heme uptake. (A) Strategy model for plasmid insertion in Anabaena genome to generate AFS-I-hutA1 and AFS-I-hutA2. (B) Genomic DNA isolated from Anabaena wild-type, AFS-I-hutA1 and AFS-I-hutA2 was used for PCR with gene-specific primers (lane 1) or plasmid-specific and gene-specific right (lane 2) or left internal primers (lane 3). (C) 10 µl of a culture of Anabaena wild-type (lane 1), AFS-I-hutA1 (lane 2) or AFS-I-hutA2 (lane 3) with a density OD750nm of 1 or 0.1 as indicated were spotted on solid YBG11 with (upper panel) or without iron (panel 2-4) supplemented with Fe-citrate (panel 3) or Fe-EDTA (panel 4). Representative images of plates after incubation for seven days are shown. (D) The three strains were grown in liquid YBG11 supplemented with 10 mM NaHCO3 and bubbled with CO2-enriched air (1% CO2 v/v). The filament length was counted for 75 filaments in three independent cultures. The bin size is indicated on the right bar. (E) Growth of the three strains in YBG11 (left) or YBG11 –Fe (right) was monitored at OD750nm after inoculation with a starting OD750nm of 0.02. The color code is given on the left plot. (F) The three strains were grown for seven days in YBG11 (top) or YBG11 –Fe (bottom) and cultures at OD750 nm = 1 are shown. (G) Growth of the three strains in YBG11 –Fe with 30 µM heme was monitored at OD750nm after inoculation with a starting OD750nm of 0.02. The color code is given in (E).
–
The growth of the single mutants on solid YBG11 medium was not reduced when compared to wild-type (Figure 4C, upper panel). The growth of the mutant strains was also not drastically altered by removal of iron or replacement of the iron source by Fe-EDTA (Figure 4C, second and fourth panel). Only when the iron source was replaced by iron citrate, AFS-I-hutA1 showed a significant reduction of growth on solid medium (Figure 4C, third panel).
–
Mutants of outer membrane proteins or outer membrane biogenesis factors often show an altered membrane integrity or filament length. Hence, the filament lengths of Anabaena wild-type and mutants grown in bubbled YBG11 was determined. About 50% of all filaments of wild-type Anabaena contain more than 60 cells (Figure 4D, first bar). In contrast, two thirds of all filaments of AFS-I-hutA1 are composed of 20 or less cells (Figure 4D, second bar). The filaments of AFS-I-hutA2 are in general longer than that of AFS-I-hutA1 but shorter than that shown by the wild-type, as more than 50% of all filaments contain less than 31 cells (Figure 4D, third bar). The filament length reduction could be related to a general defect of the outer membrane because mutants with enhanced outer membrane permeability show shorter filaments [42]. Alternatively, it could be related to a reduced iron uptake capacity. On the one hand, it was documented that filament length was dependent on iron availability, e.g. for Lyngbya majuscule [43]. On the other hand, it is suggested that the filament length is optimized toward light perception and, thus, photosynthetic capacity [44], which would be reduced by iron limitation (e.g. [3], [45].
–
The difference of the filament length prompted the analysis of the general growth behavior in liquid medium. In standard YBG11 medium AFS-I-hutA2 shows an initial growth delay but subsequently a similar growth as found for the wild-type (Figure 4E, left plot, green and orange). In contrast, AFS-I-hutA1 exhibits a general growth delay (Figure 4E, left plot, blue). All strains show a growth reduction in medium without iron when compared to normal growth conditions, but with the same behavior of the mutants as seen for YBG11 (Figure 4E, right plot). However, AFS-I-hutA1 exhibits a pale phenotype under both conditions (Figure 4F). Moreover, in the absence of iron AFS-I-hutA2 shows a pale phenotype in comparison to the wild-type as well (Figure 4F, bottom panel). When heme is the only iron source, the wild-type is able to recover growth close to standard medium levels (Figure 4G, green vs. Figure 4E, left plot, green), while both mutants show a reduced growth (Figure 4G). This clearly supports the bioinformatics classification of HutA1 and HutA2 as heme transporters.
–
Remarkably, the gene coding for HutA2, but not the one coding for HutA1, is located in close genomic proximity to three genes putatively coding for a plasma membrane-localized ABC transporter (alr3240, alr3241 and alr3243; Figure 5A). This putative transporter remains to be characterized, but comparison to other pathogenic Gram-negative bacteria or marine bacteria such as Microscilla marina suggest a function as a second part of the heme transport system for the three proteins [17], [46].
–
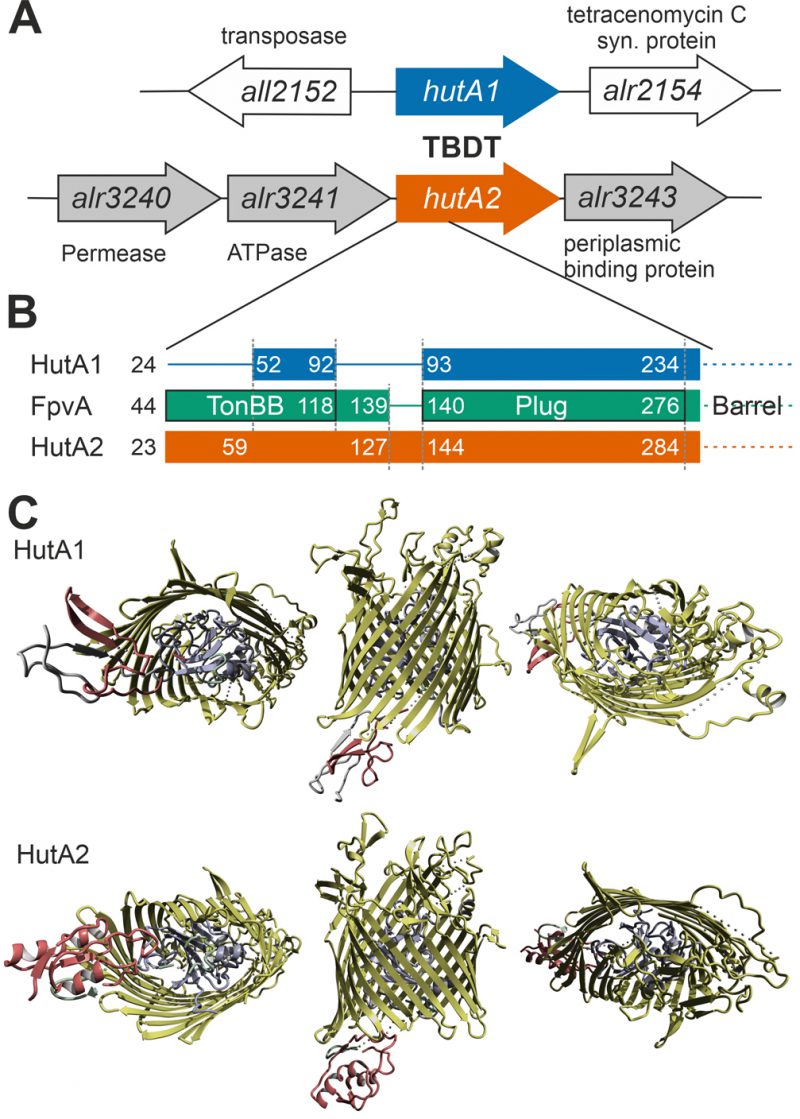
FIGURE 5: Comparison of HutA1 and HutA2 properties by bioinformatics. (A) Model of the genomic region surrounding hutA1 and hutA2 sequence. (B) Bars show the alignment of the N-terminal domain containing the TonB box and the plug domain between HutA1, HutA2 and FpvA (PDB: 2IAH). Numbers indicate the amino acid position of the full-length sequence. (C) Structural model of HutA1 and HutA2 created by structural modeling as described in Materials and Methods.
–
Moreover, based on structural modeling using the structure that was obtained as best hit (ferripyoverdine receptor FpvA; PDB: 2IAH; [47]), HutA1 and HutA2 contain a TonB box (TonBB) of different length (Figure 5B). HutA1 has a very short TonBB and the linker between TonBB and the plug domain is absent. In turn, HutA2 has a prolonged linker domain between TonBB and the plug domain (Figure 5B). Thus, structural modelling allows the prediction of a typical heme-transporting TBDT with a standard plug domain for HutA2 (Figure 5C). The TonBB is predicted to form a helical structure, with two β-sheets but at the N-terminus and, thus, distant from the plug domain. HutA1 is also modelled as a typical TBDT including the plug domain, but the TonBB is modelled as a β-sheet structure close to the plug domain (Figure 5C). Hence, it is tempting to speculate that the two TBDTs are energized by a different mechanism, which would be consistent with a different phenotype of the two mutants. Whether the different mode of energizing is related to the interaction with different TonB proteins [48] remains to be established.
DISCUSSIONAnabaena is able to utilize heme for growth, because external heme can compensate for the absence of other iron sources (Figure 1) and the loss of function of either one of the heme transporter results in growth delay when heme is the only iron source (Figure 4). The internalized heme can either be used as metabolite or by its decomposition as iron source. The reduced expression of hemH in the presence of external heme (Figure 2) supports the first part of the hypothesis. The enhanced expression of pebA after addition of heme in comparison to addition of iron (Figure 2) supports the second part of the notion. The latter is further consistent with the observed repression of hutA1 expression in the absence of iron by addition of heme, but not by addition of iron-free protoporphyrin IX (Figure 3). Moreover, the chlorophyll a level recovers after heme addition (Figure 1), which is consistent with both mechanisms. The velocity of iron removal from heme appears to be fast because hutA1 expression in the absence of iron is reduced 24 hours after heme addition (Figure 3).
–
The iron starvation-dependent expression of hutA1 (Figure 3) [30], [35], [39], [40] suggests that the encoded protein is required for the optimization of the uptake of xenosiderophores under iron limiting conditions. Consistent with this notion, in the presence of high concentrations of heme (30 µM) the expression of this gene is reduced likely to downregulate the rate of uptake (Figure 3). In contrast, hutA2 appears to be expressed at a basal level with a putative induction by heme supplementation (Figure 3). This could suggest that the main function of HutA2 is the uptake of heme as nutrition. The enhanced expression in the presence of high concentrations of heme are consistent with this notion, as the protein is only produced when the nutrition is available. Consistent with an in part distinct function of the two proteins, both mutants display some phenotypic differences. For example, AFS-I-hutA1, but not AFS-I-hutA2, shows a pale phenotype under normal growth conditions, and the growth delay of AFS-I-hutA1 is more pronounced than that seen for AFS-I-hutA2 (Figure 4). Most remarkably, AFS-I-hutA1 is strongly impaired in growth in the presence of iron citrate, while AFS-I-hutA2 shows a growth comparable to wild-type (Figure 4). Consistent with a differential functionality, the two TBDTs HutA1 and HutA2 show distinct structural properties as discovered by bioinformatics analysis (Figure 5). However, the function of the two proteins is in part overlapping, as both mutants show shorter filaments when compared to the wild-type under normal growth conditions and a growth phenotype related to iron and heme availability (Figure 4). In addition, we were unable to generate a double mutant, which on the one hand is consistent with a functional overlap, and on the other hand suggests an additional function of the TBDTs even. Thus, we can conclude that the Anabaena genome encodes for two outer membrane proteins with capacity to transport heme, while both proteins might serve additional functions. In addition, the presence of HutA-like proteins in cyanobacteria is not limited to Anabaena, as previous bioinformatics analysis identified sequences with similar features encoded in the genome of some cyanobacteria of the order Chroococcales, but not of the order Gloeobacterales [30]. At the time of the analysis genomic sequences of cyanobacteria of the order Oscillatoriales and Prochlorales were not available. An initial analysis, however, documents that in some species of these orders as well as in other species then Anabaena in the order Nostocales HutA-like sequences can be detected (Table 1). Worth mentioning, in the other species analyzed previously and in here only a single gene coding for a HutA-like protein was detected, and in all analyzed orders species were identified in which a HutA-like sequence could not be identified (Table 1, [30]). We conclude that heme transport might not be restricted to Anabaena, but at the same time is not specific to a cyanobacterial order and thus might be related to the habitat of origin, a notion which needs to be challenged in the future.
–
TABLE 1. Identified sequences with similarity to HutA1 or HutA2 encoded by the genome of the cyanobacteria.
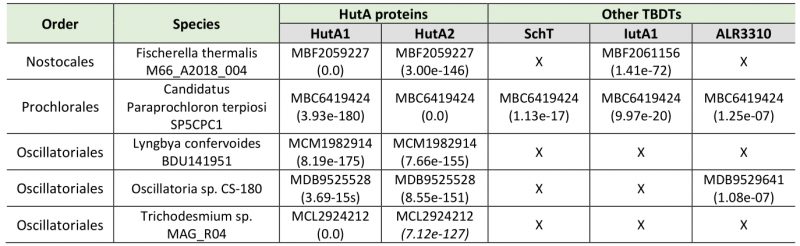
TABLE 1. Identified sequences with similarity to HutA1 or HutA2 encoded by the genome of the cyanobacteria.
MATERIAL AND METHODSBacterial strains and growth conditions
–
Anabaena sp. (also known as Nostoc sp.) PCC 7120 wild-type and mutant strains were grown photoautotrophically under constant light conditions (70 µmol photons m-2 s-1) at 30°C. Cultures were grown in liquid YBG11 [49] medium (shaking: 100 rpm) or on solidified YBG11 medium prepared by addition of 1% Bacto agar (Otto Nordwald GmbH, Hamburg, Germany). When indicated, cultures were supplemented with 10 mM NaHCO3 and bubbled with CO2-enriched air (1% CO2 v/v). Mutant strains were supplemented with streptomycin and spectinomycin (final concentration: 5 µg ml−1 each). Anabaena strains used in this study are listed in Table 2, and previously created strains are described in [36].
–
TABLE 2. Strains used in this study.
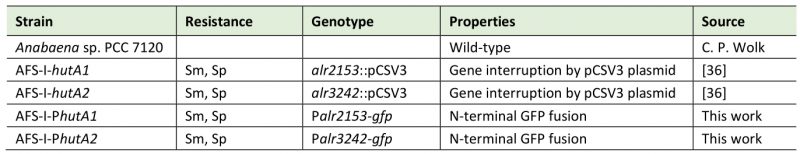
AFS: Anabaena Frankfurt Schleiff; Sm: streptomycin; Sp: spectinomycin.
–
For iron starvation, all flasks were treated with hydrochloric acid (10%) and extensively rinsed with ddH2O. Pre-starvation was obtained by growth for 21 or seven days in the absence of an iron source. Chlorophyll a content was determined to assure the starvation status [35]. For growth rate determination, cultures were harvested and washed with iron-depleted YBG11. Cells were inoculated at OD750 nm = 0.02. OD750 nm was recorded once per day. For phenotyping on solid medium, cultures were grown for 5-7 days in liquid YBG11 and 5 µl of cell suspension (OD750 = 1) were spotted on YBG11 plates of indicated composition. Growth was monitored for 7 days.
–
Fragmentation of filaments was analyzed by counting the number of cells per filament after 3 days of growth (inoculation OD750 nm = 0.02) in bubbled YBG11 medium. Microscopy was performed after 3 days of growth and cells of 75 filaments per strain were counted as previously described [42].
–
Expression analysis
–
RNA was isolated from strains that had been grown for 7 days in standard YBG11 medium, iron-depleted YBG11 medium and iron-depleted YBG11 medium supplemented with 30 µM heme. RNA was extracted with TRIzol (Thermo Fisher Scientific, Waltham, Massachusetts, USA) and treated with DNaseI as described [40]. cDNA synthesis was done with RevertAid Reverse transcriptase from Thermo Fisher Scientific.
–
qPCR was performed with a StepOnePlus Cycler (Thermo Fisher Scientific) and with PowerUp SYBR Green Master Mix (Applied Biosystems, Waltham, Massachusetts, USA). The oligonucleotide pairs chosen for this study were previously tested to yield a single product and the obtained values were normalized to the expression values obtained for rnpB [40], [50]. The ΔΔct was calculated by normalization to the Δct of the wild-type [50].
–
Genetic procedures
–
Genomic DNA from Anabaena was isolated from 50-ml shaking cultures [51]. To generate the strains AFS-I-Palr2153 and AFS-I-Palr3242 (Table 2) 487- and 316-bp fragments of the upstream region of alr2153 and alr3242, respectively, including the start codon of the respective gene, were amplified by PCR on genomic DNA with specific oligonucleotides (Table 3) containing ClaI/EcoRV restriction sites. The amplified fragments were cloned into the vector pGEM-T Easy (Promega GmbH, Walldorf, Germany; Table 4) for sequencing.
–
Heme uptake by Anabaena sp. PCC 7120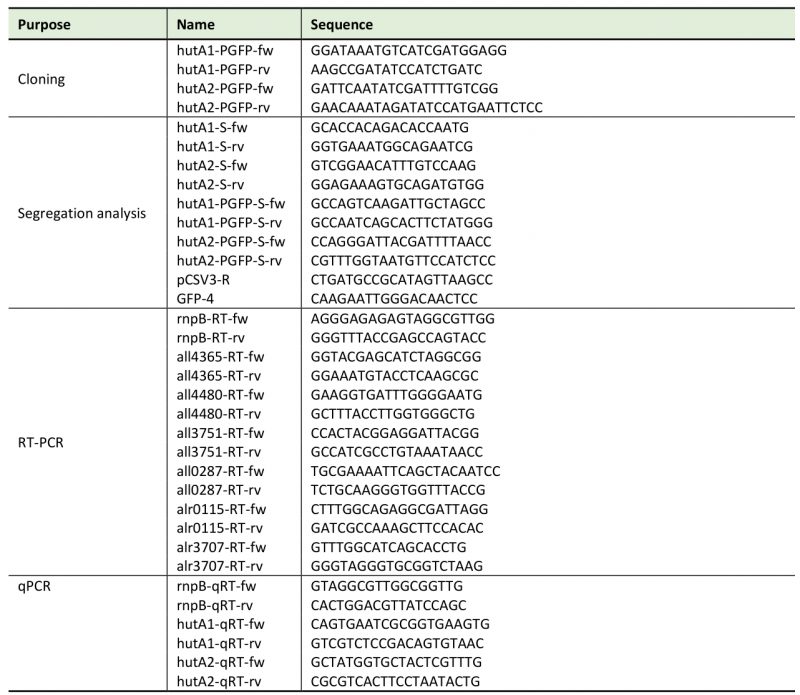
–
After confirming the right sequence, the fragments were restricted and cloned into pCSEL21, which contains the gfp ORF [52]. Digestion with EcoRI resulted in the excision of the fusion fragment, which was then ligated to pCVS3 and conjugated into wild-type Anabaena. Conjugal transfer of plasmids into Anabaena was done as described [53], [54]. Incorporation of the fusion fragment into the Anabaena genome was confirmed by PCR.
–
TABLE 4. Plasmids used in this study.
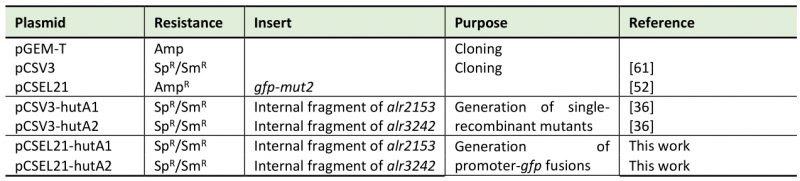
Sp: spectinomycin; Sm: streptomycin; Amp: ampicillin.
–
Escherichia coli DH5α, HB101 and ED8654 were used for plasmid constructions as well as conjugations into Anabaena [55], [56].
–
Confocal microscopy
–
Microscopy was in general performed as described in [57]. In brief: 50 µl of Anabaena wild-type or mutant strain samples from liquid cultures were placed on top of BG11 solid medium and visualized using a 63X 1.40 oil immersion objective attached to the confocal laser-scanning microscope Zeiss LSM 780. GFP was excited with an argon ion laser at 488 nm irradiation. Fluorescent emission for GFP imaging and cyanobacterial autofluorescence was collected between 500-540 nm and 630-700 nm, respectively.
–
Quantification of GFP fluorescence
–
The GFP fluorescence signal was quantified in two different ways. (i) Experiments shown in Figure 3B were performed in a Tecan Spark 10 M plate reader with the excitation wavelength at 488 nm and the GFP fluorescence emission measurement at 533 nm. The optical density of the respective cultures was determined at 750 nm. A fluorescein solution (final concentration 1 ng/ml) was used as reference. 200 µl of each culture were measured in a black 96-well microplate with a clear bottom (Greiner Bio-One GmbH, Frickenhausen, Germany). The GFP fluorescence of each sample was normalized to the fluorescence of the fluorescein reference and to the optical density of each sample. The signal of the mutant was normalized to the wild-type. (ii) The quantification of the GFP fluorescence determined by confocal microscopy presented in Figure 3D was performed with the ZEN software by Zeiss (Carl Zeiss Microscopy GmbH, Oberkochen, Germany). A cross section of selected cells in the images was taken. The values in the GFP channel were averaged to get a final GFP count. The autofluorescence channel was used as control. Final GFP count of the mutant was normalized to wild-type and displayed.
–
Structure prediction
–
Structure prediction was based on Phyre2 [58]. The sequences of HutA1 (Alr2153) and HutA2 (Alr3242) were used as query with a secondary structure prediction to create a hidden markov model based on a multiple sequence alignment. Based on a search against known structures the backbone was modelled using the structure of the best hit (ferripyoverdine receptor FpvA; PDB: 2IAH; [47]) followed by loop and sidechain modelling with Phyre2. The alignment coverage was 93% (HutA1) and 97% (HutA2) with a confidence of 100% and a sequence identity of 16% (HutA1) and 18% (HutA2). YASARA including the structural alignment module MUSTANG [59] was used to define the structural domains (TonB box, intramolecular domain and barrel domain) and to create representations.
–
Sequence analysis
–
The protein sequences for Alr3242 (HutA2), Alr2153 (HutA1), Alr0397 (SchT), Alr2581 (IutA2) and All3310 [30], [34][35][36] were used for a best-blast-hit search on the level of the different taxonomic orders (Nostocales, Prochlorales and Oscillatoriales). From the 100 top-hits within each lineage sequences were selected from up to five different species for reciprocal best-BLAST-hit search against the translated genome of Anabaena [60]. Examples of species in which HutA-like sequences were identified are listed in Table 1.
REFERENCES Martin JH, Gordon RM, and Fitzwater SE (1991). The case for iron. Am Soc Limnol Oceanogr 36(8): 1793–1802. 10.4319/lo.1991.36.8.1793 Moore JK, Doney SC, Glover DM, and Fung IY (2001). Iron cycling and nutrient-limitation patterns in surface waters of the world ocean. Deep Res Part II 49(1–3): 463–507. 10.1016/S0967-0645(01)00109-6 Kranzler C, Rudolf M, Keren N, and Schleiff E (2013). Iron in cyanobacteria. In: Adv. Bot. Res. Elsevier Ltd; pp 57–105. Fresenborg L, Graf J, Schätzle H, and Schleiff E (2020). Iron homeostasis of cyanobacteria: advancements in siderophores and metal transporters. In: Adv. Cyanobacterial Biol. Elsevier Inc.; pp 85–117. Johnson KS, Gordon RM, and Coale KH (1997). What controls dissolved iron in the world ocean? Mar Chem 57: 137–161. 10.1016/S0304-4203(97)00043-1 Wu J, and Luther GW (1995). Complexation of Fe(III) by natural organic ligands in the Northwest Atlantic Ocean by a competitive ligand equilibration method and a kinetic approach. Mar Chem 50(1–4): 159–177. 10.1016/0304-4203(95)00033-N Boyd PW, and Ellwood MJ (2010). The biogeochemical cycle of iron in the ocean. Nat Geosci 3(10): 675–682. 10.1038/ngeo964 Gledhill M, and Buck KN (2012). The organic complexation of iron in the marine environment: A review. Front Microbiol 3(FEB): 1–17. 10.3389/fmicb.2012.00069 Norman L, Cabanes DJE, Blanco-Ameijeiras S, Moisset SAM, and Hassler CS (2014). Iron biogeochemistry in aquatic systems: From source to bioavailability. Chimia 68(11): 764–771. 10.2533/chimia.2014.764 Saha R, Saha N, Donofrio RS, and Bestervelt LL (2013). Microbial siderophores: A mini review. J Basic Microbiol 53(4): 303–317. 10.1002/jobm.201100552 Khan A, Singh P, and Srivastava A (2018). Synthesis, nature and utility of universal iron chelator – Siderophore: A review. Microbiol Res 212–213(August 2017): 103–111. 10.1016/j.micres.2017.10.012 Andrews SC, Robinson AK, and Rodríguez-Quiñones F (2003). Bacterial iron homeostasis. FEMS Microbiol Rev 27(2–3): 215–237. 10.1016/S0168-6445(03)00055-X Postle K (1990). TonB and the Gram-negative dilemma. Mol Microbiol 4(1990): 2019–2025. 10.1111/j.1365-2958.1990.tb00561.x Koebnik R, Locher KP, and Van Gelder P (2000). Structure and function of bacterial outer membrane proteins: Barrels in a nutshell. Mol Microbiol 37(2): 239–253. 10.1046/j.1365-2958.2000.01983.x Noinaj N, Guillier M, Barnard, TJ, and Buchanan SK (2010). TonB-Dependent Transporters: Regulation, Structure, and Function. Annu Rev Microbiol 64(1): 43–60. 10.1146/annurev.micro.112408.134247 Faraldo-Gómez JD, and Sansom MSP (2003). Acquisition of siderophores in gram-negative bacteria. Nat Rev Mol Cell Biol 4(2): 105–116. 10.1038/nrm1015 Tong Y, and Guo M (2009). Bacterial heme-transport proteins and their heme-coordination modes. Arch Biochem Biophys 481(1): 1–15. 10.1016/j.abb.2008.10.013 Layer G (2021). Heme biosynthesis in prokaryotes. Biochim Biophys Acta – Mol Cell Res 1868(1): 118861. 10.1016/j.bbamcr.2020.118861 Dailey HA, and Medlock AE (2022). A primer on heme biosynthesis. Biol Chem 403(11–12): 985–1003. 10.1515/hsz-2022-0205 Caughey WS (1967). Porphyrin proteins and enzymes. Annu Rev Biochem 36(1): 611–644. 10.1146/annurev.bi.36.070167.003143 Brown SB, Houghton JD, and Vernon DI (1990). New trends in photobiology biosynthesis of phycobilins. Formation of the chromophore of phytochrome, phycocyanin and phycoerythrin. J Photochem Photobiol B Biol 5(1): 3–23. 10.1016/1011-1344(90)85002-E Jeney V, Balla J, Yachie A, Varga Z, Vercellotti GM, Eaton JW, and Balla G (2002). Pro-oxidant and cytotoxic effects of circulating heme. Blood 100(3): 879–887. 10.1182/blood.V100.3.879 Vercellotti GM, Balla G, Balla J, Nath K, Eaton JW, and Jacob HS (1994). Heme and the vasculature: An oxidative hazard that induces antioxidant defenses in the endothelium. Artif Cells, Blood Substitutes, Biotechnol 22(2): 207–213. 10.3109/10731199409117415 Cornah JE, Terry MJ, and Smith AG (2003). Green or red: What stops the traffic in the tetrapyrrole pathway? Trends Plant Sci 8(5): 224–230. 10.1016/S1360-1385(03)00064-5 Heinemann IU, Jahn M, and Jahn D (2008). The biochemistry of heme biosynthesis. Arch Biochem Biophys 474(2): 238–251. 10.1016/j.abb.2008.02.015 Layer G, Reichelt J, Jahn D, and Heinz DW (2010). Structure and function of enzymes in heme biosynthesis. Protein Sci 19(6): 1137–1161. 10.1002/pro.405 Chauhan S, Titus DE, and O’Brian MR (1997). Metals control activity and expression of the heme biosynthesis enzyme δ-aminolevulinic acid dehydratase in Bradyrhizobium japonicum. J Bacteriol 179(17): 5516–5520. 10.1128/jb.179.17.5516-5520.1997 Ochsner UA, Johnson Z, and Vasil ML (2000). Genetics and regulation of two distinct haem-uptake systems, phu and has, in Pseudomonas aeruginosa. Microbiology 146(1): 185–198. 10.1099/00221287-146-1-185 Mariscal V, Herrero A, and Flores E (2007). Continuous periplasm in a filamentous, heterocyst-forming cyanobacterium. Mol Microbiol 65(4): 1139–1145. 10.1111/j.1365-2958.2007.05856.x Mirus O, Strauss S, Nicolaisen K, von Haeseler A, and Schleiff E (2009). TonB-dependent transporters and their occurrence in cyanobacteria. BMC Biol 7: 68. 10.1186/1741-7007-7-68 Nicolaisen K, and Schleiff E (2012). Iron Dependency of, and Transport by, Cyanobacteria. In: Cornelius P, Andrews SC, editors Iron Uptake Homeost. Microorg. Caister Academic Press; pp 203–228. Nicolaisen K, Hahn A, Valdebenito M, Moslavac S, Samborski A, Maldener I, Wilken C, Valladares A, Flores E, Hantke K, and Schleiff E (2010). The interplay between siderophore secretion and coupled iron and copper transport in the heterocyst-forming cyanobacterium Anabaena sp. PCC 7120. Biochim Biophys Acta – Biomembr 1798(11): 2131–2140. 10.1016/j.bbamem.2010.07.008 De Lorenzo V, Bindereif A, Paw BH, and Neilands JB (1986). Aerobactin biosynthesis and transport genes of plasmid colV-K30 in Escherichia coli K-12. J Bacteriol 165(2): 570–578. 10.1128/jb.165.2.570-578.1986 Nicolaisen K, Moslavac S, Samborski A, Valdebenito M, Hantke K, Maldener I, Muro-Pastor AM, Flores E, and Schleiff E (2008). Alr0397 is an outer membrane transporter for the siderophore schizokinen in Anabaena sp. strain PCC 7120. J Bacteriol 190(22): 7500–7507. 10.1128/JB.01062-08 Rudolf M, Kranzler C, Lis H, Margulis K, Stevanovic M, Keren N, and Schleiff E (2015). Multiple modes of iron uptake by the filamentous siderophore-producing cyanobacterium, Anabaena sp. PCC 7120. Mol Microbiol 97(3): 577–588. 10.1111/mmi.13049 Rudolf M, Stevanovic M, Kranzler C, Pernil R, Keren N, and Schleiff E (2016). Multiplicity and specificity of siderophores uptake in the cyanobacterium Anabaena sp. PCC 7120. Plant Mol Biol 92(1–2): 57–69. 10.1007/s11103-016-0495-2 Simpson FB, and Neilands JB (1976). Siderochromes in cyanophyceae: Isolation and characterization of schizokinen from Anabaena sp. J Phycol 12(1): 44–48. 10.1111/j.1529-8817.1976.tb02824.x González A, Bes MT, Valladares A, Peleato ML, and Fillat MF (2012). FurA is the master regulator of iron homeostasis and modulates the expression of tetrapyrrole biosynthesis genes in Anabaena sp. PCC 7120. Environ Microbiol 14(12): 3175–3187. 10.1111/j.1462-2920.2012.02897.x Dong Y, and Xu X (2009). Outer membrane proteins induced by iron deficiency in Anabaena sp. PCC 7120. Prog Nat Sci 19(11): 1477–1483. 10.1016/j.pnsc.2009.02.009 Stevanovic M, Lehmann C, and Schleiff E (2013). The response of the TonB-dependent transport network in Anabaena sp. PCC 7120 to cell density and metal availability. BioMetals 26(4): 549–560. 10.1007/s10534-013-9644-0 Pellicer S, González A, Peleato ML, Martinez JI, Fillat MF, and Bes MT (2012). Site-directed mutagenesis and spectral studies suggest a putative role of FurA from Anabaena sp. PCC 7120 as a heme sensor protein. FEBS J 279(12): 2231–2246. 10.1111/j.1742-4658.2012.08606.x Burnat M, Schleiff E, and Flores E (2014). Cell envelope components influencing filament length in the heterocyst-forming cyanobacterium Anabaena sp. strain PCC 7120. J Bacteriol 196(23): 4026–4035. 10.1128/JB.02128-14 Ahern KS, O’Neil JM, Udy JW, and Albert S (2006). Effects of iron additions on filament growth and productivity of the cyanobacterium Lyngbya majuscula. Mar Freshw Res 57(2): 167–176. 10.1071/MF05022 Tamulonis C, Postma M, and Kaandorp J (2011). Modeling filamentous cyanobacteria reveals the advantages of long and fast trichomes for optimizing light exposure. PLoS One 6(7): 1–12. 10.1371/journal.pone.0022084 Jiang HB, Lu XH, Liu LM, and Qiu BS (2020). Adaptive mechanism of the model photosynthetic organisms, cyanobacteria, to iron deficiency. In: Wang Q, editor Microb. Photosynth. Springer, Singapore; pp 197–244. Hopkinson BM, Roe KL, and Barbeau KA (2008). Heme uptake by Microscilla marina and evidence for heme uptake systems in the genomes of diverse marine bacteria. Appl Environ Microbiol 74(20): 6263–6270. 10.1128/AEM.00964-08 Wirth C, Meyer-Klaucke W, Pattus F, and Cobessi D (2007). From the Periplasmic Signaling Domain to the Extracellular Face of an Outer Membrane Signal Transducer of Pseudomonas aeruginosa: Crystal Structure of the Ferric Pyoverdine Outer Membrane Receptor. J Mol Biol 368(2): 398–406. 10.1016/j.jmb.2007.02.023 Schätzle H, Arévalo S, Fresenborg L, Seitz H-M, Flores E, and Schleiff E (2021). Functional Diversity of TonB-Like Proteins in the Heterocyst-Forming Cyanobacterium Anabaena sp. PCC 7120. mSphere 6(6): 1–17. 10.1128/msphere.00214-21 Shcolnick S, Shaked Y, and Keren N (2007). A role for mrgA, a DPS family protein, in the internal transport of Fe in the cyanobacterium Synechocystis sp. PCC6803. Biochim Biophys Acta – Bioenerg 1767(6): 814–819. 10.1016/j.bbabio.2006.11.015 Livak KJ, and Schmittgen TD (2001). Analysis of relative gene expression data using real-time quantitative PCR and the 2-ΔΔCT method. Methods 25(4): 402–408. 10.1006/meth.2001.1262 Cai Y, and Wolk CP (1990). Use of a conditionally lethal gene in Anabaena sp. strain PCC 7120 to select for double recombinants and to entrap insertion sequences. J Bacteriol 172(6): 3138–3145. 10.1128/jb.172.6.3138-3145.1990 Olmedo-Verd E, Muro-Pastor AM, Flores E, and Herrero A (2006). Localized induction of the ntcA regulatory gene in developing heterocysts of Anabaena sp. strain PCC 7120. J Bacteriol 188(18): 6694–
留言 (0)