
記住我


Teeth and periodontal structures are subject to heavy, short-lasting, and intermittent forces during chewing function.
When this happens, the tooth is protected by the fluid inside the periodontal ligament (PDL), which acts as a shock absorber, preventing direct contact between the root and the alveolus.
Once compressed, the fluid flexes the walls of the alveolar process, inducing a piezoelectric response and a subsequent triggering of bone remodeling mechanisms.[1]
In orthodontics, on the other hand, the applied forces are continuous, maintained over time, and heavy enough to induce cell death in the periodontium leading to an “undermining resorption.”
As Proffit shows, after the first seconds of orthodontic force application, the crevicular fluid is squeezed out of the PDL, within a few minutes an alteration in blood flow occurs, and after 4–6 h of continuous force application teeth start to move.
In orthodontics, a distinction is made between continuous, interrupted, and intermittent forces.
In the case of aligners, the teeth movement depends on intermittent forces which compared to continuous ones act over a shorter period of time and are completely eliminated with the removal of the force-generating device.[2]
The mean movement predictability with aligners with the conventional protocol of 22 h a day and change every 10 days was around 50%.[3]
Especially some movements presented a low accuracy such as rotations of cuspids and bicuspids, intrusion, extrusion, bodily movements, and torque expression.[3,4]
Although aligners should ideally be changed every 14 days to make movement in the posterior sectors more predictable; recently, it has been showed that also a 7-day protocol is similar in accuracy considering the conventional protocol of 22 h/day,[5] but no study date has analyzed protocols involving a different number of hours of clear aligners wear.
Some results are available for the application of intermittent forces on animals.
Hayashi et al.[6] analyzed dental movement on rats comparing 24-h and 8-h force application protocols and showed that the total dental movement obtained with the intermittent force was 73.7% of the movement obtained with continuous force.
This means that even if movement with intermittent forces is slower and with a high relapse rate, it is still sufficient to induce bone resorption and thus effective tooth movement.
During the orthodontic tooth movement (OTM), a change occurs in the chemical environment characterized by the release of cytokines and prostaglandins.
As these chemical messengers increase, the inflammation process starts with subsequent vasodilation and increased vascular permeability.[7]
Then, the osmotically mediated inflammatory exudate present in the gingival sulcus, known as gingival crevicular fluid (GCF), tends to increase in volume.[8]
Nowadays, the volumetric quantification of GFC can be performed by means of an electronic device known as Periotron (Pro-Flow Inc., Amityville, New York, USA).
Once the paper strips are inserted into the gingival sulcus then they have to be placed between the jaws of the instrument. The Periotron measures the electrical capacitance of the wet paper strips which are greater the wetter they are. The opposing charges on the jaws induce a polarity of the molecules and the higher the ability to conduct electricity of the paper strips, the higher the Periotron score.
This instrument may be useful to investigate changes in GCF volume over time correlated with the amount of orthodontic movement achieved using two different clear aligner protocols, one of 20 h and one of 12 h.
ObjectivesFirst, the objective of the study was to evaluate quantitatively the inflammatory trend in the first 8 h of clear aligner use by means of the Periotron device. Then, the correlation between the quantity of GCF and the amount of OTM obtained with clear aligners using two different protocols, one of 20 h and one of 12 h, was evaluated.
MATERIAL AND METHODS Study sampleParticipants were recruited from the Postgraduate School of Orthodontics of the University of Ferrara. At the first visit, eligibility for inclusion in the study was as follows: (1) good health status, (2) good control of oral hygiene, (3) no periodontal disease with normal values of Silness and Loe Plaque Index (PI), Lobene Modified Gingival Index (GI), and Bleeding on Probing (BOP), and (4) no anti-inflammatory or antibiotic therapy in the previous 6 months. A total of ten healthy adult patients for which orthodontic treatment with clear aligners in the upper arch was planned (7 F, 3 M, mean age 27.5, Standard Deviation 1.5) were selected to participate in a split-mouth pilot study. Informed consent was obtained from each subject; the study was conducted in accordance with the 1975 Declaration of Helsinki ethical standards and its later amendments, and comparable ethical standards. The study design was approved by the Ethics Committee of the Ferrara University Postgraduate School of Orthodontics (Through Luigi Borsari 46, Ferrara, Italy; approval number 2/2022)
Study designThe orthodontic treatment was conducted with F22 clear aligners (Sweden and Martina, Due Carrare, Italy). All digital dental scans and treatment planning were designed and performed by the same operator (F.C.). Throughout a digital planification of movements, vestibular crown uncontrolled tipping was planned for upper lateral-posterior sectors. In particular, only 2° of crown tipping movement was considered in aligner n 1 for maxillary canines (1.3 and 2.3) and both bicuspids (1.4, 1.5, 2.4, and 2.5). The study lasted 14 days, during which the investigated subjects were asked to wear only the first upper aligner, in which the movement described above was prescribed in the same entity in both quadrants. All other corrections, as well as the attachments positioning, were postponed in the subsequent aligners.
Two weeks before the beginning of treatment, all subjects underwent supragingival prophylaxis and were given oral hygiene instructions to control intraoral inflammation. A periodontal check-up was performed and normal values of Silness and Loe PI, Lobene Modified GI, and BOP were shown.
The F22 aligner was delivered after been cut in the middle between 1.1 and 2.1 and divided in two equal halves and specific instructions were provided to the patient.
All patients were asked to wear one random half of the upper aligner for 12 h/day (Group 1) and the other half for 20 h/day (Group 2).
At 0 h (baseline), and every hour for the first 8 h of use, three GCF samples were collected in each quadrant of the upper arch. Patients involved in the study were wearing just one-half of the aligner for the first 8 h, and the GFC collection sites were the central points of the gingival sulcus of canines and bicuspids vestibular surfaces, where forces were applied.
Then, after 14 days of use, the same GCF measurements were repeated in the upper right and left quadrants, where different protocols of cooperation, 20 h/day versus 12 h/day, were followed.
GCF samples were collected by the same blinded operator (F.P.) using PerioPaper strips (Oraflow Inc, Plainview, NY). Teeth were first isolated with cotton rolls, cleaned, and dried gently with air before paper strips were applied 1 mm subgingival for 30 s.[8] After calibrating the instrument, the collected sample was measured by means of Periotron 8000 (Oraflow Inc., Plainview, NY). The readout is an absolute value, from 0 to 200, and it is correlated with the volume of serum exudate collected on the paper strip. The volume reflects the severity of the inflammatory process: the higher it is, the greater the amount of inflammation.
At this timepoint, after 14 days, new intraoral scans of the upper arch were performed for every patient and uploaded to Geomagic X Control Software (3D Systems Inc, Rock Hill, SC) together with the initial ones. The program was used by a blinded operator (F.Pe.) to superimpose the scans and automatically determined the best-fit alignment of the area of interest. The percentage of overlapping surfaces was evaluated within the tolerance ranges as follows: 0.5 to −0.5 mm.
The distance at FA point of canines and both bicuspids between the initial and the final scans was then calculated, in quadrant 1 and quadrant 2.
Data analysisThe first objective of the study was to evaluate the 12 h inflammatory trend of the quadrant with the aligner on, with respect to the control side (no aligner), by means of GCF samples collected every hour.
The mean, median, and standard deviation of all absolute values collected for both sides were calculated. To evaluate if any statistically significant differences between the treated and untreated quadrants are present in terms of inflammatory severity, a non-parametric Wilcoxon test was applied. The mean value of the three samples collected was always considered.
Second, the Friedman’s non-parametric test was used to evaluate whether there was a statistically significant difference between the GCF samples measured on the same subject every hour from 0 h to 12 h in the treated quadrant.
A new Wilcoxon paired-samples test was also performed to study any statistically significant differences between the Periotron values collected after 14 days in the 12 h protocol quadrant and in the 20 h protocol one.
Eventually, the purpose of the last analysis was to compare the FA point shift in mm calculated using Geomagic X Control Software using the two different protocols for 14 days.
A non-parametric Wilcoxon test was performed to see whether the distribution of values for the 20 h protocol was the same as the one for the 12 h protocol. The test was applied to paired samples and had a null hypothesis that the medians were equal.
In all cases, the assumption was rejected with P < 0.05.
IBM SPSS Statistics Software version 28 was used for the statistical analysis of data, and non-parametric tests were chosen due to the low sample size of the current pilot study.
RESULTSThe non-parametric Wilcoxon Test was statistically significant (P ≤ 0.05), so we rejected the null hypothesis that the distribution of “experimental sites” was the same as that of “control sites.” There was a statistically significant difference between the crevicular fluid volume with and without the clear aligner on.
The non-parametric Friedman test turned out to be statistically significant, with P < 0.001, so we rejected the null hypothesis that the distributions of 0 h, 1 h, 2 h, 3 h, 4 h, 5 h, 6 h, 7 h, and 8 h were all the same, as reported in [Figure 1]; therefore, at least, one was different from the others.

Figure 1:: Related-samples Friedman’s two-way analysis of variance by ranks.
Export to PPT
Pairwise comparisons were then made to see which pairs were found to have a statistically significant difference. There is a statistically significant difference (P < 0.05) between 0 h with 1 h, 2 h, 3 h, 4 h, 5 h, 7 h, and 8 h. Specifically, the median at 0 h is significantly lower than at 1 h, 2 h, 3 h, 4 h, 5 h, 7 h, and 8 h.
Furthermore, there is a statistically significant difference (P < 0.05) between 2 h and 3 h with 1 h, 4 h, 5 h, 6 h, 7 h, and 8 h. Specifically, the median at 2 h and 3 h is significantly higher than at all other observation times [Table 1].
Table 1:: Statistically significant pairwise comparisons are reported.
Sample 1–Finally, we wanted to test whether there was a statistically significant difference between the values of the Group 2 (20 h protocol) compared to the Group 1 (12 h protocol) for the time periods 0 h, 24 h, 48 h, 9 days, and 14 days. For each time period, a non-parametric Wilcoxon paired sample test was performed to compare the two groups. There was no statistically significant difference (P > 0.050) between the 20 h protocol versus the 8 h protocol in all time periods analyzed [Table 2].
Table 2:: The mean and the median Periotron values collected at 0 h, 24 h, 48 h, 9 days, 14 days are reported.
Mean Median Standard deviation P-value Group 2: 0 h 9 9 5 0.539 Group 1: 0 h 8 8 4 Group 2: 24 h 25 29 15 0.833 Group 1: 24 h 27 27 6 Group 2: 48 h 27 21 16 0.445 Group 1: 48 h 32 30 15 Group 2: 9 days 26 17 19 0.475 Group 1: 9 days 33 42 20 Group 2: 14 days 24 21 15 0.721 Group 1: 14 days 27 16 20The overlapping of the FA points of the canines, first and second bicuspids between 0 h and 14 days, was performed using Geomagic X Control Software [Figure 2]. For each time period, a non-parametric Wilcoxon paired sample test was performed to compare the two Groups for each tooth considered. No significant differences in linear movements (mm) were found for all treated teeth between the 20 h and 8 h hemi-arches (P > 0.05) [Table 3].
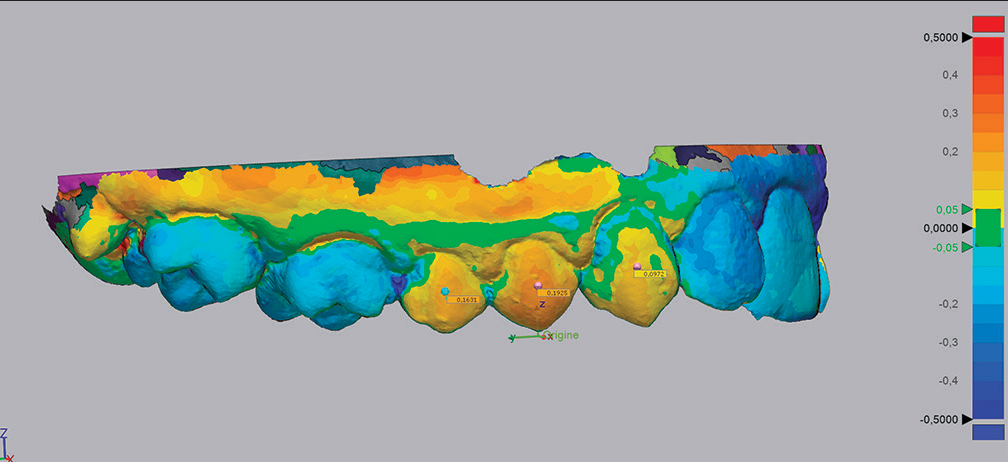
Figure 2:: Best-fit alignment of dental casts at 0 h and 14 days using Geomagic X Control software (3D Systems Inc, Rock Hill, SC).
Export to PPT
Table 3:: The mean and median Geomagic values of the distance between the FA points at 0 h and 14 days were collected.
Mean Median Standard deviation P-value Group 2: Canine 0.0525 0.0267 0.0552 0.208 Group 1: Canine 0.0256 0.0101 0.0309 Group 2: I Premolar 0.1533 0.1318 0.0919 0.285 Group 1: I Premolar 0.1146 0.1045 0.0552 Group 2: II Premolar 0.1287 0.1127 0.0497 0.445 Group 1: II Premolar 0.1124 0.1117 0.0478 DISCUSSIONOrthodontic forces can be classified according to the decay curve as continuous and intermittent; Forces are defined continuous when they are maintained at least partially in the period between visits while intermittent when they are intermittently reduced to zero simultaneously with the removal of the device.
As Proffit states, tooth movement is induced by orthodontic force application and subsequent inflammation at the level of the PDL.[1]
Within intermittent forces devices, Cervinara et al.[9] have reported that the mean force delivered by clear aligners when a crown inclination movement is planned ranges between 13 N and 27 N.
Given their widespread use, literature extensively studied the extent of inflammation both quantitatively and qualitatively resulting from their use.
In this regard, Castroflorio using the Periotron for quantitative analysis and cytokine-specific microbiological tests for qualitative analysis assessed the inflammatory process resulting from the use of aligners.[8]
Some specific biomarkers in samplings such as GCF or saliva can be useful to decide the precise force and duration that should be used to accelerate the tooth movement and avoid side effects.
In this study, however, the main objective was to find out whether it was possible to correlate the amount of crevicular fluid with ongoing inflammation and consequently with aligners orthodontic movement.
The results showed significant differences in the volume of the GCF samples between the test sites and control sites, in contrast to another study previously conducted in the literature, which reported no differences between sites with and without aligner on it.[10]
The Periotron scores also showed that the volume of GFC wearing the aligner at 0 h was always lower than at later times. This finding was a further confirmation of the state of inflammation that was generated once orthodontic force has been applied.
Having said that, our aim was to determine whether, with different protocols of aligner use, the state of inflammation remained unchanged.
Using two different aligner protocols, one of 12 h use in one hemi-arch and one of 20 h use in the contralateral hemi-arch, it was found that GCF volumes at 14 days were not statistically different.
These results allowed us to compare different aligner usage protocols, which unlike previous studies did not vary in the days, the aligner was used but, in the number of hours, the aligner was worn by the patient in a set number of days (14 days).[5,11]
Regarding different protocols in the days of use, that is, 1-week activation versus 2-week activation period, the literature gave conflicting results. Bollen et al.[11] stated that the 2-week activation period resulted in greater success than the weekly change (37% vs. 21%), in contrast to AI-Nadawi et al.[5] who found no statistically significant differences with a 7-day protocol compared to a 14-day protocol, except for better accuracy in posterior movements.
On the other hand, with regard to protocols involving the same number of days, but different numbers of hours, the only results reported in the literature concerned studies performed on animals.
As the studies by Kameyama et al.[12] and Hayashi et al.[6] stated, in orthodontics, the less time a force is applied, the less movement is obtained.
In detail, by comparing two groups, one in which orthodontic force with the same magnitude (40 g) was applied 24 h/ day and one in which force was applied discontinuously for only 8 h/day, the total tooth displacement in the group with intermittent force was 73% compared with the other group.[6] Although the movement is less than with continuous force, the aim of future researches is to understand how many more days of intermittent force application are required to achieve the same tooth movement as with continuous force in fewer days.
In our study, comparing overlaps on the FA points of two hemiarches with different aligner use protocols (20 h vs. 12 h) at 14-day interval, there were no statistically significant differences in the teeth movements obtained.
This result is in agreement with the state of inflammation of the periodontium as confirmed by the Periotron values regarding the amount of GCF in both hemi arches, but further investigations are required to determine whether at longer intervals of fewer hours of aligner use lead to a less tooth displacement and especially by how much.
This is an aspect that needs to be investigated to be able to determine alternative aligner protocols for patients who are not willing to cooperate 22 h a day as usual.
Recent studies have confirmed that only 36% of patients showed full compliance, 38.3% fair compliance, and 25.7% poor compliance; therefore, a protocol with fewer hours of use could help in a better patient compliance.[13]
Future studies should aim to assess inflammation during clear aligner treatment not only from a quantitative but also from a qualitative point of view. Efforts should be made to evaluate whether the use of intermittent forces in different protocols may result in a different microbiological response at the crevicular sulcus.
CONCLUSIONThe amount of GCF assessed through Periotron 8000 increases statistically significantly from the moment forces are applied through clear aligners
The increase in the amount of GCF is unevenly distributed over the first 8 h of use; in particular, in the following pilot study, a peak increase in volume was found between 2 h and 3 h of use;
Finally, no differences were found between the extent of inflammation in terms of GCF volume and hours of intermittent force application (group 1 vs. group 2)
Considering the limitations of the following pilot study, it would appear that the GCF amount is directly related to the amount of movement obtained.
留言 (0)