
記住我


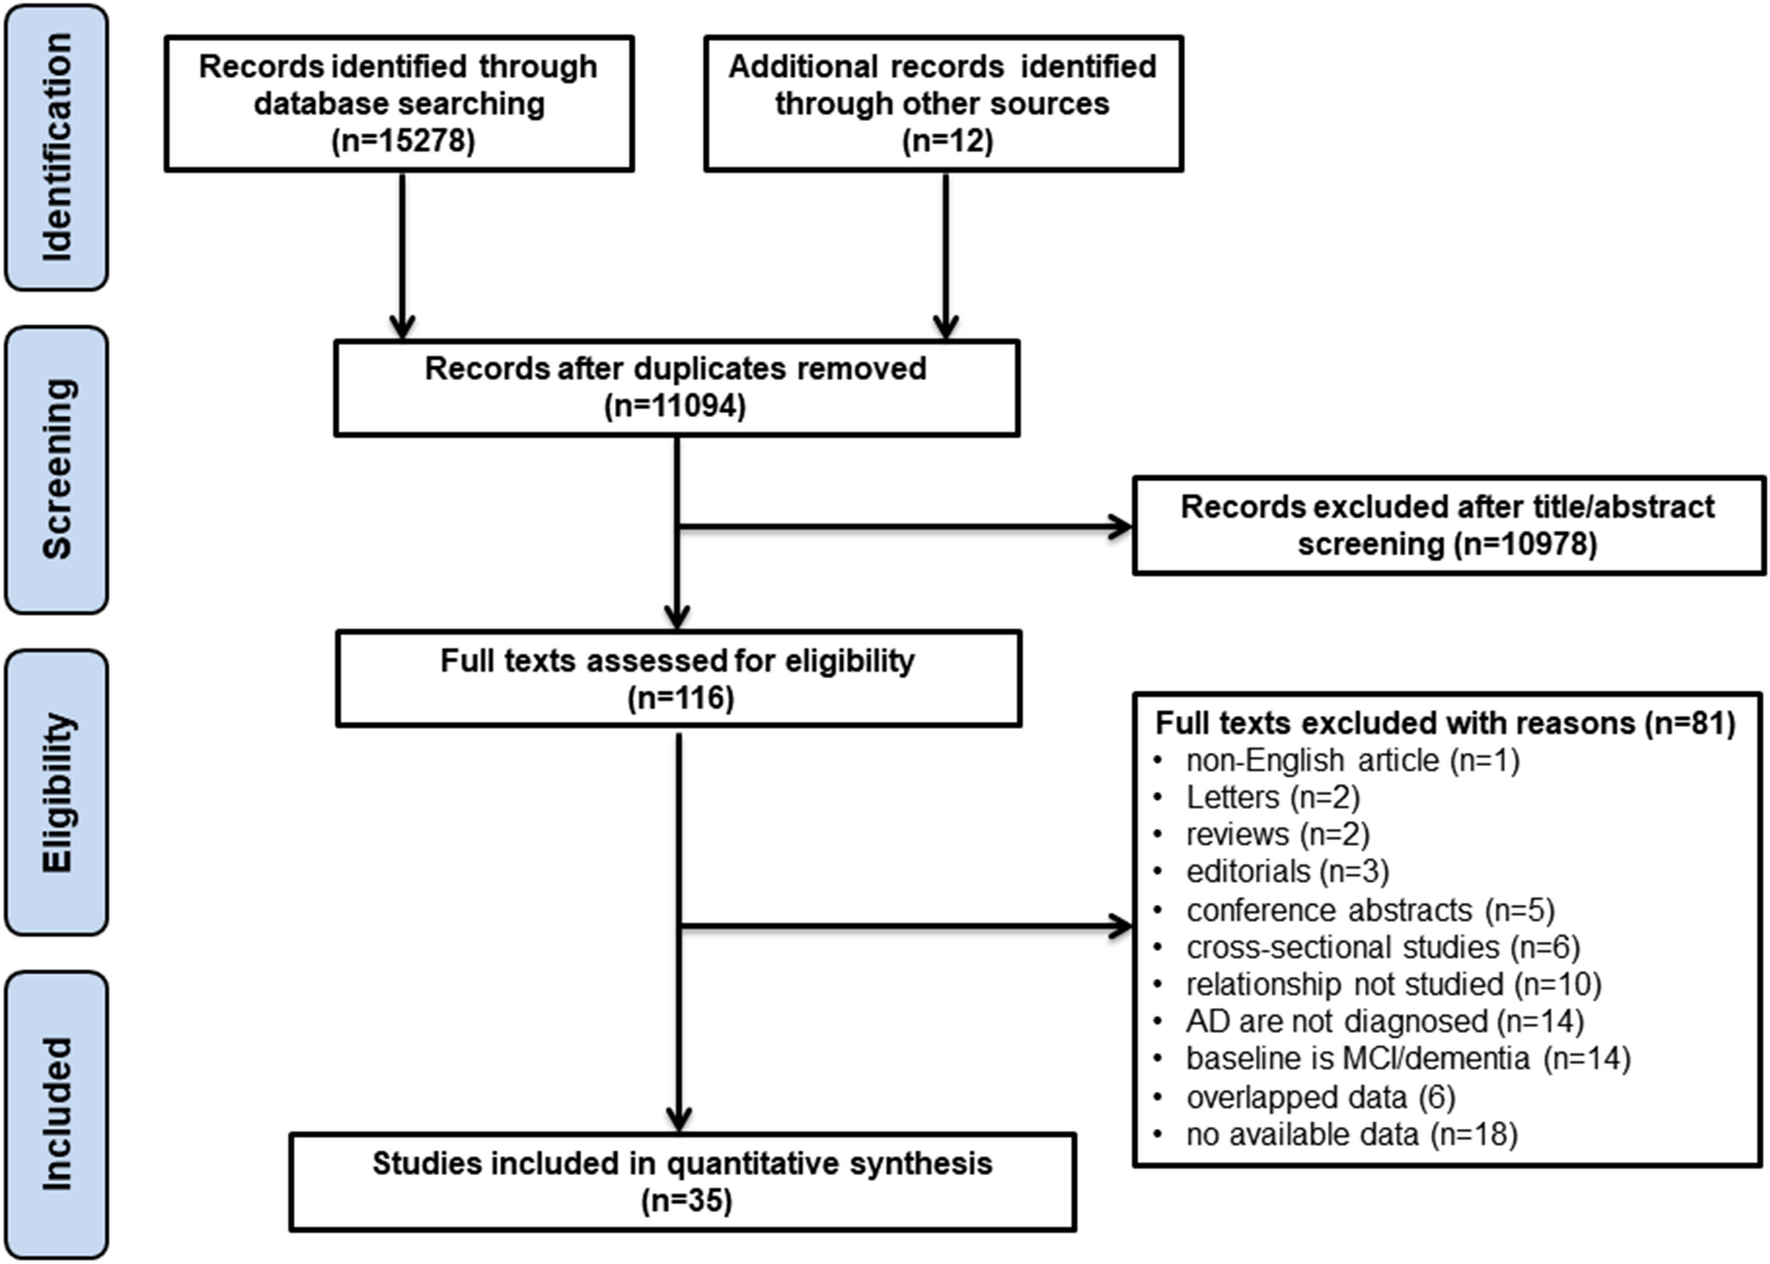
We identified 382 records by database searches. Seven studies reached final stage, providing IPD for 688 hospitalized COVID-19 cases [11, 12, 19,20,21, 29, 30]. The bias assessment did not reveal substantial selection or reporting bias with all studies being of high quality. A total of 669 participants referred to 7 centres (Oslo n = 26, Drammen n = 20, Milan n = 104, Uppsala n = 19, Brescia n = 332, Basel n = 26, Jacksonville n = 142) met the inclusion criteria and were included in the analysis (Fig. 2, 3, Supplementary Table 4).
Fig. 3
Location of the seven recruiting centres providing individual participant data (IPD). Country and city names and number of participants for which IPD were analyzed are displayed in boxes. Figure created with Biorender.com
Cohort descriptionDemographic, clinical, and laboratory features of included cohorts are reported in Table 1 and Supplementary Tables 4 and 5. Mean age at blood sampling was 66.2 ± 15.0 years (males n = 442, 68.1%), median disease duration from symptom onset to admission was 7 (IQR: 4–9) days, and from onset to biomarker assessment was 7 (IQR: 2–13) days. Hypertension and diabetes were described in 23.9% and 12.5% of cases with available data, respectively. COVID-19 diagnosis was confirmed by RT-PCR on nasopharyngeal swab in all but 5 cases (99.3%), who had a diagnosis of COVID-19 pneumonia based on typical radiological findings (in the early phase of the pandemic [20]). Included participants were mainly diagnosed with critical disease course (391 out of 431 with available classification, 90.7%), while 13 (3.0%) and 27 (6.3%) had moderate and severe disease, respectively. Elevated CRP and LDH values, a normal absolute neutrophil count, and a low absolute lymphocyte count were typical findings in COVID-19 (Table 1). Compared to the healthy control range (i.e., NfL Z score of 0), median NfL Z scores were higher in the included COVID-19 cases (median: 2.37; interquartile range, IQR: 1.13–3.06 referring to the 99th percentile in healthy controls, p < 0.001) (Supplementary Figs. 1 and 2). Moreover, 336/669 (50.2%) patients had NfL values above the 99th percentile of the corresponding healthy range (median: 99.2, IQR: 87.0–99.9, range: 0.01–100.0). The median hospitalization time was 14 days (IQR: 6—30). During the hospital stay, 74/233 subjects (31.8%) required MV with a median MV duration of 7.5 days (IQR: 3–16). Moreover, 316 out of 609 (51.9%) were admitted to the ICU. Finally, data on survival were available for all participants and death during hospitalization occurred in 180 cases (26.9%). In hospital, death was associated to COVID-19 itself or its related complications in all subjects Fig. 4.
Table 1 Demographic, clinical, and laboratory features of analysed participants with COVID-19Fig. 4
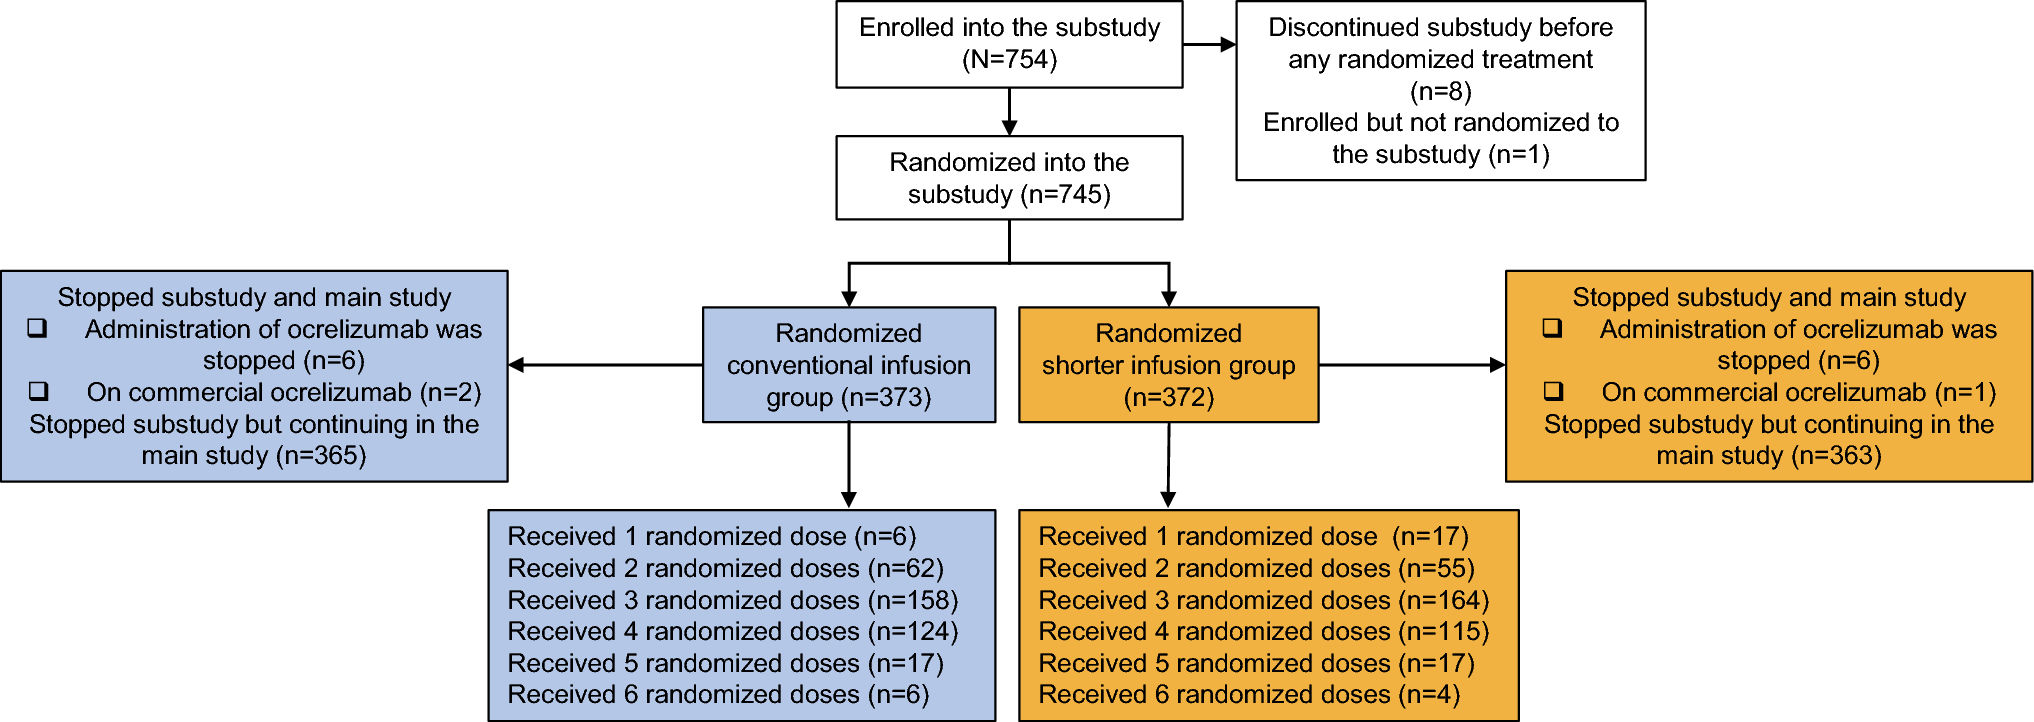
Summary receiver operating characteristic curve (SROC) for the diagnostic accuracy of NfL Z score for predicting death. Specificity 75%: optimal cut-off 2.73 (sensitivity 0.49, specificity 0.79), specificity 85%: optimal cut-off 3.06 (sensitivity 0.36, specificity 0.86), specificity 95%: optimal cut-off 4.01 (sensitivity 0.09, specificity 0.96). At maximized Youden-Index (green diamond): optimal cut-off 1.96 (sensitivity 0.78, specificity 0.59)
Associations between NfL, clinical, and laboratory variablesWe found significant associations between NfL Z scores (dependent variable) and most clinical and laboratory variables in univariable analyses (Table 2). NfL Z scores were significantly associated with COVID-19 severity with NfL Z scores approximately 1.4 unit higher in critical vs. moderate cases [estimate: 1.364 (95%CI: 0.686–2.042), p = 0.0001] and correlated with disease duration (time from onset to blood sampling) [estimate: 0.040 (95%CI: 0.024–0.056), p < 0.0001] (Table 2). Moreover, NfL Z scores were 0.3 units higher in participants with a history of hypertension [estimate: 0.347 (95%CI: 0.072–0.623), p = 0.014] and approximately 0.7 units higher in those with diabetes mellitus [estimate: 0.728 (95%CI: 0.380–1.077), p = 0.0001]. Among laboratory parameters, CRP [estimate: 0.002 (95%CI: 0.0006–0.004), p = 0.005], LDH [estimate: 0.001 (95%CI: 0.0003–0.002), p = 0.003], creatinine [estimate: 0.948 (95%CI: 0.613–1.283), p < 0.001], but not absolute lymphocyte and neutrophil counts, were related to NfL Z scores. Low values of PaO2/FiO2 ratio were associated with higher NfL Z scores [estimate: − 0.003 (− 0.004– − 0.001), p = 0.0003].
Table 2 Associations between NfL Z scores and other demographical, laboratory and clinical variables (univariate GLMM, centre as random effect).Associations between NfL and clinical outcome measuresIn the whole cohort, univariate GLMM analyses identified NfL Z score, sex, disease duration (days from symptoms onset to blood sampling), COVID-19 severity, diabetes mellitus, LDH and PaO2/FiO2 ratio as variables associated with ICU admission in COVID-19 cases (Table 3). Given the proportion of missing data, multivariable GLMMs for each outcome included all covariates that tested significant at univariate analyses, were available in at least 50% patients and were obtained for at least 2 centres. In the multivariable analysis, NfL Z score remained a significant independent predictor of ICU admission (Table 3). In detail, each unit increase in NfL Z score was associated with a 2.5-fold increase in the likelihood for ICU admission [OR: 2.50 (95%CI 1.17–5.37), p = 0.018], after correction for sex, COVID-19 severity, presence of diabetes mellitus, and disease duration.
Table 3 Associations between NfL Z score or other variables and ICU admission (recruiting centre as random effect), 609 patients with available outcome.When the need of MV was considered as the outcome, NfL Z score, sex, disease duration, and CRP resulted significant predictors in the univariate GLMM (Table 4). Similarly, in the multivariable GLMM, higher NfL Z score values were significantly associated with the need of MV (Table 4). After accounting for sex and disease duration, we found a 2.6-fold increase [OR: 2.63 (95%CI: 1.79–3.87), p < 0.0001] in the likelihood of need of MV with each unit increase in NfL Z score.
Table 4 Associations between NfL Z score or other variables and the need of mechanical ventilation (recruiting centre as random effect), 233 patients with available outcomeFurther, NfL Z score, age, days from onset to admission, the presence of diabetes mellitus, absolute lymphocyte count, CRP, LDH, creatinine and PaO2/FiO2 ratio were significantly associated with death at univariate GLMM (Table 5). After accounting for covariates, NfL Z score had still a significant negative association with survival (Table 5). Here, each unit increase in NfL Z score was associated with a 1.7-fold higher likelihood of death, after accounting for age and the presence of diabetes mellitus [OR: 1.70 (95%CI: 1.34–2.15), p < 0.0001].
Table 5 Associations between NfL Z score or other variables and death (recruiting centre as random effect), 669 patients with available outcome.ROC curve analysesSROCs for NfL Z score with mortality as primary outcome are showed in Fig. 3. After setting specificity at 75%, 85% and 95%, the optimal NfL Z score thresholds for death were 2.73 (sensitivity: 0.49, specificity: 0.79), 3.06 (sensitivity: 0.36, specificity: 0.86), and 4.01 (sensitivity: 0.09, specificity: 0.96), respectively. At maximized Youden Index, a cut-off of 1.96 yielded 78% sensitivity and 59% specificity for mortality (AUC: 0.74, 95%CI: 0.60–0.83). SROCs for need of MV (AUC: 0.80, 95%CI: 0.64–0.89) and ICU admission (AUC: 0.71, 95%CI: 0.57–0.80) showed also a fair predictive value of NfL Z score, with sensitivity being low at a priori set specificity boundaries (Supplementary Fig. 3). In the ROC analyses derived from univariate and multivariable GLMMs, the performance of NfL Z score to discriminate participants with poor from those with good outcome was good, yielding an AUC > 0.70 (Supplementary Table 6). The best accuracy was yielded by the multivariate GLMM including NfL Z score, sex, time from onset to blood sampling, COVID-19 severity and diabetes mellitus as variables (AUC: 0.92, 95%CI: 0.86–0.98) in the prediction of ICU admission (Supplementary Table 6).
留言 (0)