Cases
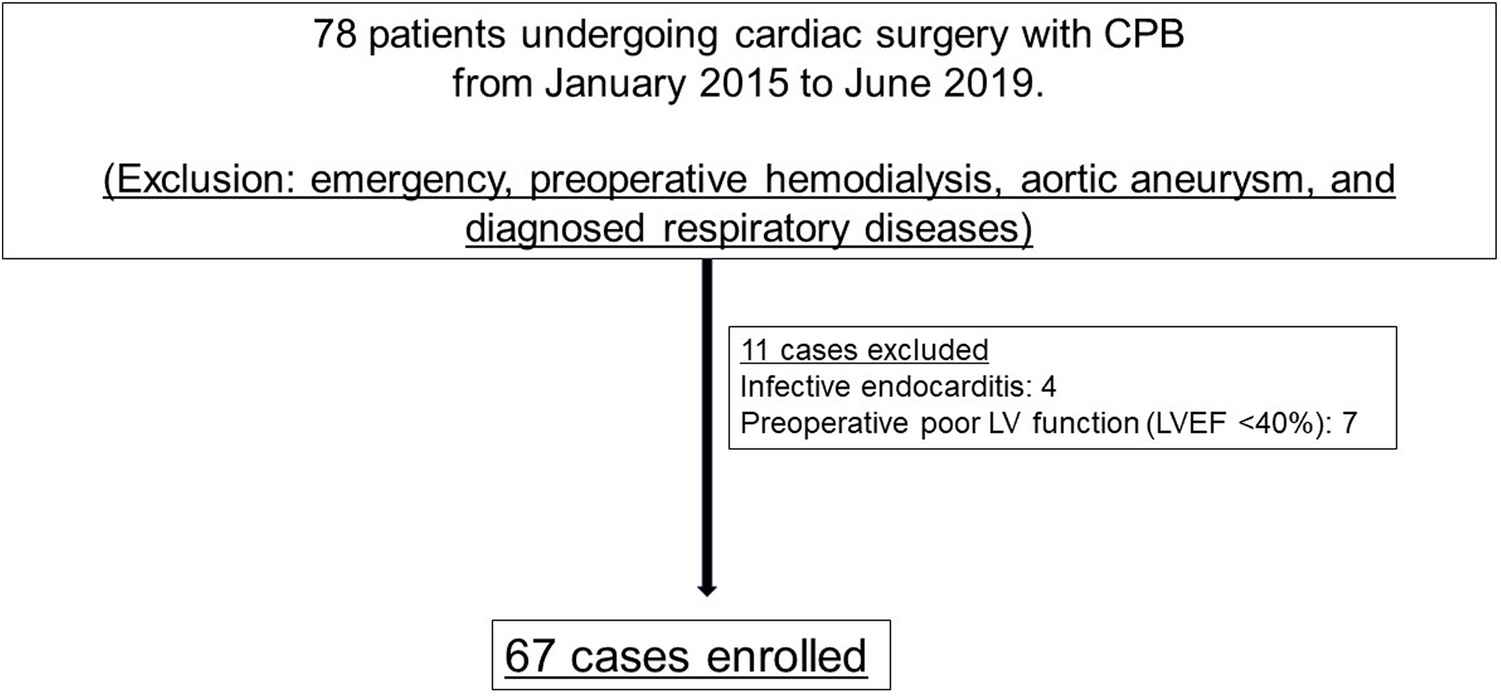
The present retrospective study was conducted with the approval of the Ethics Committee of Asahikawa Medical University Hospital (Approval number: 21048). Overall, 198 patients who underwent cardiovascular surgery with CPB between May 2019 and May 2021 at the Asahikawa Medical University hospital were included in the study. On the other hand, a study about the influence of haptoglobin administration protocol guided with free hemoglobin level on postoperative acute kidney injury in patients after cardiac surgery conducted by the department of anesthesiology in our hospital was done between April 2017 and November 2021 (Approval number: 19045). Because all patients included in the present study were also included in another study conducted by the anesthesiology, anesthesiologic and hemolysis management was determined by anesthesiologists. Moreover, patients on dialysis who had elevated NSE levels [7, 8] were excluded. Among the patients, 50 underwent aortic surgery with selective antegrade cerebral perfusion (SACP) and circulatory arrest, 15 underwent minimally invasive cardiac surgery (MICS) via right mini thoracotomy, 67 were valve cases, 40 were coronary artery bypass graft (CABG) cases, 16 were CABG + valve cases, and 10 were other cases.
The patients’ characteristics as well as perioperative and postoperative data were obtained from their medical records.
Cardiopulmonary bypass techniques
Before cannulation, the patients were administered with 300 IU/kg heparin, and CPB was initiated when activated clotting time was observed to be ≥ 480 s. The machines used in CPB were an S5 heart–lung machine (LivaNova, London, UK) and centrifugal pump (Revolution, LivaNova). For all the patients, a membrane oxygenator (CAPIOX FX-15 or FX-25, terumo; Affinity Fusion, Medtronic) was used with the open-circuit method. The priming volume was 800–1300 ml (VOLUVEN 6% solution for infusion, FRESENIUS KABI JAPAN; BICANATE Injection, Otsuka; mannitol injection 0.4 g/kg, Yoshindo). The patients were then administered with an additional 100 IU/kg of heparin. Blood was collected from all the patients using vacuum-assisted venous drainage with − 10 to − 30 mmHg of negative pressure. For the patients undergoing MICS, a negative pressure of − 60 mmHg was permitted. During the CPB, a mild hypothermia at 34 °C was induced. Pump flow was managed at 2.2–2.6 ml/min/m2, mixed venous oxygen saturation target was ≥ 75%, and perfusion pressure was maintained at 40–80 mmHg. The alpha-stat strategy was used to manage pH. Hematocrit levels were maintained at ≥ 21% during the CPB, and RBC transfusions were administered when it dipped below this level. A moderate hypothermia at 24–26 °C was induced for circulatory arrest. SACP was used for cerebroprotection with a perfusion rate of 10–13 ml/kg/min. The perfusion pressure was maintained at 30–50 mmHg. The residual blood was returned to the body whenever possible, and the remaining blood was returned using an autotranfusion system (XTRA, LivaNova).
Measurement of free hemoglobin and administration of haptoglobin preparations
Free hemoglobin (F-Hb) was measured using the Hemocue® Plasma/Low Hemoglobin system (HemoCue AB, Angelholm, Sweden). From each patient, 2 ml of blood was collected and centrifuged for 10 min at 3,652 rpm in a Kubota 2420 tabletop centrifuge. The resulting plasma was drawn into the specialized Hemocue® dropper and F-Hb was measured. F-Hb was measured every 60 min of the CPB and after the CPB ended.
Regarding dosage standards, 2000 and 4000 units of haptoglobin preparation (Hp) were administered if the F-Hb levels were ≥ 30 and ≥ 50 mg/dl, respectively. When applicable, these were administered every 60 min of the CPB. When the F-Hb level was measured again after the CPB was removed, Hp was administered according to the same criteria. There was no upper limit placed for Hp administration according to the protocol by anesthesiologists.
Examination method
To investigate the usefulness of NSE levels immediately following surgery in diagnosing brain damage, the postoperative NSE levels of the group without postoperative stroke was compared with those of the group with postoperative stroke. Furthermore, the F-Hb levels were compared between the two groups. The F-Hb levels used were those measured after the CPB ended. To investigate the relationship between hemolysis and NSE, the correlations between the NSE and F-Hb levels and between the NSE and lactate dehydrogenase (LDH) levels were evaluated. The F-Hb levels used were those measured after the CPB ended, and the LDH and NSE levels used were those measured when the patients returned to the ICU. Moreover, we investigated whether there was a correlation between the CPB time and NSE levels. To determine whether there was an association between NSE and hemolysis from the different surgical procedures, we broadly categorized the cases according to the procedures received by the patients and investigated the correlations. The cases were classified as follows: 50 aortic surgical cases, 15 MICS cases, and 133 other cases (67 valve cases, 40 CABG cases, 16 CABG + valve cases, and 10 other cases as follows 3 ventricular septal defect closure cases, 2 ventricular perforation closure cases, 2 left ventricular repair cases, 2 cardiac tumor resection cases and 1 pulmonary vein stenosis release case). The rate of F-Hb level increase was calculated with a linear regression comparing F-Hb (y, mg/dl) and CPB time (x, min) (the F-Hb level was measured every 60 min at 467 points).
Diagnosis of postoperative stroke
Patients presented neurological abnormality, e.g., severe delirium, convulsion, paralysis or coma were evaluated by computed tomography or magnetic resonance imaging. The diagnosis of stroke was done by neurologists by reference to such neurological imaging.
Statistical techniques
Patients’ background characteristics, intraoperative parameters, postoperative test values, etc. were expressed as mean ± standard deviation (SD). The two groups were compared using Mann–Whitney U test. Pearson correlation was used to determine the relationship between hemolysis and NSE, with a r of > 0.2– ≤ 0.4, 0.4– ≤ 0.7, and > 0.7 indicating weak, moderate, and strong correlations, respectively. The statistical software used was Pharmaco Basic Ver 16 (Scientist Press Co., Ltd, Tokyo, Japan).


留言 (0)