
記住我
Although Canada ranks highly among higher-income nations in terms of population-level dental health,1 significant problems persist. Certain oral health problems, such as dental caries (i.e., tooth decay) are common, and social inequities remain high.1,2 Surveillance infrastructure is a key part of the organized efforts of society to improve population dental health3,4 by providing a foundation for monitoring and evaluation. However, despite important data-related initiatives over the last 15 years,5 challenges remain surrounding the ability to monitor and evaluate programs and policies, such as community water fluoridation.6,7
Community water fluoridation is the controlled addition of a fluoride compound to municipal water systems to prevent tooth decay.8 It is 1 component of a multifactorial approach to preventing dental caries. The benefits of fluoridation are available to everyone living in the jurisdiction served by the water supply, and this public health policy has the potential for equitable impact.9
Historical estimates of fluoridation coverage in Canada have relied on subnational reporting systems, which vary across the provinces and territories in terms of the quality and completeness of available data.10 Further, aggregate national estimates may give little indication of provincial or municipal-level trends. For example, although national population exposure to fluoridation in Canada increased slightly between 2012 (37.4%) and 2017 (38.7%), that increase masks a decline in some provinces and territories, such as New Brunswick, Quebec and Alberta over the same timeframe. Likewise, population exposure to fluoridation increased in some provinces, such as Saskatchewan (from 36.7% in 2012 to 39.6% in 2017), even though several municipalities in the province discontinued fluoridation. Finally, fluoridation exposure at the population level (% population exposed) may differ from exposure at the municipality level (number of municipalities exposed), because of factors, such as population growth in areas with fluoridation and migration of people to fluoridated municipalities (either interprovincially or from other countries). Municipal-level exposure is relevant, because across Canada, the decision to fluoridate is determined by municipal governments (either via a municipal council decision or public vote).11 Overall, understanding of trends in fluoridation exposure is incomplete.
Our objective was to examine historical fluoridation exposure at the municipal and population levels in the province of Alberta, Canada from 1950 to 2018. An understanding of historical trends provides useful contextual information and sheds light on data-related challenges and limitations that could inform dental public health surveillance in jurisdictions across Alberta and, more broadly, Canada.
MethodsWe determined the total number of Alberta municipalities, each municipality’s annual population counts from 1950 to 2018, and historical fluoridation status for each municipality, including the start and end year (if applicable). This information is described in more detail below.
Annual Municipality and Population Counts
We acquired a list of Alberta municipalities and their annual populations from 2 main sources: Alberta Municipal Affairs12–18 and the Government of Canada.19 Alberta Municipal Affairs has publicly available official annual population figures for the province beginning in 1914, broken down by municipality type (see Table 1 for descriptions). We assigned a type code to each municipality on our list, for every year beginning with the official incorporation date. Municipalities that dissolved completely (e.g., were incorporated into a larger municipal district) were coded as “dissolved” and had an annual population count of 0 following the year of dissolution.
Table 1: Descriptions of municipality types in Alberta.Municipality type
Description
Note: Information is available from the Government of Alberta.20
City Population >10 000 people Governed by a mayor and an even number of councillors Established ward systems, with the same number of councillors in each ward First Nation Not part of any municipality Exclusive legislative authority on matters related to First Nation reserves rests with the federal government Improvement district Sparsely populated areas where tax base is not sufficient to support and finance a local government Province is responsible for all local government functions through Alberta Municipal Affairs Metis settlement Established under the Metis Settlements Act Municipal district Government in rural areas, such as farmland and unincorporated communities (e.g., hamlets) Council consists of 1 councillor per ward 1 councillor is elected as “reeve” by the council Special area Rural area in southeast Alberta Administered by a board of 4 people appointed by the lieutenant governor in council 3 exist in Alberta, but are referred to as 1 unit Specialized municipality Formed without resorting to special acts of the legislature Rural and urban communities often exist under a single municipal government Summer village Same provisions as a village (below), except elections and annual meetings are held in the summer Can no longer be created in Alberta Town Population ≥1000 May exceed 10 000 people unless change to city status is requested Governed by a mayor and councillors Size of council is set by municipal bylaw (currently 5–7) Village Population ≥300 Formed on request by 30% of electors in a community May apply for town status when the population reaches 1000 Council consists of 3 councillors, 1 of whom is the mayorMunicipality and Population-Level Exposure to Fluoridation
To estimate population-level fluoridation exposure, we determined the historical fluoridation status for each municipality, including start and end year, if applicable. We began with a partial list of existing Alberta municipalities and their fluoridation status drawn from various sources, including information compiled by the provincial ministry of Environment and Protected Areas (formerly Environment and Parks),21 a report prepared for Alberta Health Services22 and an ad hoc running list held by 1 of the authors. For the remaining municipalities, we consulted additional documents, including annual reports from the provincial department historically responsible for public health, and fluoridation materials prepared for past plebiscites in Calgary,23 and we contacted staff at water commission and water supply systems and municipalities. We attempted to find at least 2 corroborating sources to confirm fluoridation start and end dates. For each year, municipalities were assigned 1 of 3 codes: fluoridated, partly fluoridated (i.e., municipalities included multiple water supply systems) or non-fluoridated.
Despite significant effort to obtain information on naturally occurring fluoride (versus systems where fluoride is added by municipalities), we were unable to find consistent historic data on private water sources. In Alberta, approximately 90% of people receive drinking water via municipal water systems approved by Alberta Environment.24 The remainder, and most notably First Nations and rural communities, obtain water from private systems, such as wells, which can contain varied levels of naturally occurring fluoride. As many of these sources are not monitored by government, fluoride levels are often unknown,10 and these were excluded from the analysis.
Analysis
We counted the number of existing municipalities per year, overall and by municipality type. For each year, 1950–2018, we obtained municipal-level fluoridation counts by adding up the number of fluoridated and partly fluoridated municipalities, overall and by municipality type.
The proportion of the Alberta population exposed to fluoridation each year was computed based on annual population data and fluoridation status for each municipality. Specifically, we multiplied the annual population count for each municipality by “1” (fluoridated that year) or “0” (not fluoridated that year). For the small number of partly fluoridated communities (7 municipal districts and 1 specialized municipality), we used “0.5” as a multiplier, as we did not know the within-municipality exposure in these municipalities and estimated it at 50%. The sum of the resulting population values was divided by the total annual population count to compute the proportion of the Alberta population exposed to fluoridation each year from 1950 to 2018. We visually examined fluoridated municipality and population-level fluoridation exposure data (separately) over time to discern descriptive trends.
ResultsThere were several recurring challenges in acquiring complete and accurate information on municipal population and fluoridation status data. To contextualize findings and inform surveillance moving forward, it is important to describe these challenges.
Data Collection Challenges
For annual population data, as is typical for historical statistics, data were missing or unavailable for certain years, which varied between and within municipality types (Table 2). Complete annual population data were available for most municipalities (398 or 68.0%), i.e., population counts were available for every year of existence. Improvement districts, First Nations and Metis settlements had the highest proportion of missing population data, i.e., most municipalities in these categories were missing >25% of annual population counts.
For missing data on fluoridation status, we were unable to obtain any information on the fluoridation history for 51.6% (302) of the municipalities; missing data by municipality type (Table 2) ranged from 0 among the 18 cities to 100% of First Nation (n = 79) and Metis settlements (n = 8). In all these cases, we took the conservative approach of assuming these municipalities to be non-fluoridated. According to the Government of Canada, the only Indigenous communities with access to fluoridated water are those with a Municipal Transfer Agreement, allowing them to acquire water from a municipal water source.10 In Alberta, approximately 6.4% of the “on reserve” population has access to fluoridated water sources; however, this number may be an overestimate, as some Indigenous communities may be only partly fluoridated.10
Table 2: Municipalities, by type, missing annual population count data and fluoridation status.*Municipalities with missing population data
Municipalities with missing data on fluoridation status
*For 3 municipalities, we were unable to acquire any information on type, annual population or fluoridation status; these were excluded from the analysis.
Municipality type (no.)
No.
% of missing annual municipality population data range
No.
%
City (18) No missing data 17 0–24.6 0 — MissingMunicipality and Annual Population Counts in Alberta, 1950–2018
The number of municipalities per year ranged from a low of 316 in 1951 to a high of 438 in 1995 (Figure 1). From 1950 to 2018, there was a gradual increase in the number of towns, summer villages and, to a lesser extent, municipal districts and cities. Overall, villages were the most prevalent municipality type in Alberta from 1950 to 1997, but were then surpassed by towns, which in part reflects circumstances in which villages became towns, or dissolved into larger municipalities. There were 68 instances of changes in the type of municipality (e.g., a village becomes a town) and 71 municipalities dissolved between 1950 and 2018.
Figure 1: Number of Alberta municipalities, 1950–2018, by type.*
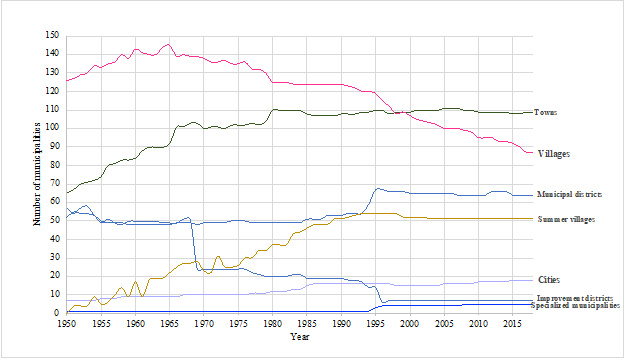
*Does not include special areas, as we were able to consistently obtain only 1 total annual population count for all special areas for most years.
Alberta’s population has increased over time, from 932 018 in 1950 to 1 794 057 in 1975, 2 930 836 in 2000 and, finally, 4 203 231 in 2018. Population growth has varied by municipality type. As shown in Table 3, the most dramatic change over time is the increasing proportion of the population living in cities, which nearly doubled from 1950 to 2018. The proportion living in towns (after 1975), villages and municipal districts has decreased.
Table 3: Population distribution in Alberta by municipality type, 1950–2018.Municipality type
Year
1950, %
1975, %
2000, %
2015, %
2018, %
City 35.4 58.8 64.6 67.9 68.4 First Nation 1.5 1.9 1.7 1.8 1.9 Improvement district 9.5 4.2 0.1 0.1 0.1 Metis settlement 0.1 0.1 0.2 0.1 0.1 Municipal district 35.0 15.6 14.1 11.4 11.3 Special area 1.3 0.4 0.2 0.1 0.1 Specialized municipality 0.7 2.3 4.5 6.0 5.5 Summer village <0.1 0.1 0.1 0.1 0.1 Town 11.1 14.2 13.0 11.6 11.5 Village 5.3 2.6 1.5 1.0 0.9Fluoridation Exposure: Population Level
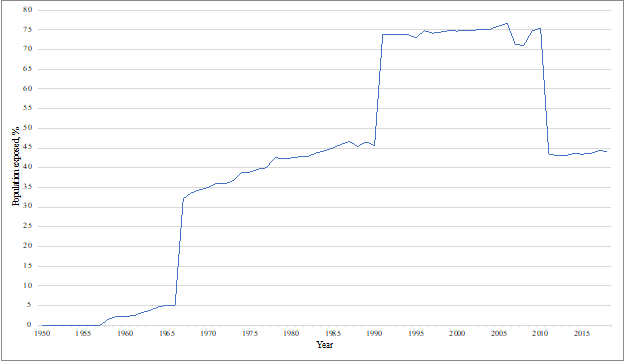
Population exposure to fluoridation in Alberta increased from 1950 to 2010 (Figure 2). Significant increases occurred in 1967 and 1991, reflecting the commencement of fluoridation in the large cities of Edmonton and Calgary, respectively. The first non-0 year of fluoridation exposure in Alberta was 1958, with a population exposure of 1.5%, reflecting the initiation of fluoridation in Fairview and Red Deer that year. Fluoridation exposure peaked at 75.5% in 2010, then declined to 43.4% reflecting Calgary’s 2011 decision to cease the practice. From 2011 to 2018, overall population exposure to fluoridation hovered around 43–45%. Examining this pattern by municipality type (not shown) indicates, not surprisingly, that it is dominated by trends in cities.
Figure 2: Population exposure to fluoridation in Alberta, 1950–2018.
Fluoridation Exposure: Municipality Level
As shown in Figure 3, the number of fluoridated municipalities generally increased over time from 2 (out of 402) in 1958 to 105 (out of 398) in 2018, except for small declines in 2007–2008 and 2010–2011.
Figure 3: Number of fluoridated municipalities in Alberta, 1950–2018.*
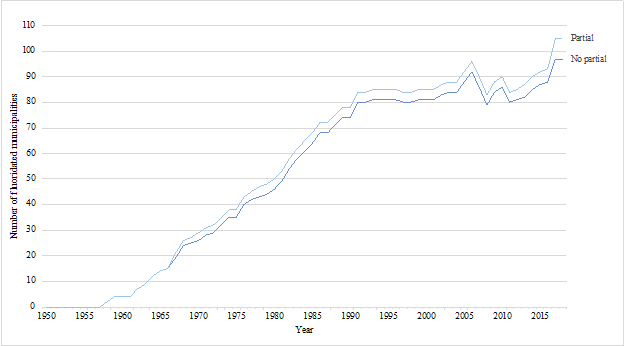
*From 1950 to 2018, 12 fluoridated (and 1 partly fluoridated) municipalities underwent a status change (e.g., Chestermere changed from summer village to town in 1993); 2 fluoridated municipalities dissolved into larger municipalities.
Note: Eight municipal districts and specialized municipalities were considered partly fluoridated, as multiple water supply systems existed in them. Graph shows results for both a crude assumption of 50% population fluoridation in these municipalities (Partial) and 0% coverage (No partial).
Broken down by municipality type (Figure 4), the increase in the number of fluoridated municipalities primarily reflects an increase in the number of fluoridated towns, particularly from 1958 (1/83) to 1994 (52/109), after which it plateaued and then declined in 2012 (45/109). The decline was partly a result of temporary cessation of fluoridation in Red Deer (2007–2009), which also affected surrounding communities receiving water from Red Deer, and municipalities that ended fluoridation altogether, such as Hanna in 2008, Grimshaw and Taber in 2011 and Okotoks in 2012. However, between 2012 and 2018, the number of fluoridated towns increased again (50/109). The numbers of fluoridated municipal districts and villages also increased over time, while the number of fluoridated cities gradually plateaued from 1995 (14/16) to 2018 (12/18).
Figure 4: Fluoridated municipalities in Alberta, 1950–2018, by municipality type.*
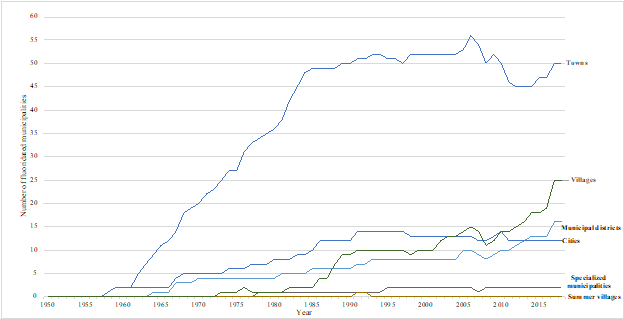
*Includes only types with at least 1 recorded fluoridated municipality between 1950 and 2018.
DiscussionOur data show that population exposure to fluoridation in Alberta increased between 1958 and 2010, decreased in 2011 and then leveled, consistent with other reports.10 These trends were heavily influenced by decisions in Calgary and Edmonton, the province’s 2 largest urban centres. Over time, there was an increase in the proportion of the Alberta population living in cities as opposed to towns, villages or municipal districts. Thus, the disproportionate influence of cities in estimates of population fluoridation coverage is likely to increase if these demographic trends continue. We observed a different trend in fluoridation exposure at the municipality level, with the number of fluoridated municipalities showing a more consistent increase over time.
Consistent with other Canadian reports,6,7,10 the availability of data on fluoridation status varied across municipalities in Alberta and, in some cases, was non-existent. Because fluoridation is an important element of a multifaceted approach to dental public health, it is important to be able to contextualize and quantify trends. Our findings point to the value of a centralized monitoring system to track changes in fluoridation exposure over time. One example of fluoridation surveillance strategy that could be applied in Alberta (and more broadly, Canada) is the Water Fluoridation Reporting System in the United States,25 which provides an online tool to help states manage water quality. It forms the basis for national surveillance reports on the proportion of citizens exposed to fluoridated drinking water; the tool monitors fluoridation status of water systems, communities served and which systems purchase or sell water to other systems. Continued surveillance of fluoridation status over time is a necessary step to achieving the key dental health initiatives outlined in Alberta’s Oral Health Action Plan,4 specifically the need to maintain accurate records and information on fluoridation and to provide surveillance data for the planning, implementation and evaluation of dental health policies.
The value of a fluoridation exposure surveillance system in Alberta will arguably increase with regionalization of water supply systems, i.e., multiple water systems in an area will be managed by a single, integrated entity.26 Increased regionalization has resulted in several communities now receiving water from larger municipalities (as opposed to a local water source) and fewer stand-alone water facilities.24 This trend could have interesting and under-recognized implications for establishing a fluoridation reporting system in Alberta. Specifically, regionalization has also resulted in the development and implementation of key initiatives to improve monitoring of data surrounding drinking water quality, safety and water treatment processes across the province.27 Municipal-level fluoridation status could be added as a component to existing municipal water surveillance system initiatives that are ongoing in Alberta.27,28
Strengths and Limitations
As noted, we encountered instances of incomplete or missing information about fluoridation status and annual population counts. To some extent, this is to be expected with historical quantitative research, reflecting changes over time in data collection capacity, methods and priorities. Incomplete data were particularly evident for First Nations communities and Metis settlements, thus illustrating data limitations that have elsewhere been identified as reflecting and contributing importantly to well-being and health equity of Indigenous populations.29-31 Based on available information, we were also unable to ascertain specific fluoridation decision-making circumstances for each municipality (e.g., municipal or public vote).
Another limitation is the lack of consistent historic data on water sources with naturally occurring levels of fluoride. Because of this exclusion, our estimates of population exposure to fluoride may be underestimated; however, the large majority (90%) of people in Alberta receive drinking water from municipal water systems, and the proportion of people receiving water from private sources with naturally occurring levels is relatively small. This limitation highlights the value of maintaining a registry of fluoride levels in all sources of drinking water, including sources with naturally occurring levels of fluoridation as more consistent data sources become available.
In terms of strengths, we highlight our careful and conservative approach to data collection and analysis. Moreover, our study generates new knowledge on population exposure to fluoridation, both at the population and municipal levels over time, thus historically contextualizing and illustrating the value of routine data on fluoridation in the province of Alberta.
THE AUTHORS

Ms. Fundytus is a PhD candidate, Department of Community Health Sciences, University of Calgary, Calgary, Alberta.

Ms. Thawer is an EdD candidate, Faculty of Education, Western University, London, Ontario, and former research associate, Department of Community Health Sciences, University of Calgary, Calgary, Alberta.

Dr. McLaren is a professor, Department of Community Health Sciences, University of Calgary, Calgary, Alberta.
Corresponding author: Ms. Katrina Fundytus, University of Calgary, TRW Building 3rd floor, 3280 Hospital Drive NW, Calgary AB T2N 1N4. Email: katrina.fundytus2@ucalgary.ca
This research was funded through Dr. McLaren’s Applied Public Health Chair award by the Canadian Institutes of Health Research, the Public Health Agency of Canada and Alberta Innovates–Health Solutions.
The authors have no declared financial interests.
This article has been peer reviewed.
References The state of oral health in Canada. Ottawa: Canadian Dental Association; 2017. Available: https://www.cda-adc.ca/stateoforalhealth/ Summary report on the findings of the oral health component of the Canadian Health Measures Survey, 2007–2009. Ottawa: Health Canada; 2010. Available: http://epe.lac-bac.gc.ca/100/200/301/hcan-scan/summary_report_findings-ef/H34-221-1-2010-eng.pdf Public health: a conceptual framework. Working paper. 2nd ed. Ottawa: Canadian Public Health Association; 2017. Available: https://www.cpha.ca/sites/default/files/uploads/policy/ph-framework/phcf_e.pdf Oral health action plan. Edmonton: Alberta Health Services; 2016. Available: https://www.albertahealthservices.ca/assets/info/oh/if-oh-action-plan.pdf Federal, Provincial and Territorial Dental Working Group. Reducing dental disease: a Canadian oral health framework. Ottawa: Canadian Association of Public Health Dentistry; 2012. Available: https://caphd.ca/wp-content/uploads/2022/06/FrameworkOctober-2014-FINAL-English.pdf McLaren L. Fluoridation exposure status based on location of data collection in the Canadian Health Measures Survey: is it valid? J Can Dent Assoc. 2016;82:g17. Community water fluoridation programs: a health technology assessment ¬— implementation issues analysis. Technology review no.15. Ottawa: Canadian Agency for Drugs and Technologies in Health; 2019. Available: https://www.cadth.ca/sites/default/files/pdf/feedback/DRAFT_HT0022-CWF_Implementation_Issues_Analysis_Report.pdf Position statement on community water fluoridation. Ottawa: Public Health Agency of Canada; 2018. Available: https://www.canada.ca/en/services/health/publications/healthy-living/fluoride-position-statement.html McLaren L, Emery JCH. Drinking water fluoridation and oral health inequities in Canadian children. Can J Public Health. 2012;103(7 S1):eS49–56. Public Health Capacity and Knowledge Management Unit. The state of community water fluoridation across Canada: 2017 report. Ottawa: Public Health Agency of Canada; 2017. Available: https://publications.gc.ca/collections/collection_2018/aspc-phac/HP35-97-2018-eng.pdf Rabb-Waytowich D. Water fluoridation in Canada: past and present. J Can Dent Assoc. 2009;75(6):451-4. Elizabeth Metis Settlement: land use inventory — planning for the future. Edmonton: Alberta Municipal Affairs, Planning Services Division, Planning Branch, Lakeland Unit; 1985. Available: https://archive.org/details/elizabethmetisse00albe/mode/2up Caslan Metis Settlement: land use planning inventory. Edmonton: Alberta Municipal Affairs; 1982. Available: https://archive.org/details/caslanmtissettle00albe_0/mode/2up Fishing Lake Metis Settlement: land use planning inventory. Edmonton: Alberta Municipal Affairs, Planning Services Division, Lakeland Unit; 1985. Available: https://archive.org/details/fishinglakemetis00kell/mode/2up McCully A, Seaton H. Gift Lake Metis Settlement: land use planning inventory. Calgary: Municipal Planning Section, Planning Branch, Alberta Municipal Affairs; 1982. Available: https://archive.org/details/giftlakemetisset00mccu_0/mode/2up McCully A, Seaton H. East Prairie Metis Settlement: land use planning inventory. Calgary: Municipal Planning Section, Planning Branch, Alberta Municipal Affairs; 1982. Available: https://archive.org/details/eastprairiemetis00mccu_0/mode/2up McCully A, Seaton H. Paddle Prairie Metis Settlement: land use planning inventory. Calgary: Municipal Planning Section, Planning Branch, Alberta Municipal Affairs; 1982. Available: https://archive.org/details/paddleprairiemet00mccu Municipal affairs population list. Edmonton: Municipal Affairs, Government of Alberta; 2021. Available: https://open.alberta.ca/publications/2368-7320 Annual population data for First Nation communities in the province of Alberta from 1950 to 1995. Ottawa: Indigenous and Northern Affairs Canada, Government of Canada; 2017. Urban municipal governments. Edmonton: Government of Alberta; 2022. Available: https://www.alberta.ca/types-of-municipalities-in-alberta.aspx#:~:text=Alberta%20is%20governed%20through%203,check%20the%20Municipal%20Officials%20Directory Alberta Environment (AENV) licensed or approved waterworks systems by Alberta Health Services zone (revised). Edmonton: Alberta Environment; 2016. 41 p. Patterson SK. A review of water fluoridation. Edmonton: Government of Alberta; 2010. Available: https://open.alberta.ca/dataset/3ed5f0aa-c0b0-4e94-af44-786cb08de929/resource/4dc10fa0-15ab-4b09-9728-ed49ea01365b/download/water-fluoridation-report-2010.pdf McLaren, L. Personal notes taken 2017 October–December. Dental/fluoridation materials, boxes 1-6, 8, 10-12. Calgary: Alberta Health Services Archives & Historic Collections; 2017. Alberta Environment. Facts about water in Alberta. Edmonton: Government of Alberta; 2010. Available: https://open.alberta.ca/dataset/1832cd36-bbeb-4997-ae81-67d3eedfcfe5/resource/18a9d64b-bad8-413a-8c63-77a548ec9d88/download/4888138-2010-facts-about-water-in-alberta-2010-12.pdf Water fluoridation reporting system. Atlanta: Centers for Disease Control and Prevention; 2022. Available: https://www.cdc.gov/fluoridation/data-tools/reporting-system.html Our water, our future: a conversation with Albertans. Edmonton: Environment and Sustainable Resource Development; 2013. Available: https://open.alberta.ca/dataset/7412417b-296e-4cee-bb10-6c032ff7eb2a/resource/6f58ccab-b9fb-4e6e-bfa8-cc0312c0697e/download/waterfuture-conversationalbertans-feb2013.pdf Water for life implementation review 2016 to 2019. Edmonton: Alberta Water Council; 2021. Available: https://www.awchome.ca/uploads/source/Water_for_Life_Implementation_Review_Report_FINAL.pdf The Alberta Environmental Public Health Information Network (AEPHIN) water quality. Edmonton: Government of Alberta; 2020. Available: http://aephin.alberta.ca/water/water-map.htm?simpleMode=1&selGeoFilter=CCS_key&mbTop=51.8306857&mbBot=50.9739944&mbLeft=-114.4281005&mbRight=-113.0548096&selectedChart=TDS&tabId=suitability&searchResult=CD+6+-+Calgary+(census) McKnight C. A call to action on First Nations health. Our health counts. Urban Aboriginal Database Research Project; n.d. Available: http://ourhealthcounts.ca Frequently asked questions. Edmonton: Alberta First Nations Information Governance Centre; n.d. Available: http://www.afnigc.ca/main/index.php?id=faq&content=faq Honouring the truth, reconciling for the future: summary of the final report of the Truth and Reconciliation Commission of Canada. Ottawa: Truth and Reconciliation Commission of Canada; 2015. Available: https://irsi.ubc.ca/sites/default/files/inline-files/Executive_Summary_English_Web.pdf
留言 (0)