


記住我
Schizophrenia is a common psychiatric disorder that is characterized by positive symptoms including auditory hallucinations, thought interference, and delusion as well as negative symptoms including avolition, anhedonia, and blunted effect. The 1-year and lifetime prevalence of schizophrenia are 1 and 1.4%, respectively (1). The current diagnosis of schizophrenia is mainly based on clinical interviews, and structured clinical assessment according to Diagnostic Statistical Manual (DSM) or International Classification of Disease (ICD) (2). There is a need to require neuroimaging biomarkers to improve the objectivity and accuracy rate of diagnosis. According to Kraguljac et al. (3), the goal of developing diagnostic biomarkers is to detect the presence of the disease state of schizophrenia and to establish objective schizophrenia signatures. According to a recent review, the potential neuroimaging biomarker devices for schizophrenia include reduction of the cortical gray matter volume, dopamine hyperactivity, and hippocampal hyperactivity (3). Such biomarkers can only be detected by magnetic resonance imaging (MRI) and positron emission tomography (PET). The average fees of MRI and PET scans are approximately 1,400 USD and 5,700 USD, respectively, and require special imaging facilities. These neuroimaging methods pose a challenge to developing countries. Furthermore, people staying in rural areas do not have access to MRI and PET scans. There is a requirement to develop, apply, and validate portable function neuroimaging as an adjunct diagnostic tool for schizophrenia in developing countries.
Functional near-infrared spectroscopy (fNIRS) is a practical and cost-effective neuroimaging solution for developing countries. This device adopts a similar mechanism as functional MRI (fMRI) and utilizes infrared light to map brain activation based on assessing the changes in oxygenated, and deoxygenated hemoglobin, thus assessing the cerebral blood flow of each region (4). fNIRS was found to be significantly correlated with fMRI blood oxygen level-dependent (BOLD) signal regarding the respective neuroanatomical regions (5). This device also was found to have higher temporal resolution but lower spatial resolution than fMRI and PET (6). As compared to fMRI, the cost of fNIRS imaging is close to zero dollar per assessment, and the respondents can be measured in a sitting position rather than supine. The latest fNIRS device is portable (see Figure 1) and may be transported to rural areas. The validity of fNIRS to detect a psychiatric disorder and differentiate from other psychiatric disorders was investigated in major depressive disorders (7), bipolar disorders (8), and borderline personality disorders (9). For fNIRS research in schizophrenia, Kumar et al. (10) reported a compensatory hyperactivation in the right frontopolar cortex in those with schizophrenia, which may stem from the underlying deficits in working memory. As those with schizophrenia were found to have a reduced profile of executive functions compared to healthy controls (11), cognitive tasks assessing executive function may differentiate people suffering from schizophrenia and healthy controls utilizing the fNIRS scan (12). Verbal fluency test (VFT) (13, 14) and Stroop Color-Word Test (SCWT) (15) are common neuropsychological paradigms to differentiate people with schizophrenia from healthy controls under fNIRS. The VFT was validated in non-English speaking Asian populations including Japanese (16, 17), Taiwanese (18, 19), and Chinese (20). Differences in performances during the VFT and SCWT were able to differentiate people with schizophrenia from other psychiatric illnesses (e.g., bipolar disorder) (21, 22).
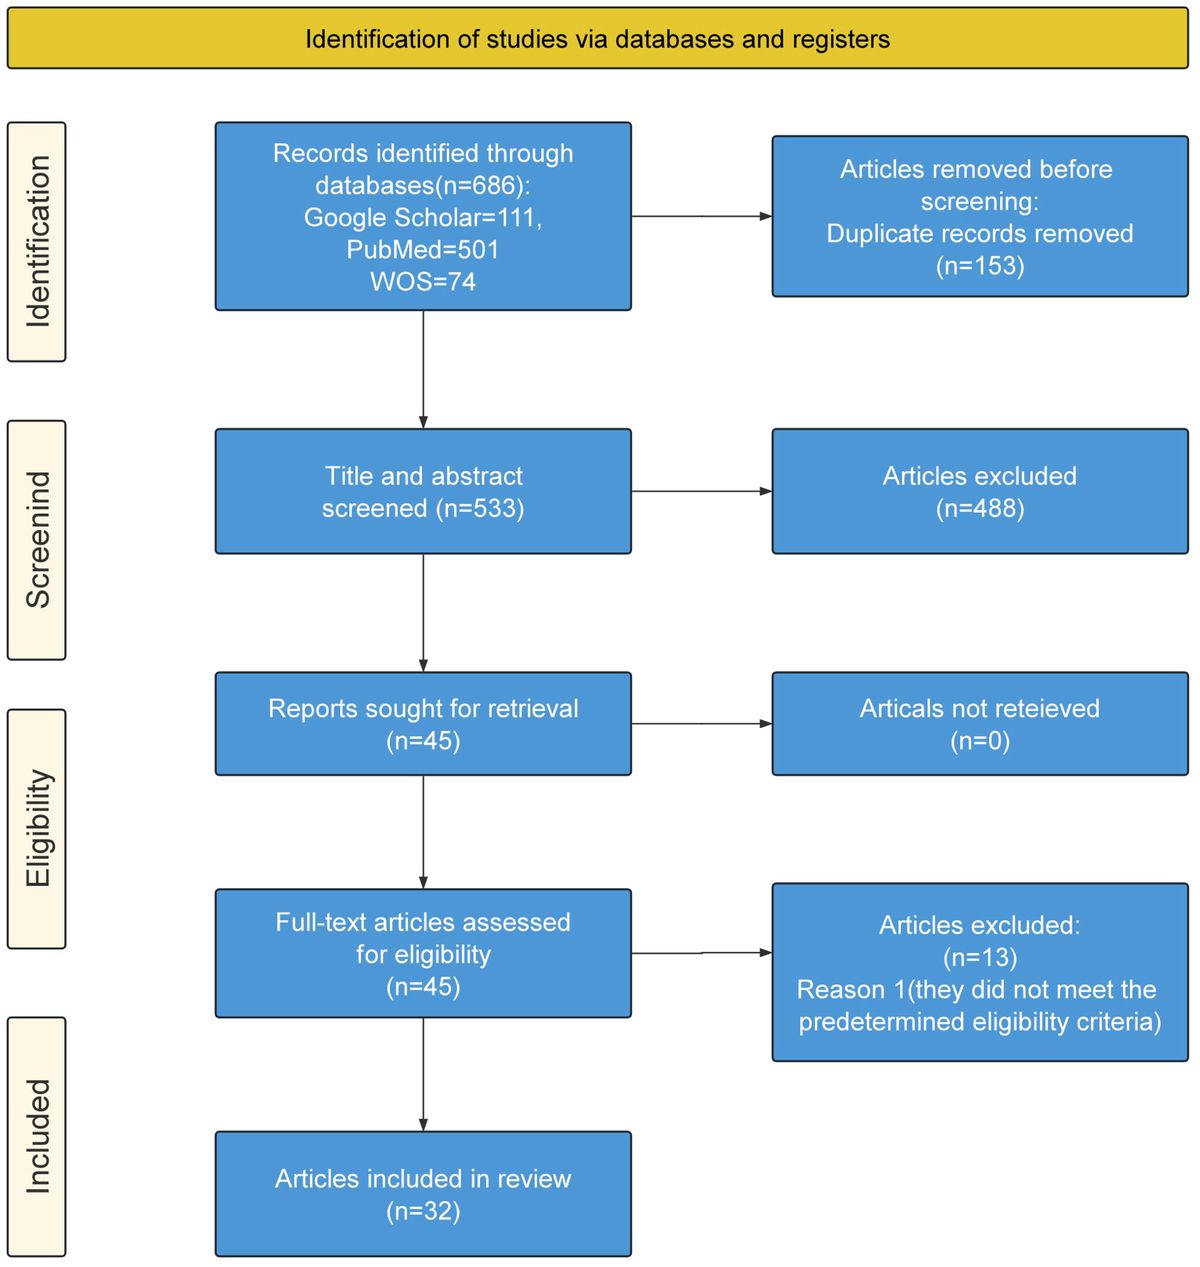
Figure 1. The paradigm of Stroop Color-Word Test (SCWT) adopted for Functional near-infrared spectroscopy (fNIRS).
This study aimed to validate the portable fNIRS device modality as an adjunct diagnostic and distinguishing tool for people with schizophrenia from healthy controls. The null hypothesis was that there were no differences in oxyhemoglobin (HbO2) concentration between patients with schizophrenia and healthy controls during the VFT and SCWT.
2. Materials and methods 2.1. Study setting and procedureA cross-sectional study was conducted from September 2020 to June 2022 at three medical facilities, including (1) Institute for Preventive Medicine and Public Health; (2) Mai Huong Daycare Psychiatric hospital; and (3) National Psychiatric Hospital No. 1. After providing the informed consent, participants were required to complete questionnaires on demographics, assessed by Positive and Negative Symptoms Scale (PANSS), and undergo the fNIRS scan.
2.2. Sample size and participantsOne hundred fifty-seven people with schizophrenia (n = 110, Age = 42.3 ± 12.2 years, 39 females) and healthy controls (n = 47, Age = 40.2 ± 11.1 years, 17 females) were recruited for this study. The two groups of participants were matched by age, and gender. People with schizophrenia who are independent diagnosed by a qualified psychiatrist at the Mai Huong Daytime Psychiatric Hospital (40 patients), and National Psychiatric Hospital No1, Vietnam (70 patients) based on the ICD-10 diagnostic criteria (23). For healthy control group (47 participants), they were recruited from the community. After providing informed consent to participate in this study, they were invited to Institute for Preventive Medicine and Public Health, Hanoi Medical University to conduct a psychiatry screening test by the qualified psychiatrist. Particularly, the Brief Psychiatric Rating Scale (BPRS) was applied as a psychiatry screening test to recruit people into the healthy control group, and only people who were not suffering from any psychiatric disorders were recruited into this group and conducted fNIRS measurement.
Positive and negative symptoms of people with schizophrenia were evaluated by using the PANSS scale (24). The mean antipsychotic dose was calculated using olanzapine equivalence based on the World Health Organization’s Collaborative Center for Drug Statistics Methodology. All antipsychotic doses were converted to 1 mg olanzapine equivalent (25). Exclusion criteria included: (i) intellectual disability, (ii) chronic medical diseases (e.g., cardiovascular, respiratory, liver, and kidney diseases), (iii) neurological disorders (e.g., stroke, Parkinson’s disease, dementia), and (iv) substance use disorder. For healthy controls, they should not suffer from any psychiatric disorders.
2.3. VariablesAlong with fNIRS measurement, information about demographic characteristics; and clinical characteristics (for patients with schizophrenia only) was also collected.
2.3.1. Demographic characteristics includedInformation about current age (years), gender (male/female), education level (secondary school or less/tertiary or higher) and family history of psychiatric disorders (yes/no).
2.3.2. Clinical characteristics (for patient group only)Included information such as age of illness (years), duration of illness (years), duration of untreated illness (months), pharmacotherapy, and PANSS score.
Positive and negative syndrome scale is considered the best-validated instrument for schizophrenia based on three domains: Positive, Negative, and General psychopathology (26). After the clinical interview with PANSS scale, the psychiatrist can assess the presence and severity of positive symptoms, negative symptoms, as well as general psychopathology among schizophrenia patients. This scale consisted of 30 items, with seven items regarding positive symptoms, seven items regarding negative symptoms, and sixteen items regarding general psychopathology symptoms. For each item, a seven-point Likert scale is utilized to assess the symptom severity (27). Finally, the total score of each domain is summed, with a higher score indicating a higher severity.
2.4. Computerized cognitive tasks 2.4.1. The computerized version of SCWTJ. R. Stroop introduced the Stroop test, which has become a standard method for assessing executive function, processing speed, cognitive flexibility, and selective attention (28, 29). The Stroop task’s cognitive mechanism is related to selective attention, which requires the respondents to inhibit cognitive interference between ink color and word (30). Recently, the Stroop task has been used in several fNIRS studies, including studies for people with schizophrenia (22, 31, 32).
In this study, the E-prime software (Psychology Software Tools Inc.) displayed the Vietnamese computerized version of the SCWT and recorded the responses from participants. Five blocks comprised of three 30 s rest periods that alternated with two 30 s task periods (see Figure 1). Firstly, there were two rows of words that appeared in computer screen, with the words in the top row was a word in colored which was random in one of four colors, including “red,” “blue,” “yellow,” and “green.” The bottom row showed two different words and one of which was the color of the word in the top row. The respondents needed to determine the color of the word in the top row and selected the answer from the remaining row. Before performing the test, participants rested for 30 s. Then the participants performed the task for 30 s. The total runtime to complete the SCWT was 125 s.
2.4.2. The verbal fluency test (VFT)The VFT was used to evaluate executive function, lexical access speed, and vocabulary (33). The VFT has been chosen from among the many neuropsychological tests utilized to detect neurocognitive deficits in people with major psychiatric disorders (34, 35) because this is an executive test with distinct differences in performance and neuroimaging data among types of major psychiatric disorders (36, 37). To date, several studies have utilized VFT on fNIRS measurement to investigate the differences in cortical activation patterns between people with psychiatric disorders and healthy controls (35, 38–40). The Vietnamese version of VFT was applied in this study, and this task included two main parts. During the first part (i.e., pre-task), respondents were asked to say “A,” “B,” “C,” “D,” and “E” continuously for 30 s by Vietnamese. For the next part (i.e., the VFT task), the respondents had 30 s to list as many items as possible under a random category (see Figure 2). The semantic fluency of Vietnamese was assessed. The total runtime was 185 s.
Figure 2. The paradigm for verbal fluency test (VFT) adopted for Functional near-infrared spectroscopy (fNIRS).
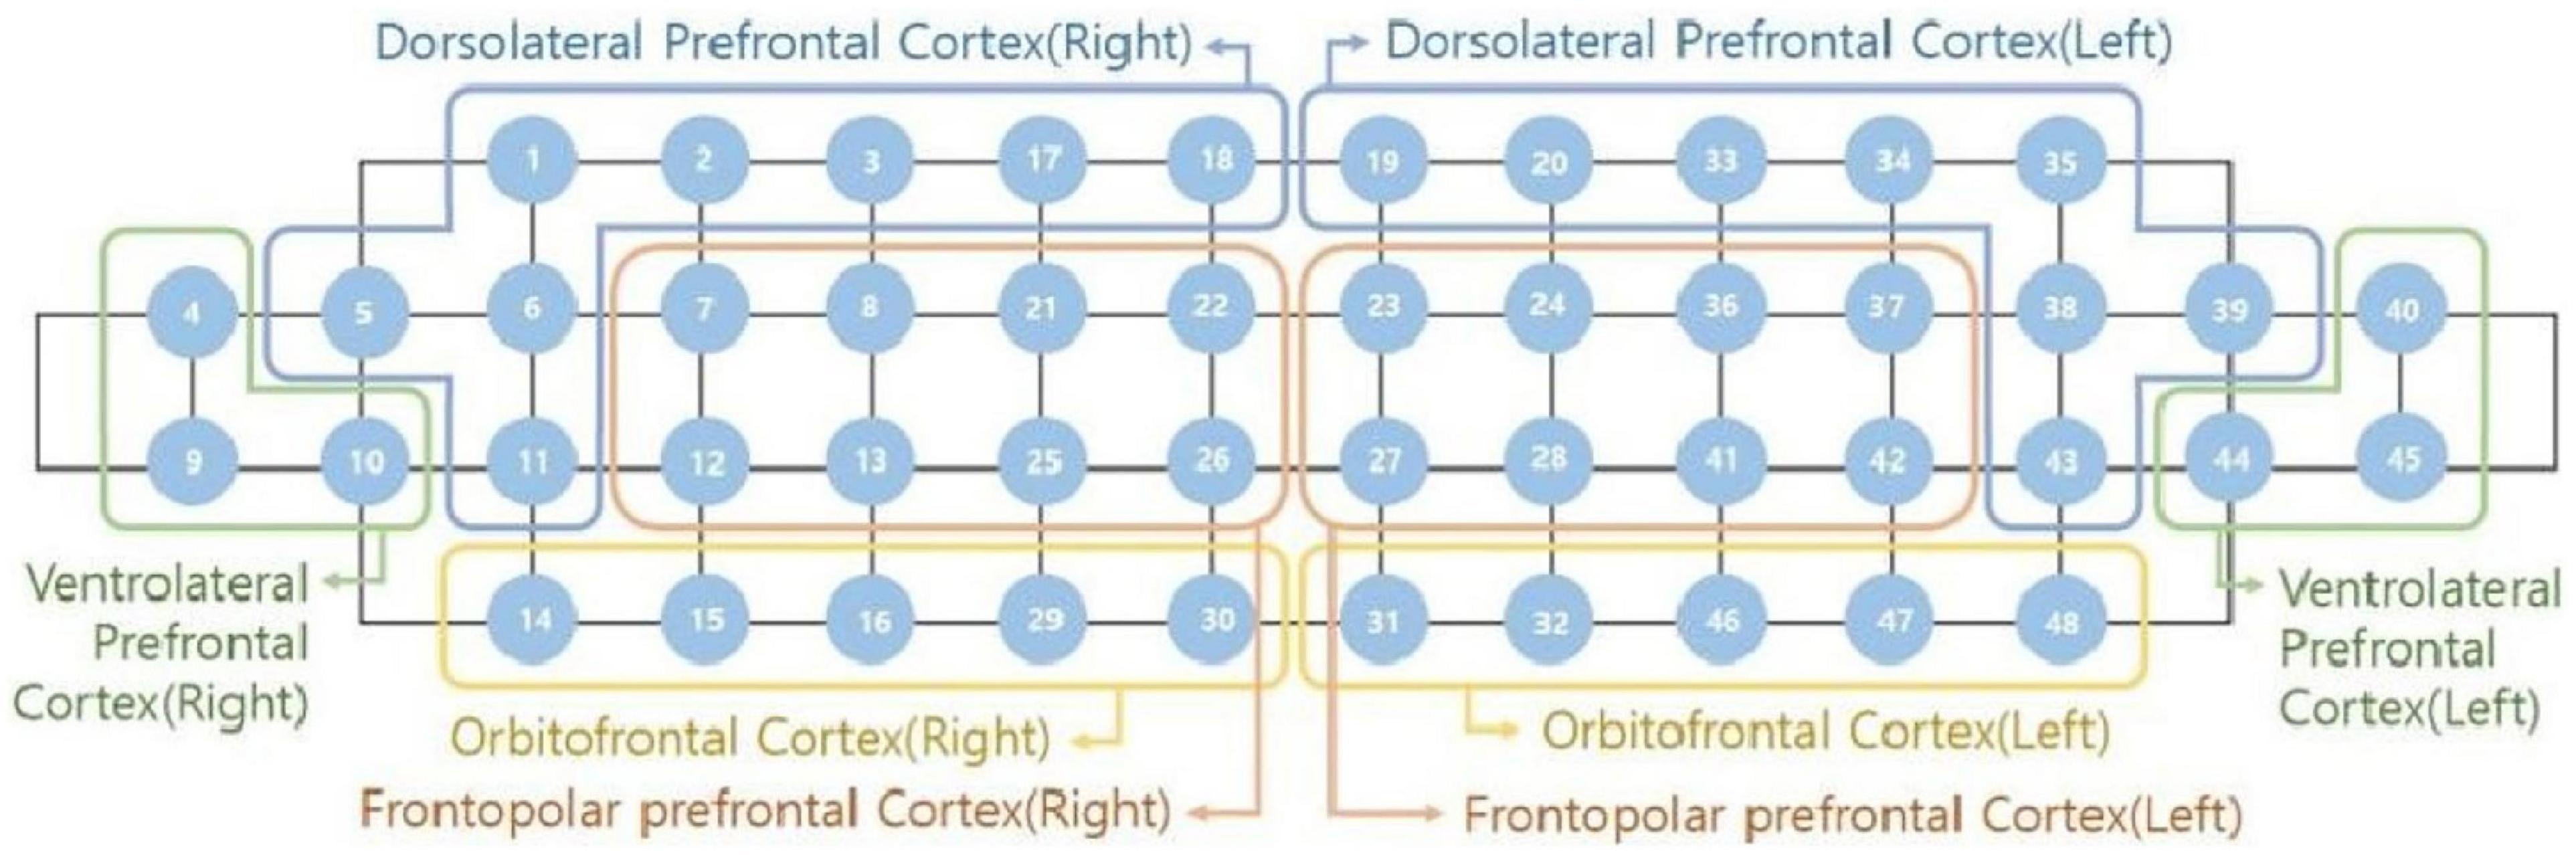
2.5. The fNIRS measurementFor the estimation of the HbO2 concentration, a portable fNIRS device (NIRSIT; OBELAB, Seoul, South Korea) with 48-channel and wavelengths 780 and 850 nm based on modified Beer–Lambert Law was utilized (41). This device included multi-distance source-detectors (24 dual-wavelength laser diodes and 32 photodetectors) that were separated by a distance of 1.5 cm. Forty-eight positions corresponding to 48 regions of the prefrontal cortex were examined by the source-detector pairs (Figure 3). To eliminate motion artifact and machine drift of physical contamination, high and low pass filters were used, with a frequency range of 0.005–0.1 Hz and a threshold of signal noise set at 30 dB (42). The average level of hemodynamic activation from −5 to 0 s before cognitive test were used as the baseline measurement. The response data were recorded 8.138 times per second. Finally, the average level of HbO2 was calculated as the mean level of HbO2 changes over the total runtime for each cognitive test. As Figure 3, the fNIRS device with the 48 channels were divided into eight subregions (43, 44), including the dorsolateral prefrontal cortex (right side and left side); the ventrolateral prefrontal cortex (right side and left side); the frontopolar prefrontal cortex (right side and left side); and the orbitofrontal cortex (right side and left side), and the mean HbO2 concentration in each Brodmann region was calculated according to the respective channels.
Figure 3. Location of 8 Brodmann neuroanatomical areas.
2.6. Data analysis and statistical analysesData analysis and visualization were performed using Stata 15.0 (Stata Corporation), and NIRSIT Analysis Toolbox v3.6.2. (OBELAB Inc.). Descriptive data were generated for healthy controls and people with schizophrenia. To compare the proportion between two groups of participants, the Chi-square and Fisher’s exact test were utilized. Differences in age between the healthy controls and people with schizophrenia were assessed by using the Wilcoxon rank-sum test (non-parametric method). The HbO2 levels between the rest period and task period were compared using the general linear model one level (GLM 1-Level) for healthy controls and people with schizophrenia. To compare the mean differences of HbO2 between the two groups, the general linear model two levels (GLM 2-Level) was utilized. The criterion for statistical significance was set at p < 0.05. We set contrast parameters between two among two groups, respectively, (healthy control vs. schizophrenia group). The one-way analysis of covariance (ANCOVA) was employed to compare mean HbO2 across these groups after adjusting for age, gender, and education.
In this study, the value of sensitivity, specificity, positive predictive value (PPV), and negative predictive value (NPV) were reported. Furthermore, the Receiver Operating Characteristic (ROC) curve and the area under the curve (AUC) are considered effective measures of accuracy has been explored with significant interpretations (45). This curve plays an important role in assessing the diagnostic ability of tests to distinguish the true state of individuals, determining the optimal cut-off values, and comparing two different diagnostic tests when they are performed on the same subject (45–47). In particular, ROC graphs were created based on the sensitivity and 1-specificity for all possible thresholds. In terms of AUC, rather than relying on a specific operational point, AUC summarizes the full position of the ROC curve (45, 48). The AUC is a useful and integrated measure of sensitivity and specificity that indicates the diagnostic test’s inherent validity (37). Sensitivity and specificity were transformed to Youden’s index (sensitivity + specificity–1) (49). Besides, AUC, PPV, and NPP, we selected the optimal cut-off point that maximized Youden’s index.
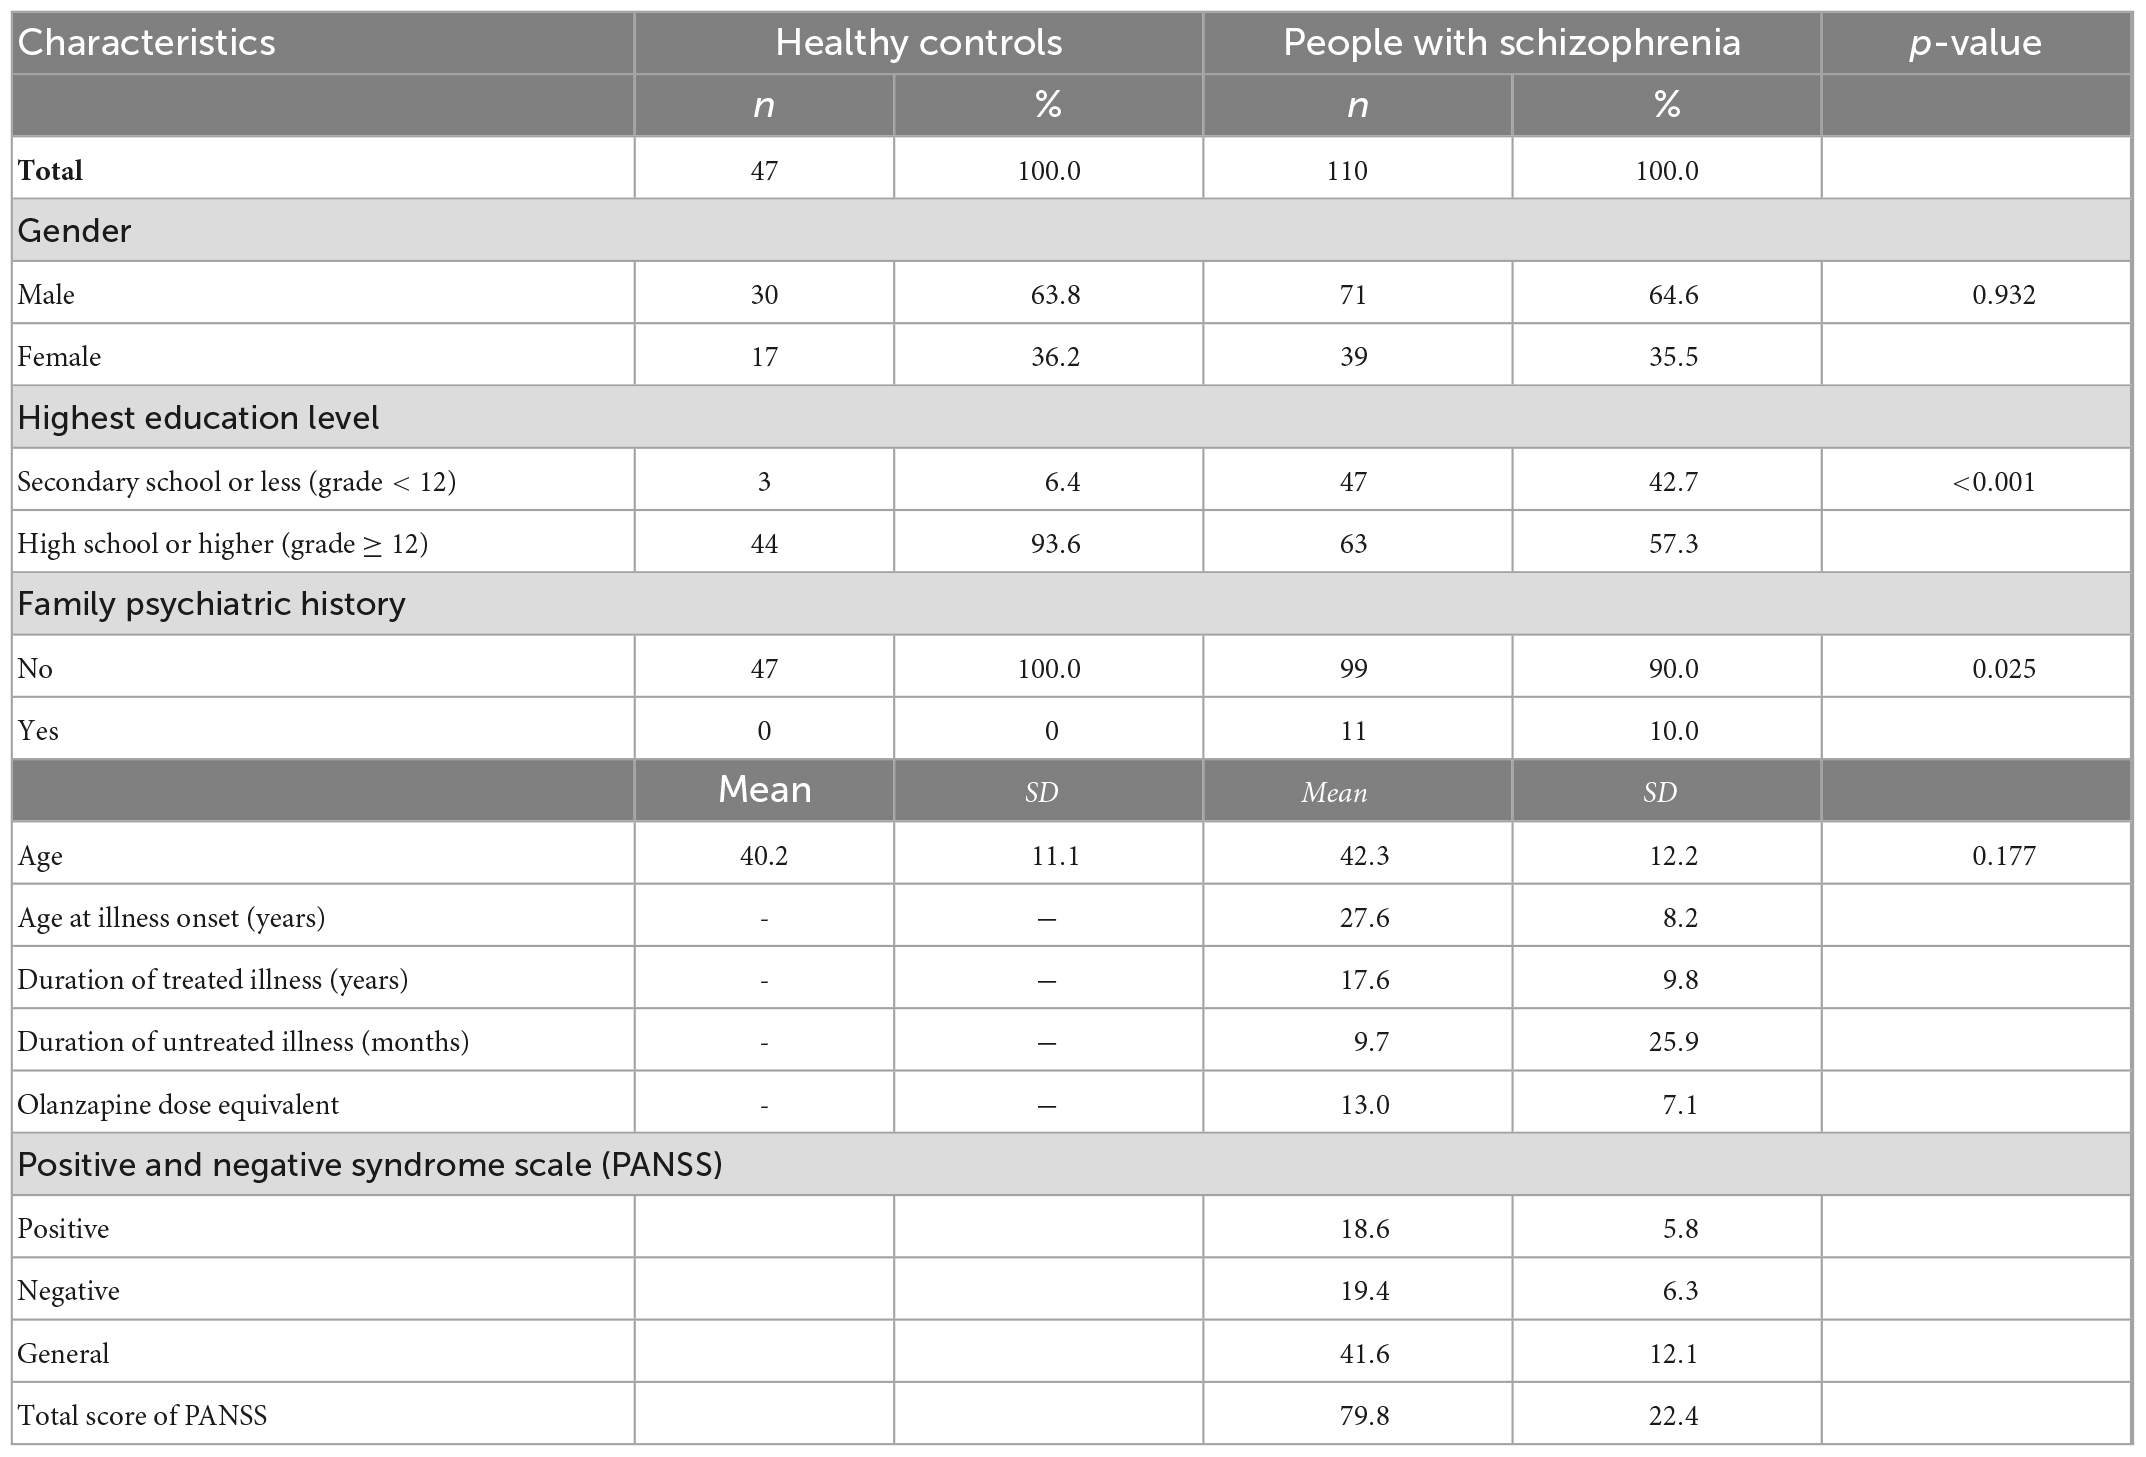
3. ResultsThe demographic characteristics and some clinical characteristics of the respondents are showed in Table 1. No significant differences between people with schizophrenia and healthy controls in terms of age (p = 0.177), and gender (p = 0.932). The majority of participants was male (65.5%, for healthy control group, and 64.4% for people with schizophrenia) were found. Most people with schizophrenia reported that they did not have any family psychiatric history with 90.0%. The mean age of healthy controls was 40.2 ± 11.1 years, while the mean age for schizophrenia was 42.3 ± 12.2 years. For people with schizophrenia, the mean age of onset of illness, duration of treated illness and duration of untreated illness were 27.6 ± 8.2 years, 17.6 ± 9.8 years, and 9.7 ± 25.9 months, respectively. The mean PANSS score was 79.8 ± 22.4, and the mean olanzapine equivalent dose for antipsychotic medications was 13.0 ± 7.1 mg.
Table 1. Characteristics of participants (n = 157).
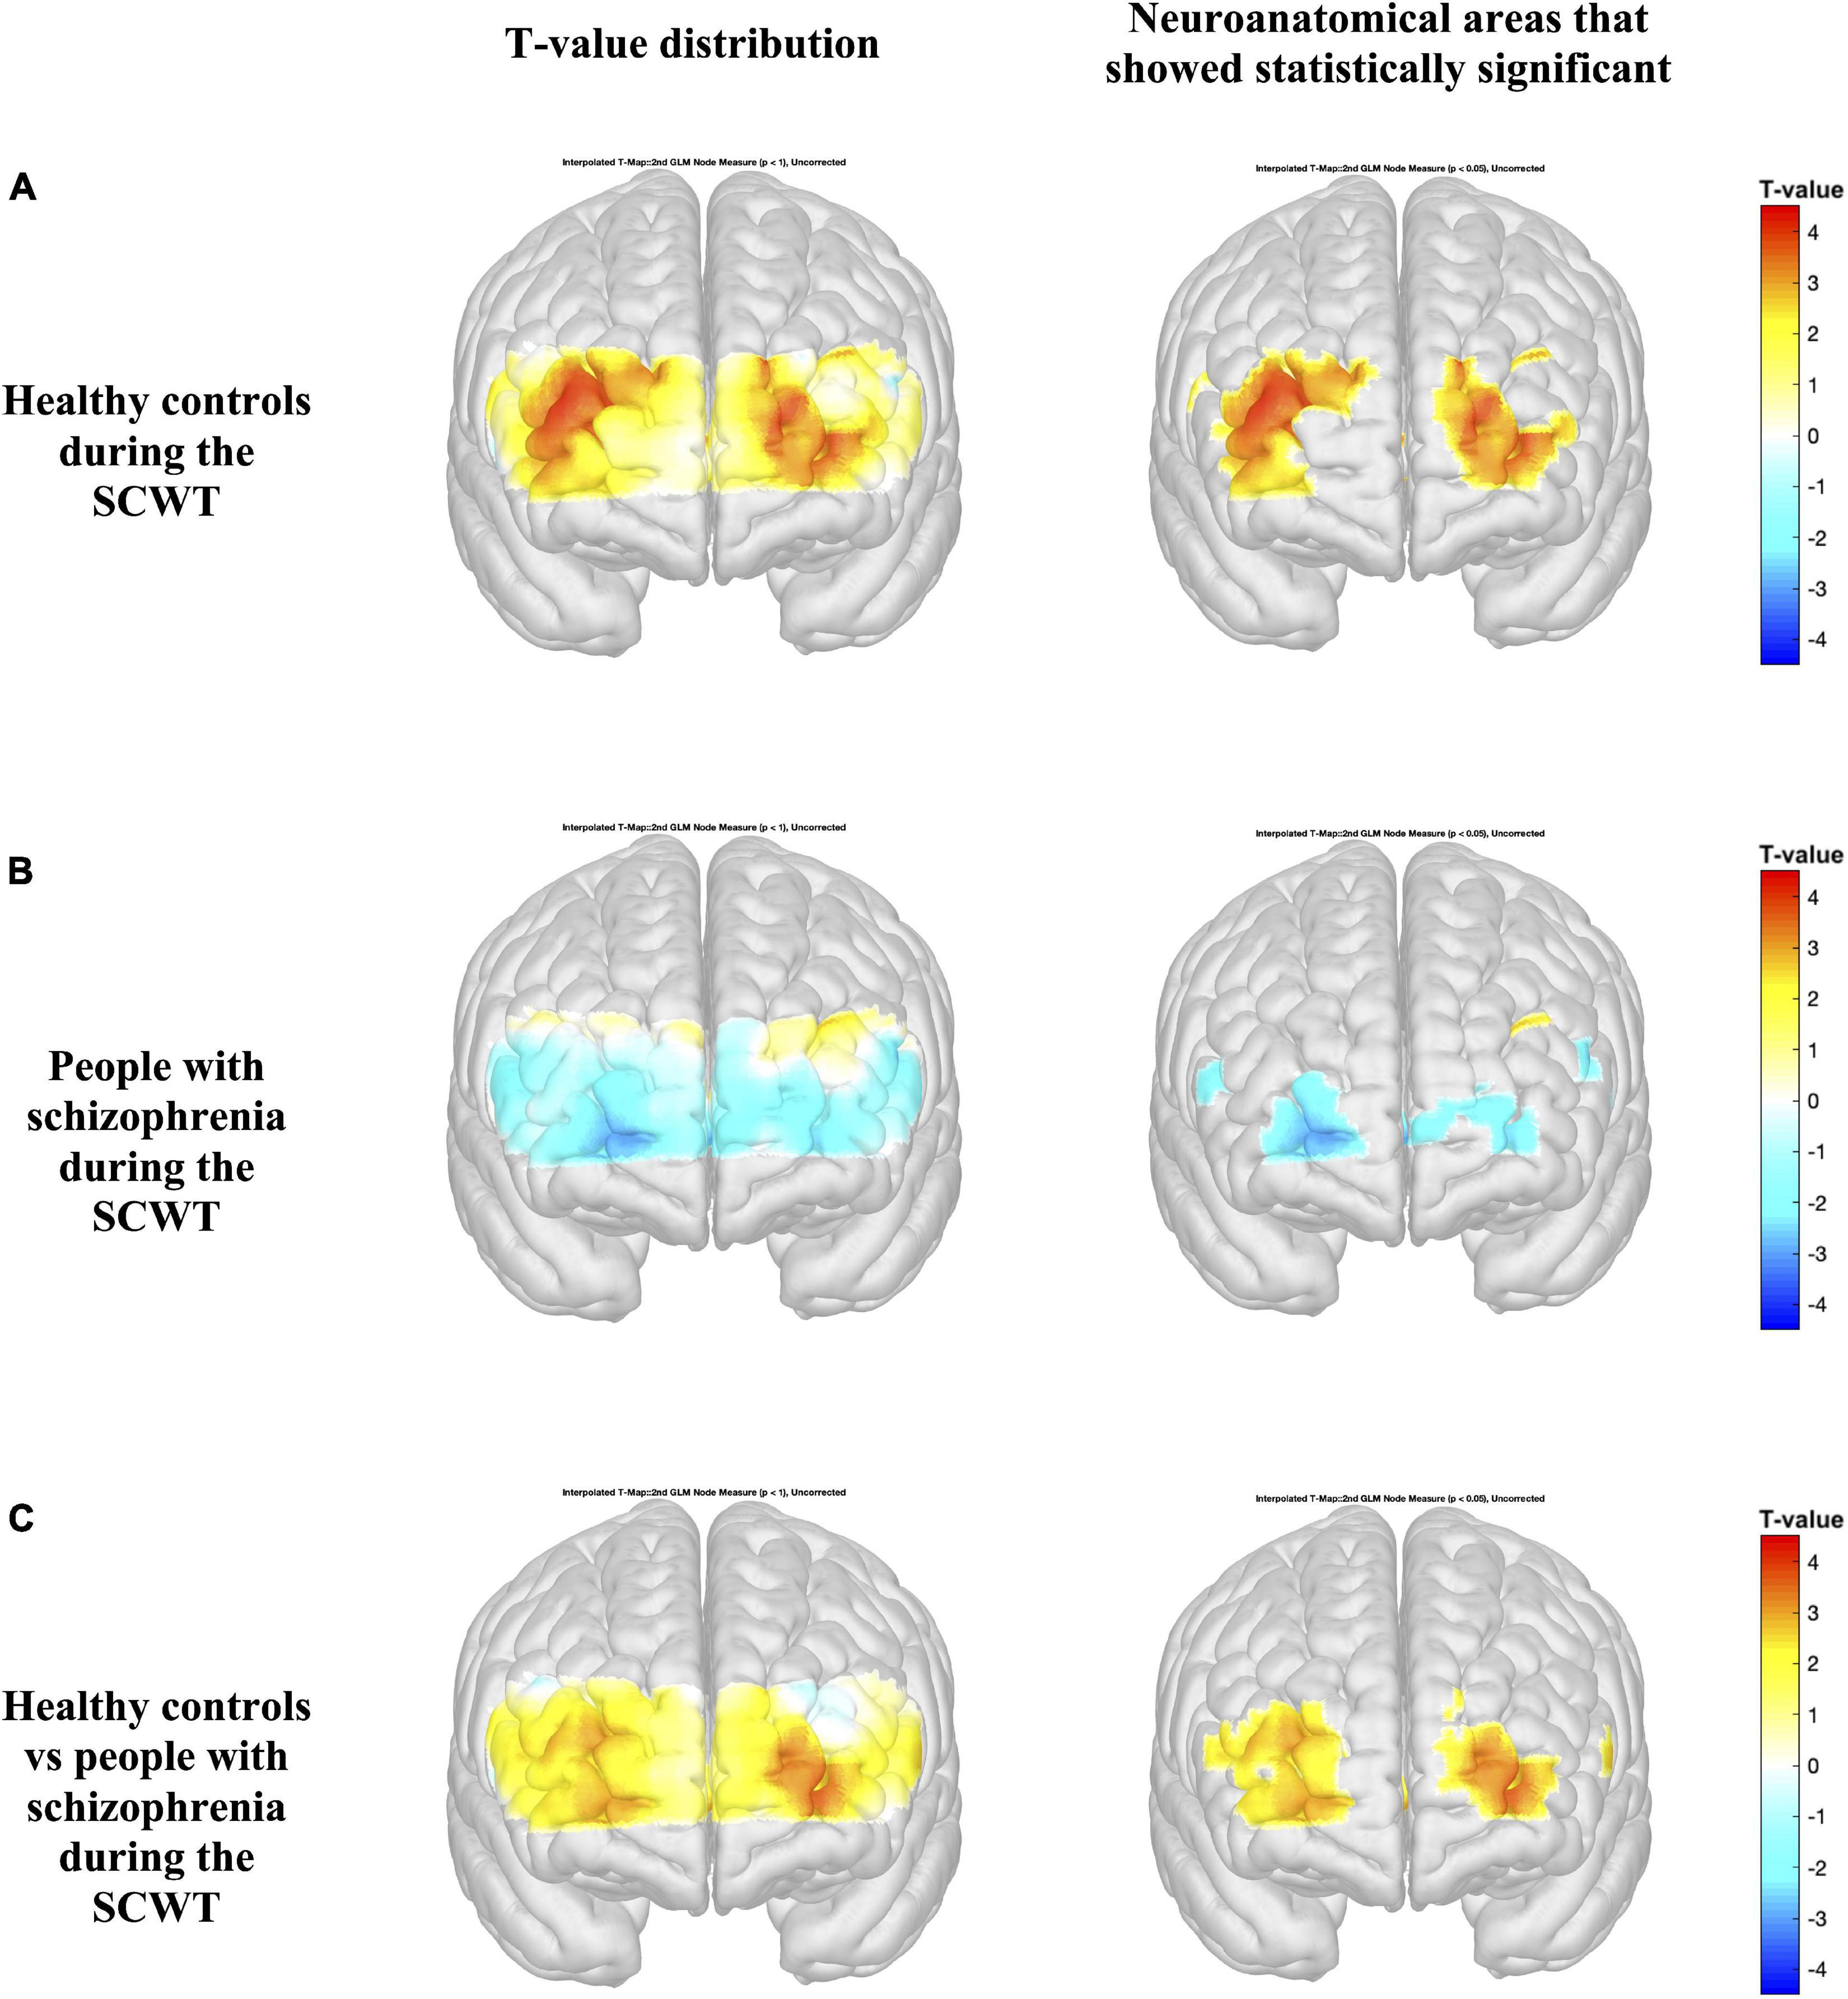
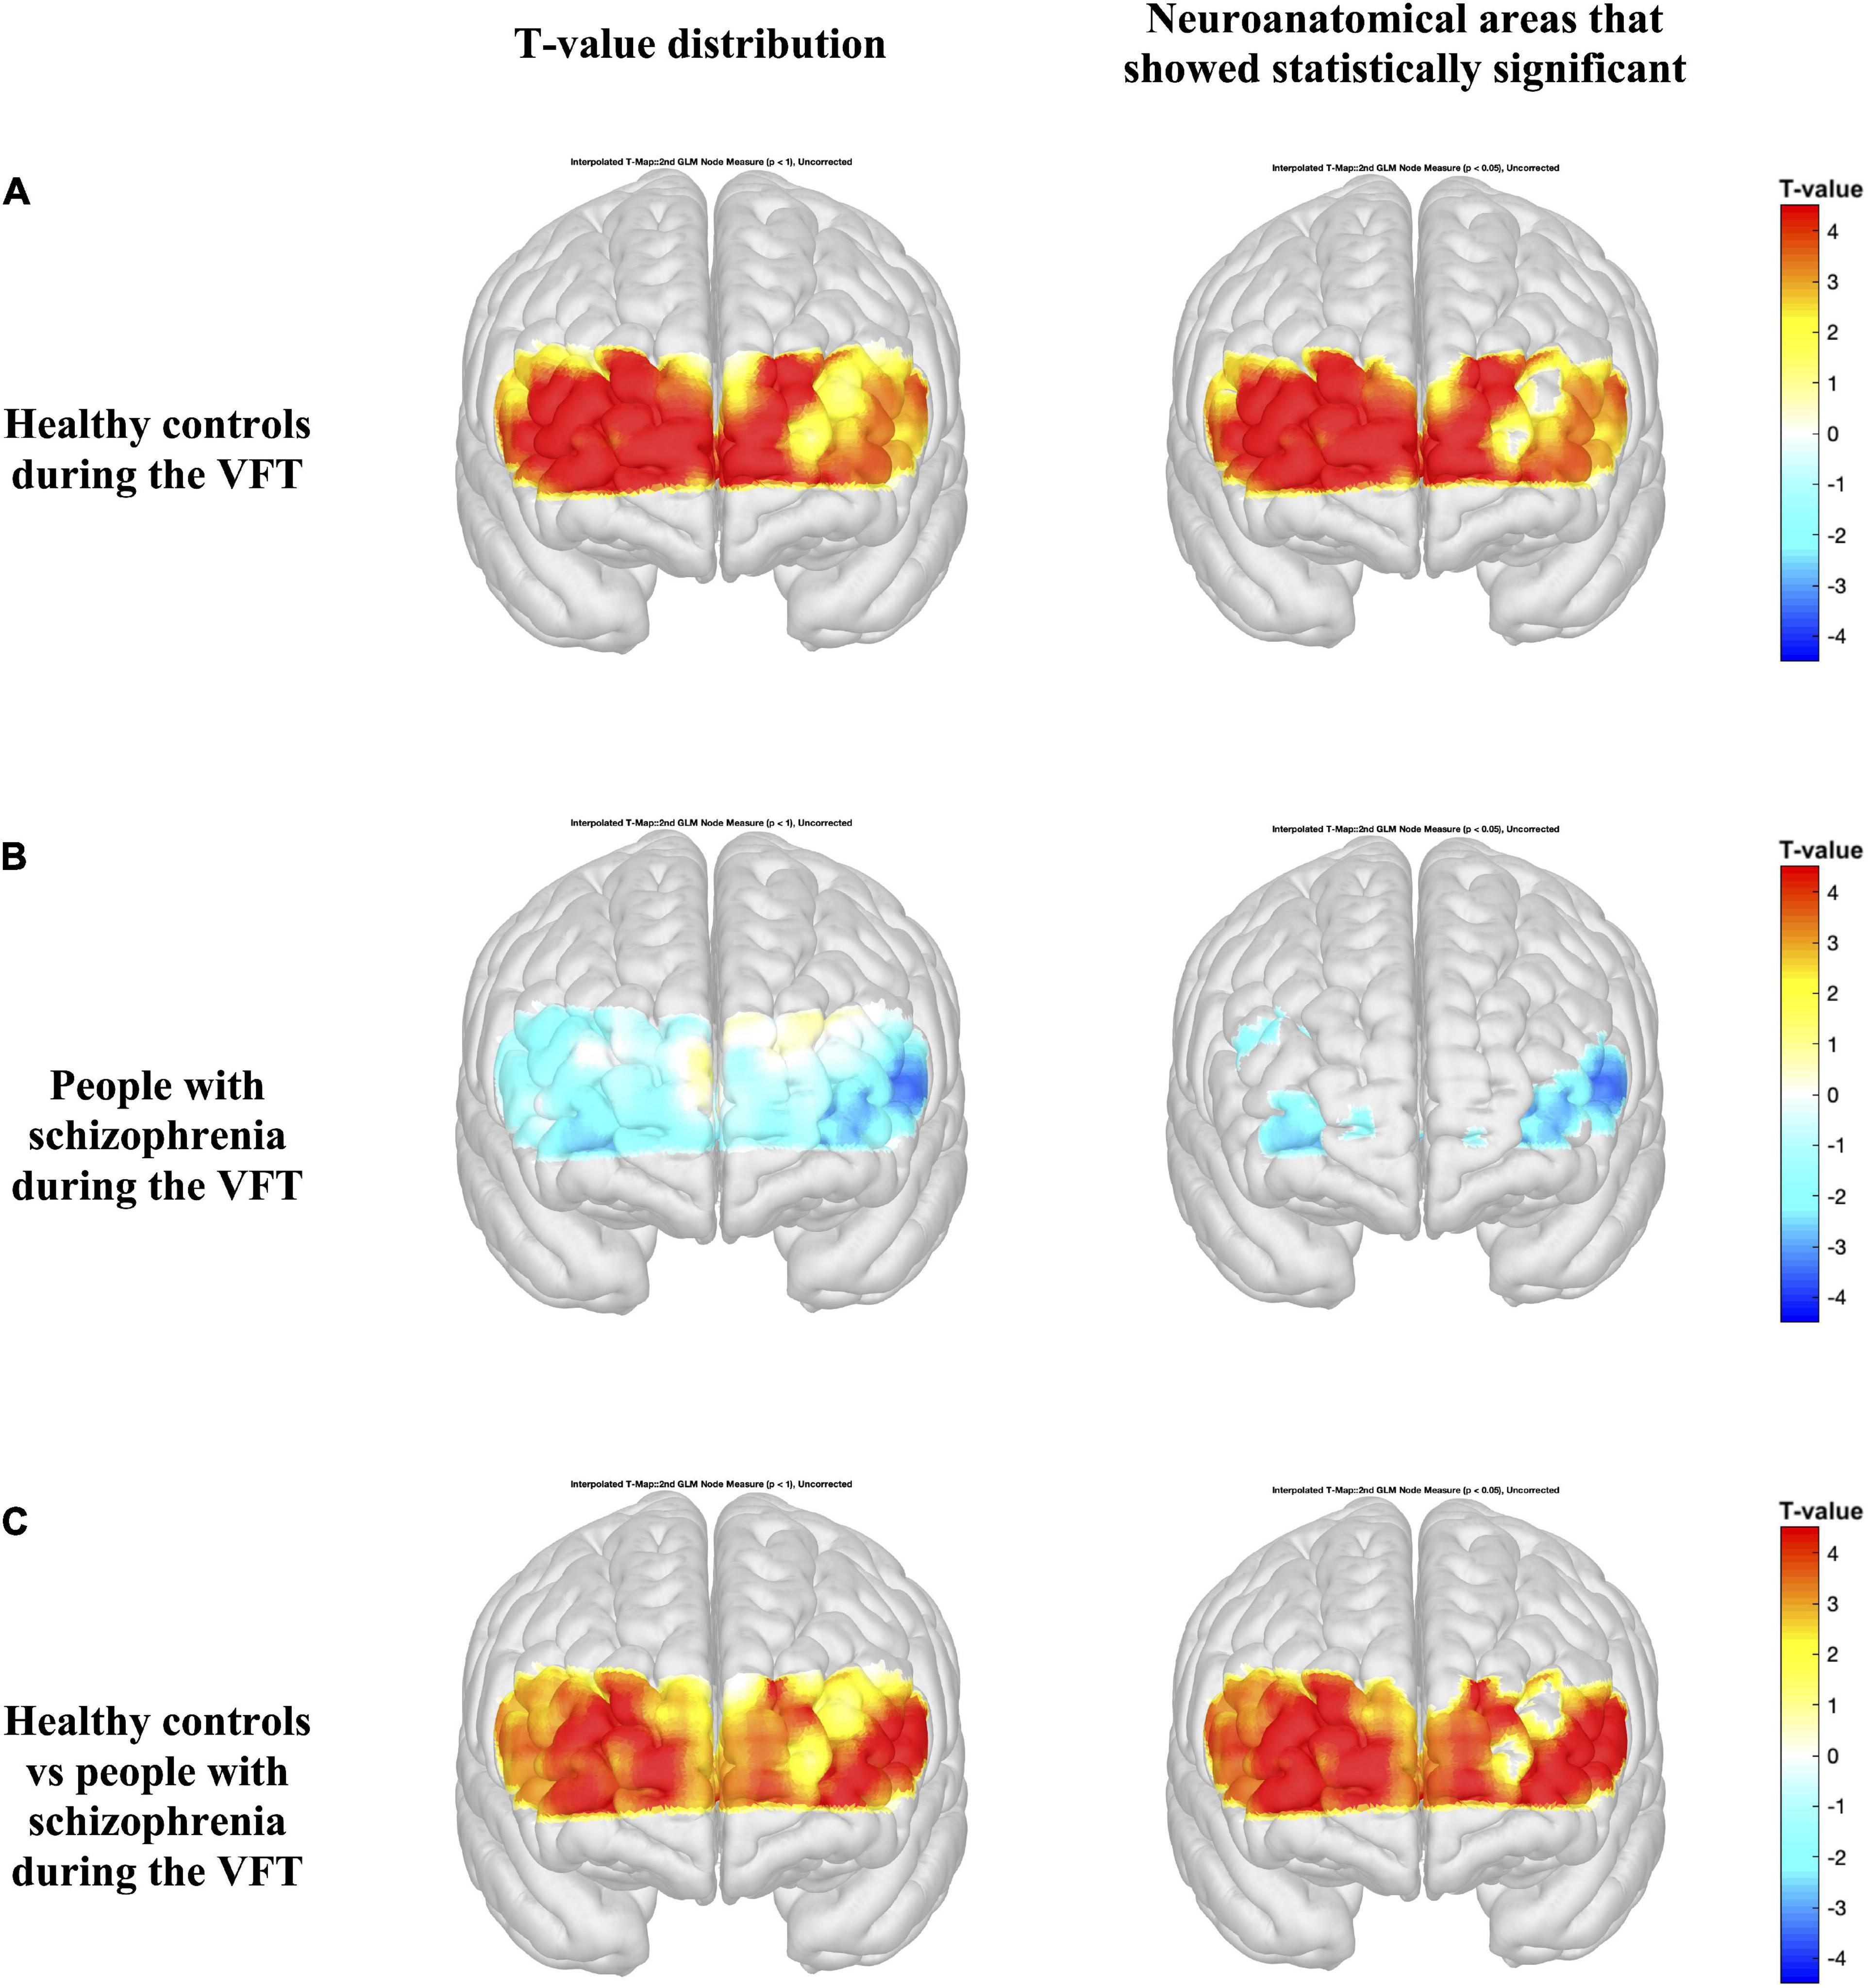
Figures 4, 5 present the activation maps of people with schizophrenia and healthy controls during the SCWT and VFT, respectively, [left side figure highlights the T-value distribution and right side figure indicates the neuroanatomical regions that show statistical significance with p < 0.05 (T-value > 1.96)]. People with schizophrenia did not show significant activation during the SCWT and VFT (p > 0.05). In contrast, health controls group showed a higher significantly activation during two cognitive tasks. In addition, the color map showed significant differences in HbO2 in the most regions of prefrontal brain region between people with schizophrenia and healthy controls during SCWT and VFT (p < 0.05).
Figure 4. Activation maps based on the general linear model (GLM) compare the HbO2 levels during the rest period and Stroop Color-Word Test (SCWT) (A,B). Differences in HbO2 levels during the SCWT are represented by colormap (C). Figures on the left indicate the T-value distribution and figures on the right highlight the neuroanatomical areas that show statistical significance with p < 0.05 (T-value > 1.96).
Figure 5. Activation maps from the general linear model (GLM) compare the HbO2 levels during the rest period and verbal fluency test (VFT) period (A,B). Differences in HbO2 levels during the VFT are represented by colormap (C). Figures on the left indicate the T-value distribution and figures on the right highlights the neuroanatomical areas that show statistical significance with p < 0.05 (T-value > 1.96).
Table 2 shows that healthy controls had significantly higher level of HbO2 change in the some regions of interest of the prefrontal cortex during the SCWT. The highest level of HbO2 in healthy controls was recorded at 0.64 ± 1.58 in the left ventrolateral prefrontal cortex, while the lowest level of HbO2 concentration of people with schizophrenia was −0.24 ± 1.34 at the right orbitofrontal cortex. Furthermore, the difference in the level of HbO2 concentration in the left ventrolateral prefrontal cortex (t = 2.32, p < 0.05) and left dorsolateral prefrontal cortex (t = 2.49, p < 0.05) between two groups was statistically significant.
Table 2. The oxy-hemoglobin (Hbo2) levels changes between rest and task period in eight regions of interest of the prefrontal cortex during the Stroop Color-Word Test (SCWT) (mmol.mm) (n = 157).
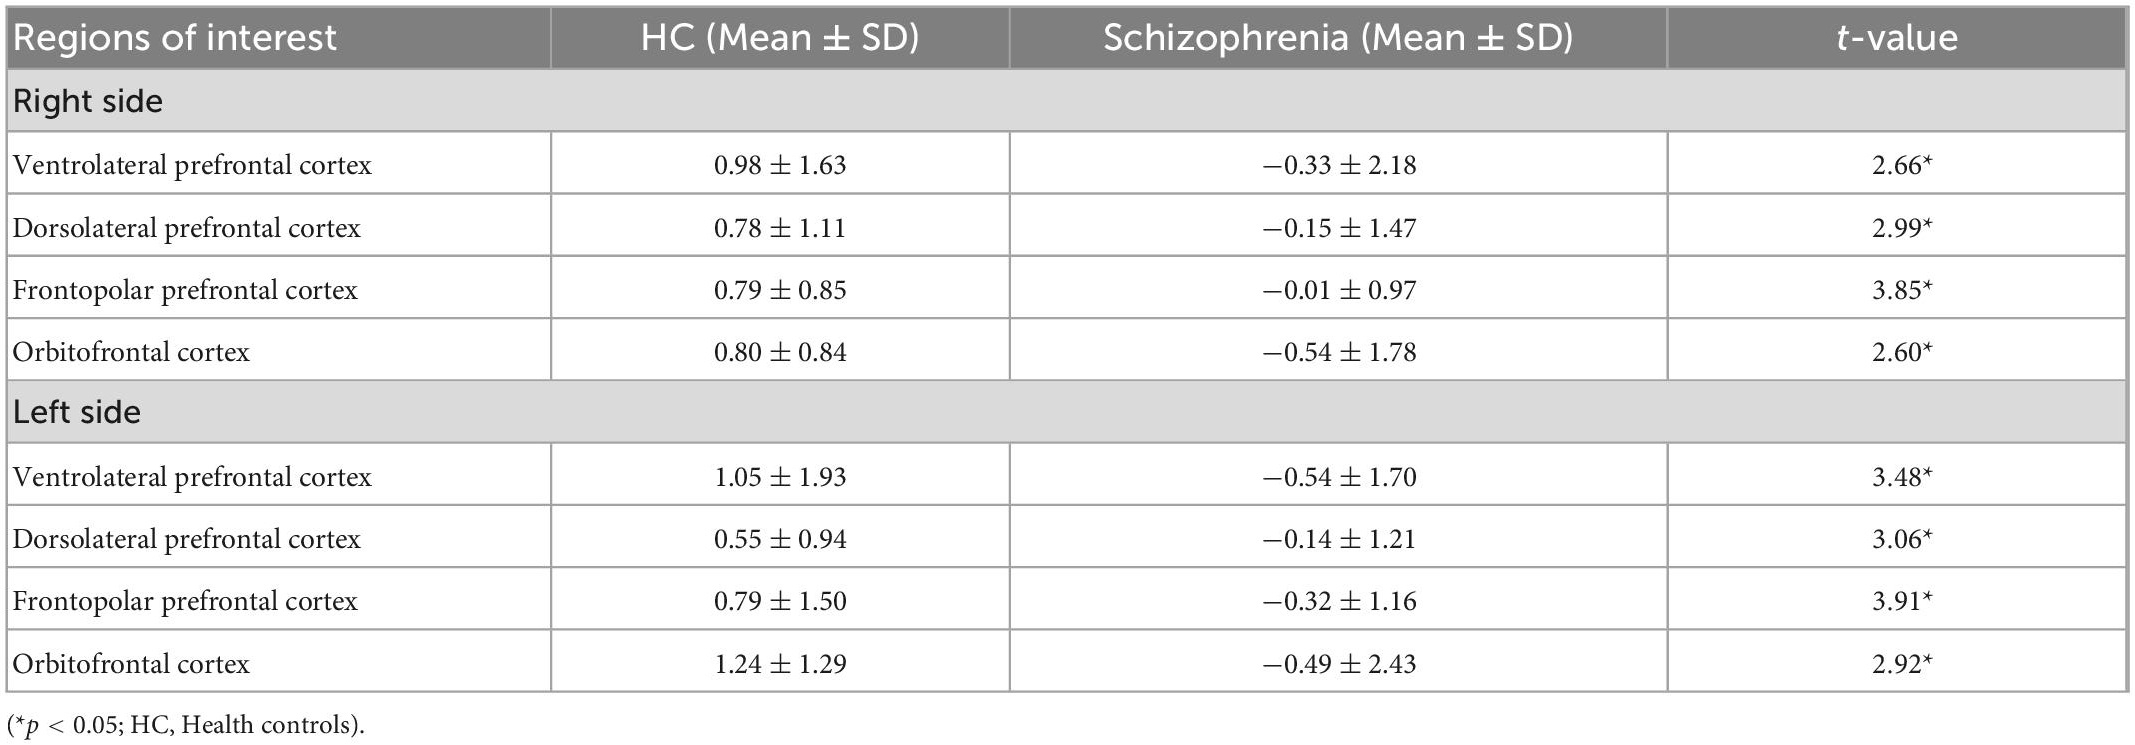
Table 3 shows that healthy controls had significantly higher level of HbO2 change in all regions of interest of the prefrontal cortex during the VFT with p < 0.05. Particularly, the highest level of Oxy-Hb concentration of healthy controls was recorded at 1.24 ± 1.29 in the left of orbitofrontal cortex, followed by the left ventrolateral prefrontal cortex (1.05 ± 1.1.93), and right ventrolateral prefrontal cortex (0.98 ± 1.63). For people with schizophrenia, the lowest level of Oxy-Hb was −0.54 ± 1.70 in the left ventrolateral prefrontal cortex, and −0.54 ± 1.78 in the right orbitofrontal cortex.
Table 3. The oxy-hemoglobin (Hbo2) levels changes between rest and task period in eight regions of interest of the prefrontal cortex during the verbal fluency test (VFT) (mmol.mm) (n = 157).
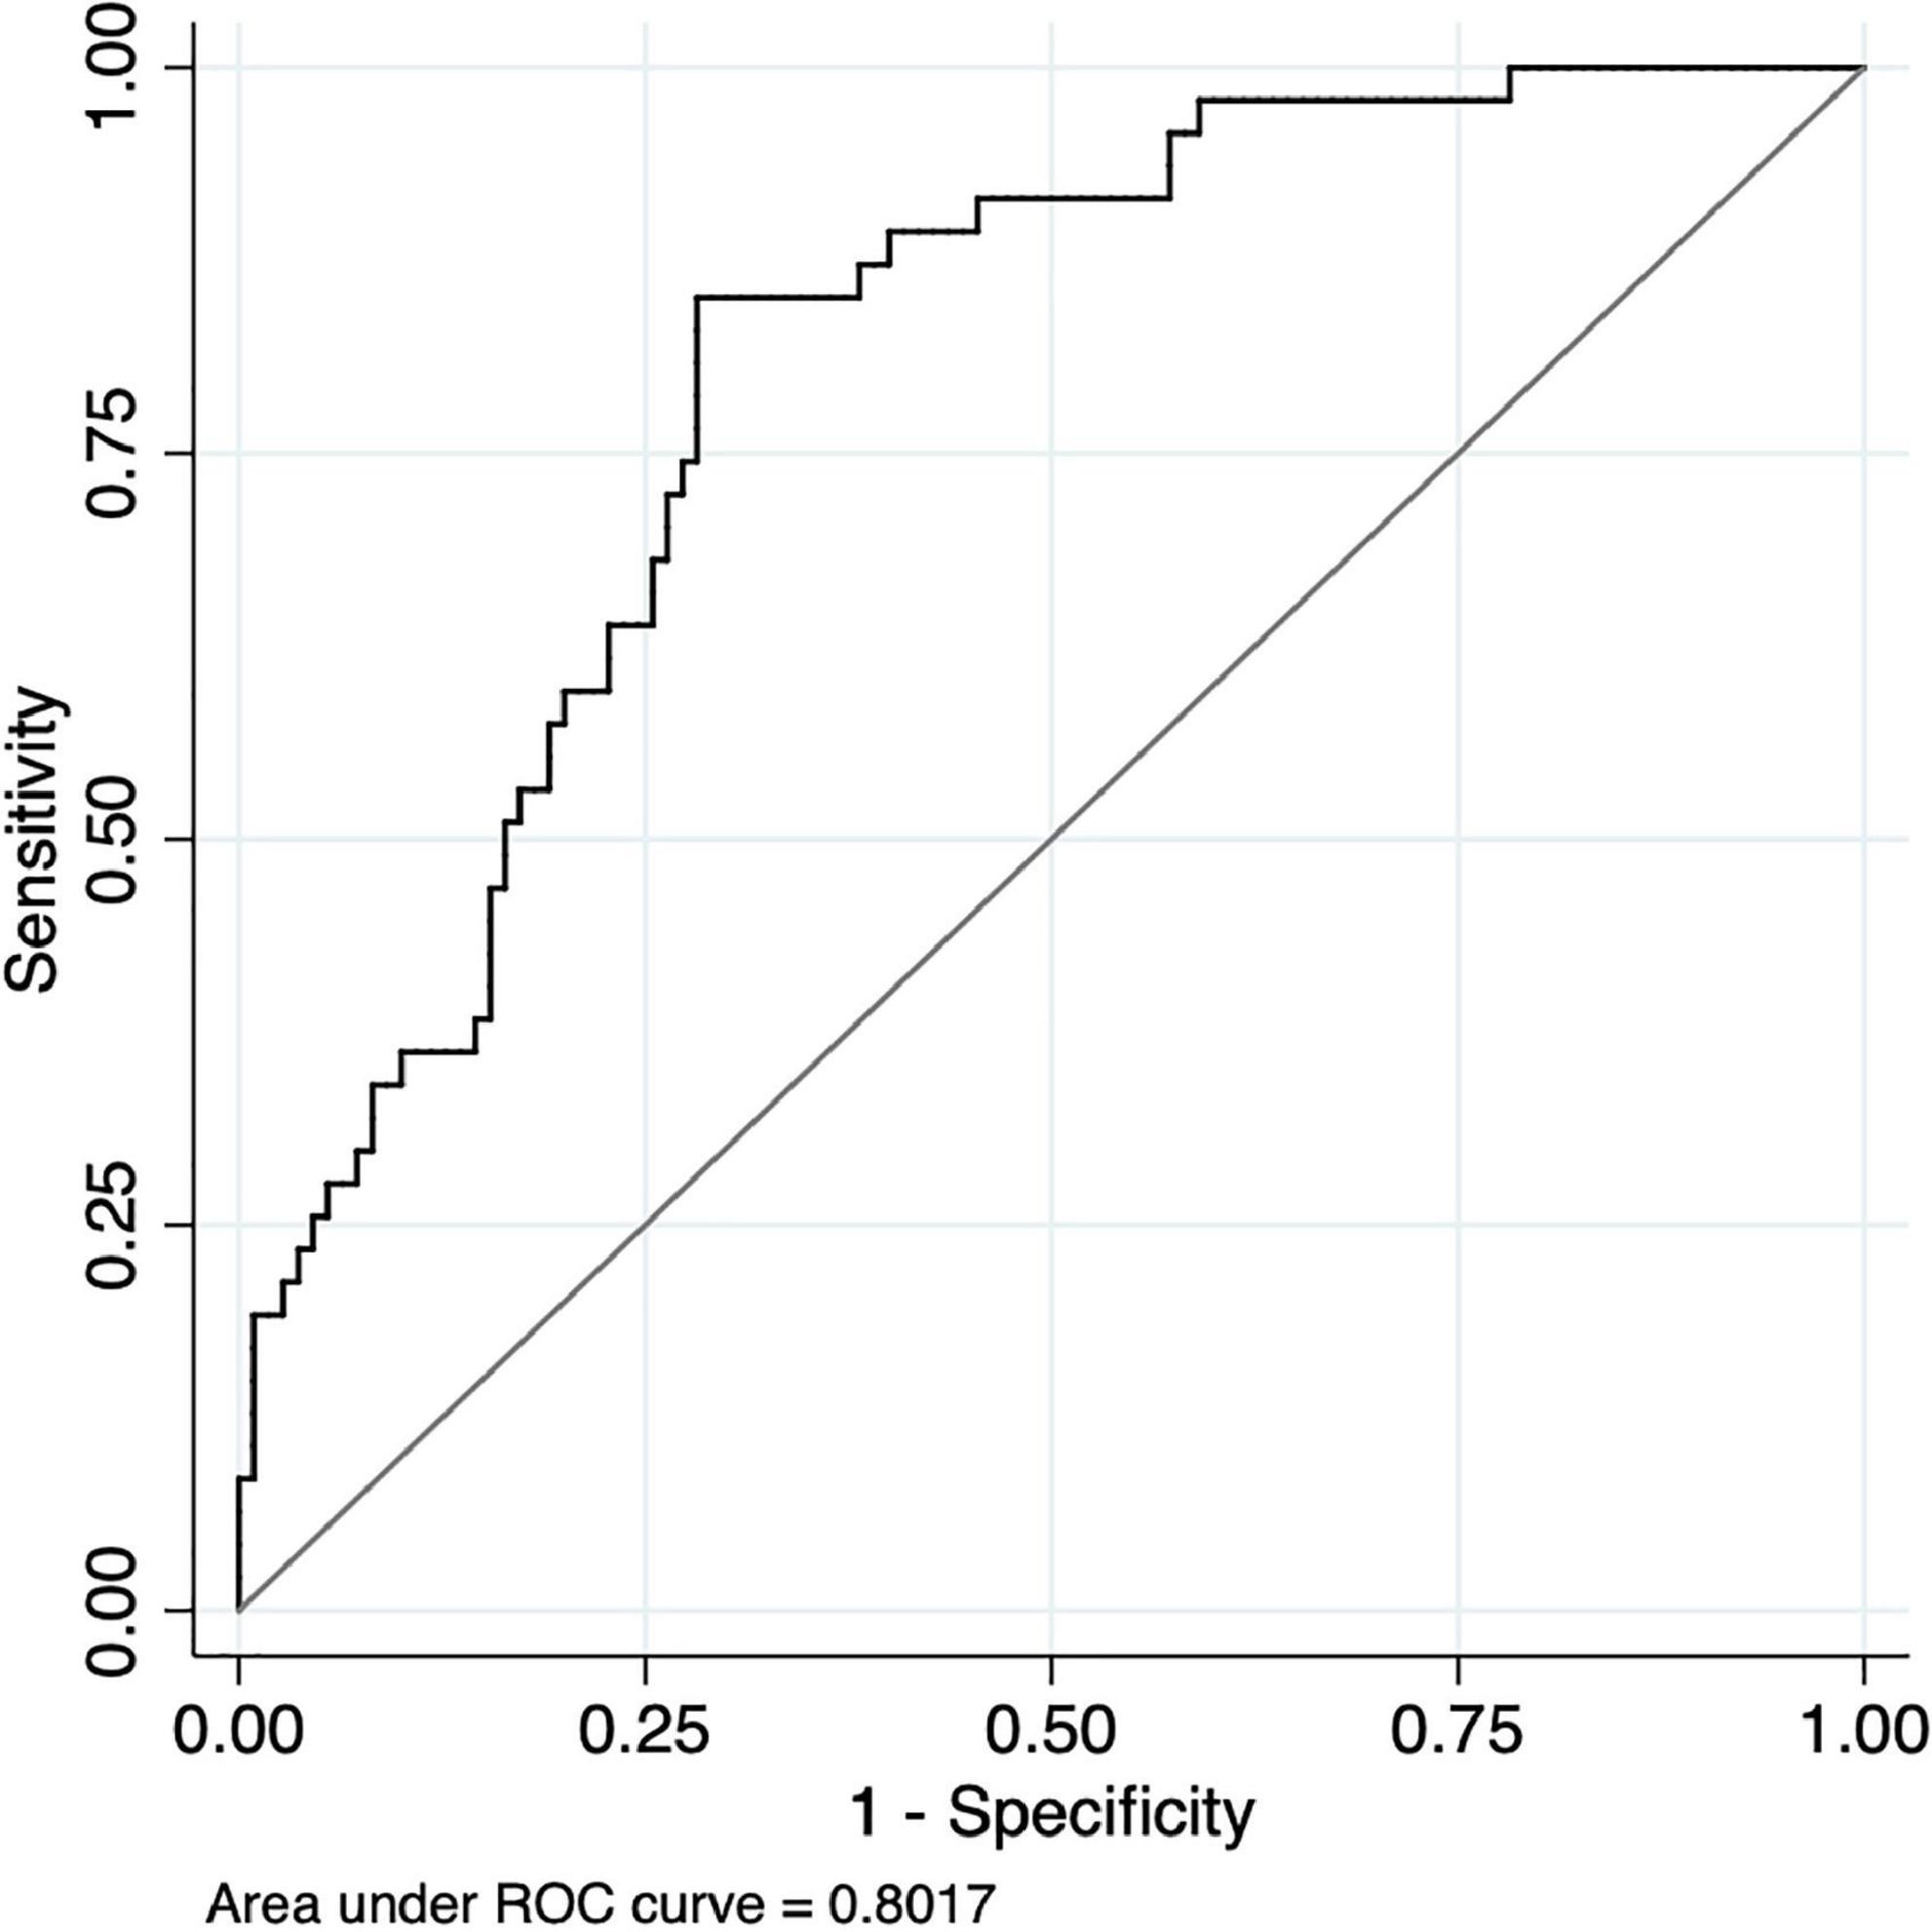
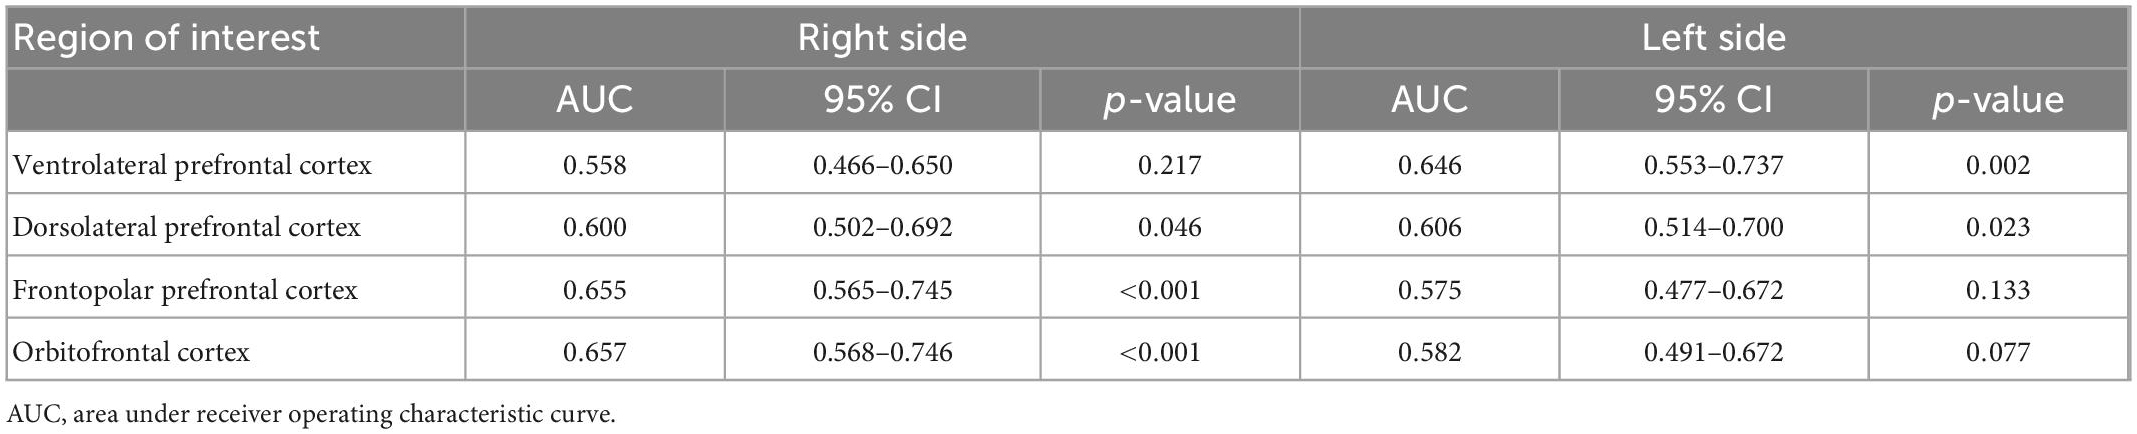
The area under the ROC curve (AUC) and asymptotic normal (95%CI) was estimated for each region during the SWCT and VFT (see Figure 6 and Tables 4, 5). The value of AUC ranged from 0.575 to 0.657 during the SCWT and from 0.717 to 0.802 during the VFT. During the SCWT, the highest value of area under the ROC curve was recorded in the right orbitofrontal cortex with AUC = 0.657 (95%CI = 0.568–0.746), while the opposite finding was observed for the right ventrolateral prefrontal cortex with AUC = 0.562 (95%CI = 0.473–0.650). During the VFT, the AUC was greater than 0.7 (p < 0.001) in all regions of interest. In which, the highest level of AUC during VFT was 0.802 (AUC = 0.802, 95%CI = 0.731–0.872) in the right orbitofrontal cortex, followed by the right frontopolar prefrontal cortex (AUC = 0.751, 95%CI = 0.674–0.828) and left ventrolateral prefrontal cortex (AUC = 0.751, 95%CI = 0.666; 0.835).
Figure 6. Receiver Operating Characteristic (ROC) curve of hemodynamic responses on the right of orbitofrontal cortex between healthy controls and people with schizophrenia during the verbal fluency test.
Table 4. Performance of predicting the diagnosis of schizophrenia by portable functional near-infrared spectroscopy (fNIRS) during the Stroop Color-Word Test.
Table 5. Performance of predicting the diagnosis of schizophrenia by portable functional near-infrared spectroscopy (fNIRS) during the verbal fluency test (VFT).
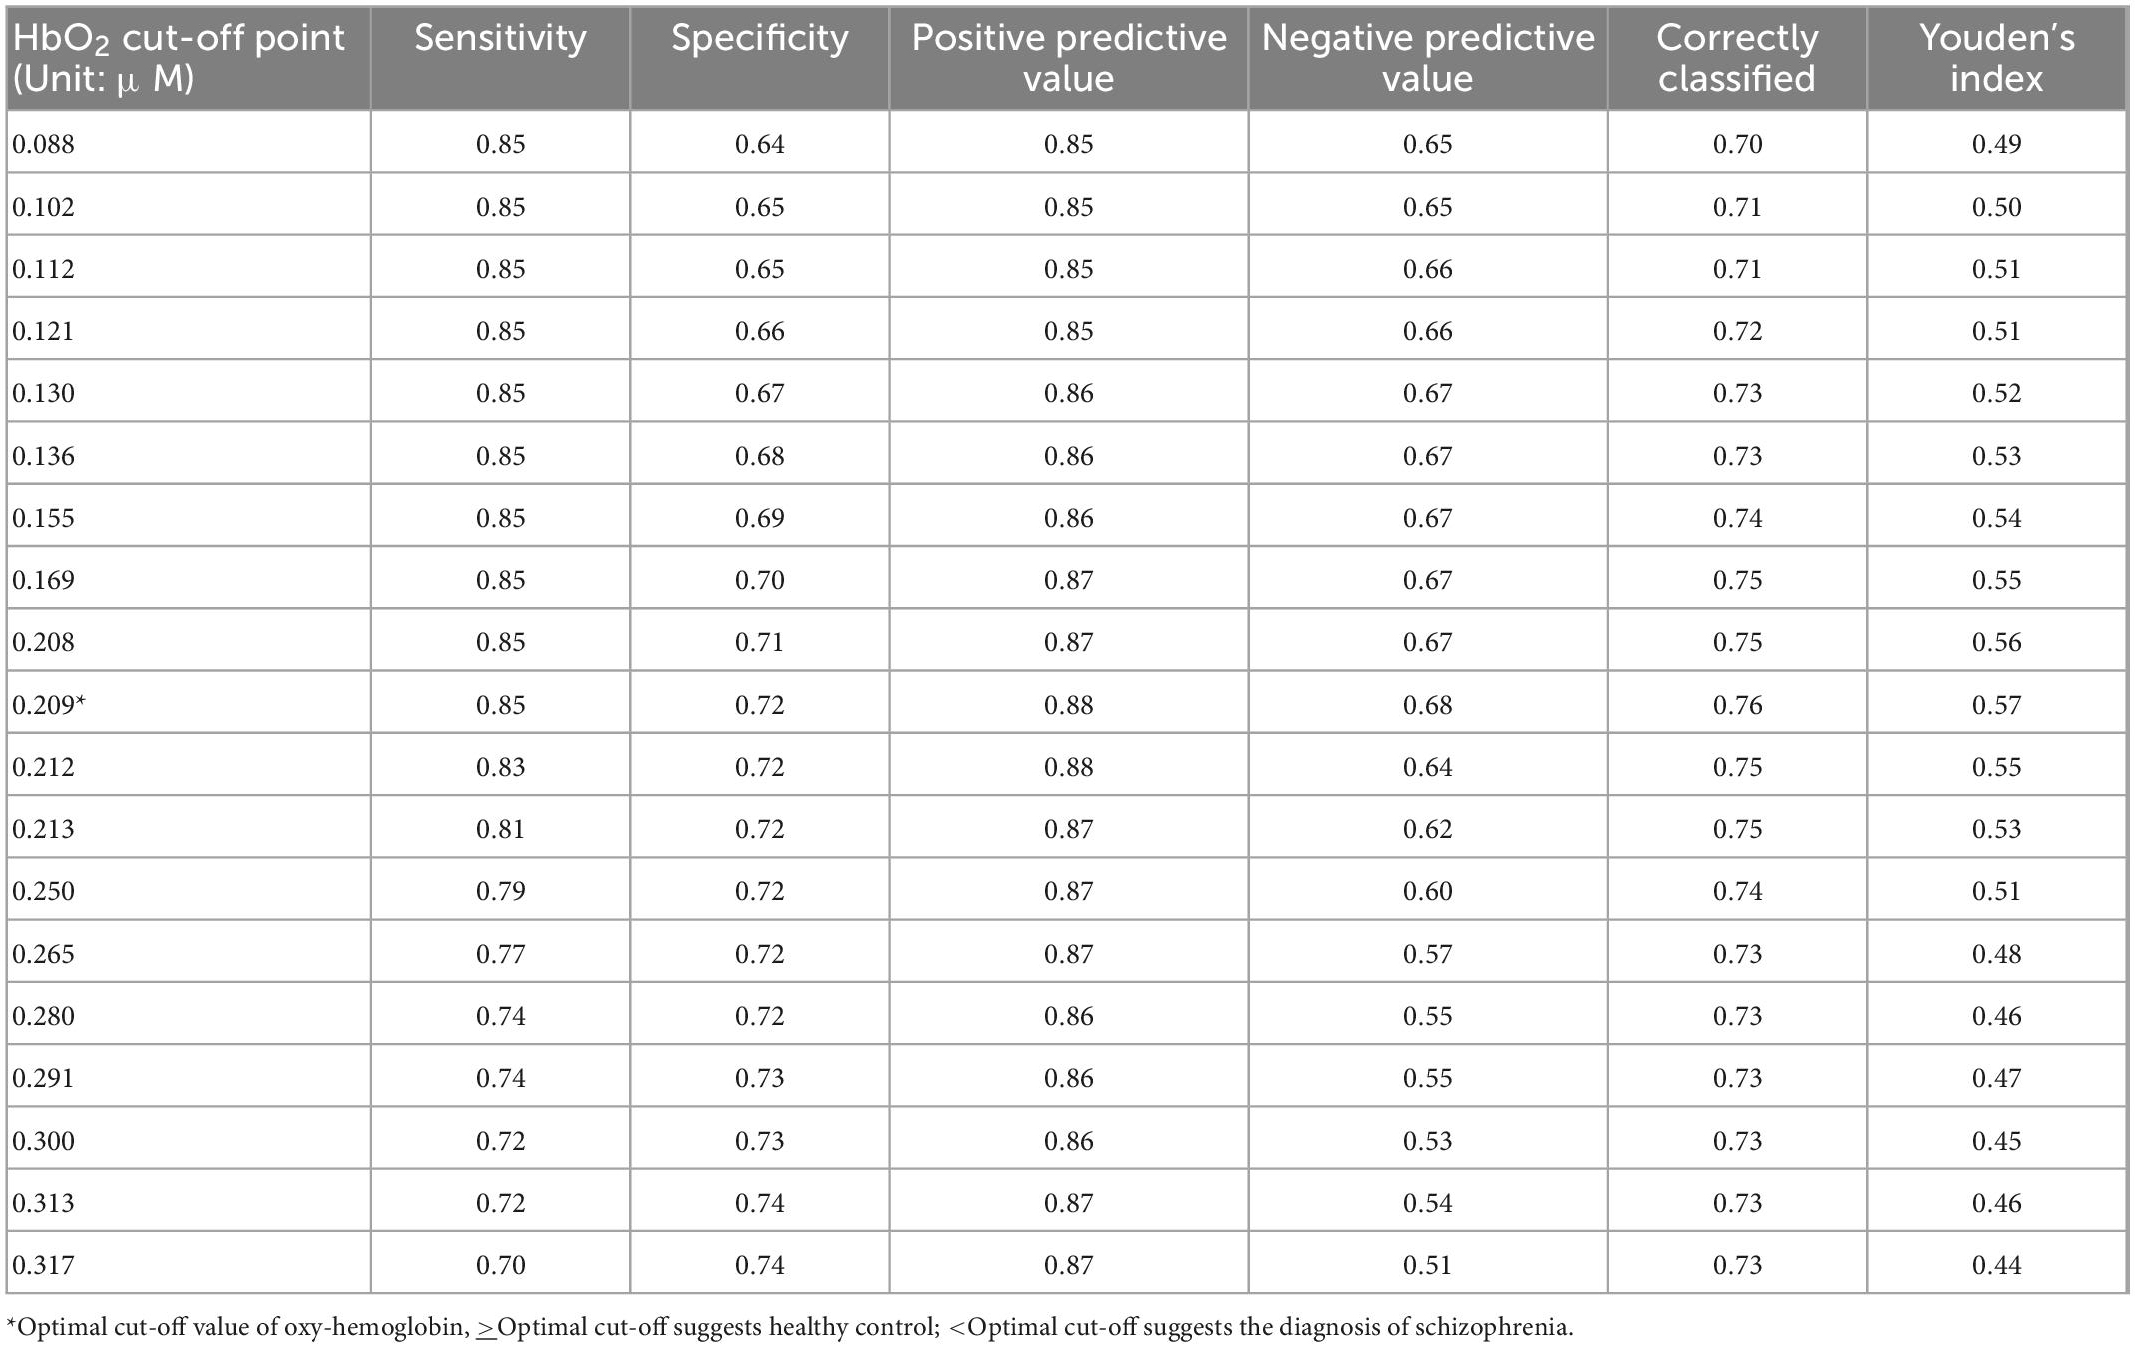
For the region with highest the area under the ROC curve (right orbitofrontal cortex when performing VFT), the value of sensitivity, specificity, PPV, NPV, and optimal HbO2 cut-off point was reported. In particularly, the highest level of Youden’s index was reached at 0.57 with the optimal cut-point of level HbO2 value 0.209 (HbO2 cut-off ≥0.209 μmol/ml for healthy controls; HbO2 cut-off <0.209 for people with schizophrenia) in which the sensitivity was 85%; specificity was 72%; PPV was 0.88; NPV was 0.68, and classification accuracy was 76% (Table 6).
Table 6. The sensitivity, specificity, positive predictive, and negative predictive values (NPVs) of the HbO2 cut-off point for differentiating healthy controls from schizophrenia patients at the right orbitofrontal cortex during the verbal fluency test (VFT).
4. DiscussionWe found that fNIRS combined with neuropsychological tests succeeds in differentiating people with schizophrenia from healthy controls. The best schizophrenia diagnosis prediction was found for the combination of VFT and fNIRS with a focus on the right orbitofrontal cortex and a cutoff <0.209 μmol/ml for schizophrenia (sensitivity was 85%; specificity was 72%; PPV was 0.88; NPV was 0.68 and classification accuracy was 76%). Our positive predictive value (88%) is comparable with previous fNIRS studies to differentiate schizophrenia from healthy controls (84.7–89.7%) (13, 14, 50–53). Our findings are in line with previous fNIRS research that found the prefrontal cortex, a key neuroanatomical area that demonstrates pathology in important psychiatric illnesses including schizophrenia (54, 55), major depressive disorder (56), bipolar disorder (8), generalized anxiety disorder (57), and borderline personality disorder (9). Furthermore, underdevelopment in the right orbitofrontal cortex may underlie vulnerability to psychosis and the core symptoms of schizophrenia (58). Particularly, the studies by Chou et al. (53) and Yang et al. (13) have indicated that the classification accuracy of fNIRS devices in distinguishing schizophrenia from healthy controls ranged from 68.2 to 79.7% and 66.5 to 85.0%, respectively. These differences in the classification accuracy of fNIRS devices might result from variations in the VFT’s design. While the Japanese VFT or Chinese utilize syllabary, we chose Vietnamese alphabets. Actually, the lexical retrieval strategies of alphabetic and non-alphabetic languages differ (59). Therefore, it can affect cortical activity when performing this test. For example, at least two variations of Chinese VFT have been developed in fNIRS studies on people with schizophrenia, because they use different syllable systems (60). Specifically, the VFT developed by Li et al. (55) is applied to people in mainland China and differed from that used by Yang et al. (13) for residents in Taiwan.
Executive function is a group of complex cognitive activities (e.g., working memory and impulse controls) that contributes to organizing, planning, and making decisions before conducting tasks. Executive impairment is one of the core pathological traits of schizophrenia. The VFT evaluates word production, executive abilities, as well as cognitive flexibility (61). Before the development of fNIRS, the VFT was used to study cortical activation pattern of people with schizophrenia by functional magnetic resonance imaging (fMRI) (62). In this study, semantic fluency of Vietnamese language was assessed instead of phonemic fluency. Previous study found that schizophrenia was found to be associated with more compromises to the semantic fluency as compared to phonemic fluency (63). A recent meta-analysis found that the fNIRS-VFT paradigm enhances understanding, detection and differentiating various psychiatric conditions, and has the potential for developing cost-effective neuroimaging biomarkers for clinical psychiatry (64). Hence, it is not surprising that the VFT is a good neuropsychological test to distinguish hemodynamic activity between patients with schizophrenia and healthy controls by fNIRS measuring. A notable finding in the current study is the differences in HbO2 concentration between healthy group and schizophrenia group during the VFT, and this difference may be caused by underlying biological etiology and neuropathology. Our findings are consistent with previous functional neuroimaging studies. A fMRI study found that a specific medio-prefronto-striato-thalamic functional dysconnectivity detected by VFT and implicated as the pathophysiology of schizophrenia (65). Furthermore, sigma non-opioid intracellular receptor 1 (SIGMAR1) gene polymorphism is involved in the pathogenesis of schizophrenia (66). People with schizophrenia who are Pro carriers for SIGMAR1 gene have significantly lower activation of the right pre-frontal cortex during the VFT as compared to healthy people who are homozygous for the Gln/Gln genotype (66).
Further fNIRS research is needed to evaluate other cognitive tests such as Wisconsin Card Sorting Test and working memory task (e.g., N-back), which may be helpful in differentiating people with schizophrenia and healthy controls (67). fNIRS can be an objective tool to assess changes in brain hemodynamics after computer-based cognitive training in addition to improvement of scores in neuropsychological tests (68). A meta-analysis found that second generation antipsychotics such as clozapine, olanzapine, quetiapine, and risperidone produce a mild remediation of cognitive deficits in schizophrenia (69). fNIRS can be applied and monitored the changes in brain hemodynamics after the initiation of antipsychotic treatment. Portable fNIRS scan may have the potential to assess cognitive function in people who are at ultra-high risk for schizophreniform psychosis and first-episode schizophrenia (70). A longitudinal study is required to assess the capability of portable fNIRS in predicting the diagnosis of schizophrenia in young people who present with early psychosis.
To improve classification accuracy of fNIRS device, future diagnostic methods should incorporate fNIRS and other biomarkers such as interleukin (IL)-8 and superoxide dismutase which were found to correlate with executive function in people with schizophrenia (71). As performances in VFT could differentiate people with the first episode of schizophrenia and healthy controls (72), monitoring hemodynamics when performing VFT by the portable fNIRS scan could enhance the accuracy of diagnosis of the first episode of schizophrenia and allows early intervention.
This study has several limitations that should be considered when interpreting the finding, especially regarding the duration of illness, gender and clinical stage, and medication (73–76). Firstly, this is a cross-sectional study and a longitudinal study is needed to follow the changes in HbO2 concentration during the course of illness as well as the impact of antipsychotic medications on hemodynamic response when performing the cognitive tests. Secondly, fNIRS device in this study mainly assesses cortical regions and could not measure the changes of hemodynamics level of subcortical structures such as the cerebellum. Thirdly, because of the small sample, this study was not able to assess the hemodynamic activation of different types of schizophrenia as well as other characteristics such as age, gender and clinical stage of schizophrenia. Furthermore, this study lack results on behavioral performance during cognitive tests, and further study is required to explore this information for Vietnamese schizophrenia patients.
ConclusionIn conclusion, this study indicates that during the VFT, the right orbitofrontal cortex is the most important neuroanatomical region to distinguish people with schizophrenia from healthy controls. The portable fNIRS device may be considered an adjunct diagnostic tool for schizophrenia.
Data availability statementThe raw data supporting the conclusions of this article will be made available by the authors, without undue reservation.
Ethics statementThe studies involving human participants were reviewed and approved by the Vietnam Ministry of Health under Decision No 850/QD-BYT. The protocol of this study was approved by the Institutional Review Board of Hanoi Medical University (Number 58/GCN-HDDNCYSH-DHYHN). The patients/participants provided their written informed consent to participate in this study.
Author contributionsBT, HT, HL, CL, KN, RM, CH, and RH: conceptualization. TN, HT, HuN, and HaN: data curation. BT, TN, HaN, LB, GF, PA, SH, JC, RM, CH, CL, RH, and MZ: formal analysis. BT, TN, HT, RM, SH, JC, CH, CL, RH, and MZ: methodology. BT, TN, HaN, JC, and RH: software. BT, LB, GF, PA, HL, HT, HaN, RM, CH, CL, RH, and MZ: supervision. TN, HaN, HuN, and HT: investigation. BT, LB, GF, PA, HL, JC, RH, and MZ: writing—original draft. All authors contributed to the article, writing—review and editing, and approved the submitted version.
FundingThis study received funding from the Gia Lam Urban Development and Investment Company Limited, Vingroup, Vingroup Innovation Foundation (VINIF) (Grant No. VINIF.2019.DA14), NUS Department of Psychological Medicine (R-177-000-100-001/R-177-000-003-001), and NUS iHeathtech Other Operating Expenses (R-722-000-004-731). The funder was not involved in the study design, collection, analysis, interpretation of data, the writing of this article or the decision to submit it for publication.
AcknowledgmentsThis study was managed by the Ministry of Health with Decision No. 850/QĐ-BYT, implemented by Institute for Preventive Medicine and Public Health, Hanoi Medical University, with funding from the Vingroup Innovation Fund under the agreement VINIF.2019.DA14. The authors would like to thank the VINGROUP, Ministry of Health, Hanoi Department of Health, Vietnam Young Physician Association, Hanoi Medical University, and the research collaborator.
Conflict of interestJC was employed by OBELAB, Inc. RM has received research grant support from CIHR/GACD/Chinese National Natural Research Foundation; speaker/consultation fees from Lundbeck, Janssen, Purdue, Pfizer, Otsuka, Takeda, Neurocrine, Sunovion, Bausch Health, Novo Nordisk, Kris, Sanofi, Eisai, Intra-Cellular, NewBridge Pharmaceuticals, Abbvie and also a CEO of Braxia Scientific Corp.
The remaining authors declare that the research was conducted in the absence of any commercial or financial relationships that could be construed as a potential conflict of interest.
Publisher’s noteAll claims expressed in this article are solely those of the authors and do not necessarily represent those of their affiliated organizations, or those of the publisher, the editors and the reviewers. Any product that may be evaluated in this article, or claim that may be made by its manufacturer, is not guaranteed or endorsed by the publisher.
References1. Puri BH, Ho R. Revision Notes in Psychiatry. 3rd ed. New York, NY: CRC Press (2013).
2. Valle R. Schizophrenia in ICD-11: comparison of ICD-10 and DSM-5. Rev Psiquiatr Salud Ment. (2020) 13:95–104. doi: 10.1016/j.rpsmen.2020.01.002
CrossRef Full Text | Google Scholar
3. Kraguljac N, McDonald W, Widge A, Rodriguez C, Tohen M, Nemeroff C. Neuroimaging biomarkers in schizophrenia. Am J Psychiatry. (2021) 178:509–21. doi: 10.1176/appi.ajp.2020.20030340
PubMed Abstract | CrossRef Full Text | Google Scholar
4. Ho C, Zhang M, Ho R. Optical topography in psychiatry: a chip off the old block or a new look beyond the mind–brain Frontiers? Front Psychiatry. (2016) 7:74. doi: 10.3389/fpsyt.2016.00074
PubMed Abstract | CrossRef Full Text | Google Scholar
5. Lai C, Ho C, Lim C, Ho R. Functional near-infrared spectroscopy in psychiatry. BJPsych Adv. (2017) 23:324–30. doi: 10.1192/apt.bp.115.015610
CrossRef Full Text | Google Scholar
6. Kumar V, Shivakumar V, Chhabra H, Bose A, Venkatasubramanian G, Gangadhar B. Functional near infra-red spectroscopy (fNIRS) in schizophrenia: a review. Asian J Psychiatr. (2017) 27:18–31. doi: 10.1016/j.ajp.2017.02.009
PubMed Abstract | CrossRef Full Text | Google Scholar
7. Husain S, Yu R, Tang T, Tam W, Tran B, Quek T, et al. Validating a functional near-infrared spectroscopy diagnostic paradigm for major depressive disorder. Sci Rep. (2020) 10:9740. doi: 10.1038/s41598-020-66784-2
PubMed Abstract | CrossRef Full Text | Google Scholar
8. Husain S, Tang T, Tam W, Tran B, Ho C, Ho R. Cortical haemodynamic response during the verbal fluency task in patients with bipolar disorder and borderline personality disorder: a preliminary functional near-infrared spectroscopy study. BMC Psychiatry. (2021) 21:201. doi: 10.1186/s12888-021-03195-1
PubMed Abstract | CrossRef Full Text | Google Scholar
9. Husain S, Tang T, Yu R, Tam W, Tran B, Quek T, et al. Cortical haemodynamic response measured by functional near infrared spectroscopy during a verbal fluency task in patients with major depression and borderline personality disorder. EBioMedicine. (2020) 51:102586. doi: 10.1016/j.ebiom.2019.11.047
PubMed Abstract | CrossRef Full Text | Google Scholar
10. Kumar V, Nichenmetla S, Chhabra H, Sreeraj V, Rao N, Kesavan M, et al. Prefrontal cortex activation during working memory task in schizophrenia: a fNIRS study. Asian J Psychiatry. (2021) 56:102507. doi: 10.1016/j.ajp.2020.102507
PubMed Abstract | CrossRef Full Text | Google Scholar
11. Tyburski E, Mak M, Samochowiec A, Plichta P, Bielecki M, Rek-Owodziń K, et al. The relationship between cingulum bundle integrity and different aspects of executive functions in chronic schizophrenia. Prog Neuropsychopharmacol Biol Psychiatry. (2020) 102:109955. doi: 10.1016/j.pnpbp.2020.109955
PubMed Abstract | CrossRef Full Text | Google Scholar
12. Chou P, Huang C, Sun C. The potential role of functional near-infrared spectroscopy as clinical biomarkers in schizophrenia. Curr Pharm Des. (2020) 26:201–17. doi: 10.2174/1381612825666191014164511
PubMed Abstract | CrossRef Full Text | Google Scholar
13. Yang J, Ji X, Quan W, Liu Y, Wei B, Wu T. Classification of schizophrenia by functional connectivity strength using functional near infrared spectroscopy. Front Neuroinform. (2020) 14:40. doi: 10.3389/fninf.2020.00040
PubMed Abstract | CrossRef Full Text | Google Scholar
14. Ji X, Quan W, Yang L, Chen J, Wang J, Wu T. Classification of schizophrenia by seed-based functional connectivity using prefronto-temporal functional near infrared spectroscopy. J Neurosci Methods. (2020) 344:108874. doi: 10.1016/j.jneumeth.2020.108874
PubMed Abstract | CrossRef Full Text | Google Scholar
15. Erdoğan S, Yükselen G. Four-class classification of neuropsychiatric disorders by use of functional near-infrared spectroscopy derived biomarkers. Sensors (Basel). (2022) 22:5407. doi: 10.3390/s22145407
PubMed Abstract | CrossRef Full Text | Google Scholar
16. Sumiyoshi C, Sumiyoshi T, Matsui M, Nohara S, Yamashita I, Kurachi M, et al. Effect of orthography on the verbal fluency performance in schizophrenia: examination using Japanese patients. Schizophr Res. (2004) 69:15–22. doi: 10.1016/S0920-9964(03)00174-9
PubMed Abstract | CrossRef Full Text | Google Scholar
17. Dan H, Dan I, Sano T, Kyutoku Y, Oguro K, Yokota H, et al. Language-specific cortical activation patterns for verbal fluency tasks in Japanese as assessed by multichannel functional near-infrared spectroscopy. Brain Lang. (2013) 126:208–16. doi: 10.1016/j.bandl.2013.05.007
PubMed Abstract | CrossRef Full Text | Google Scholar
18. Chou P, Lin W, Li W, Huang C, Sun C. Reduced language lateralization in first episode schizophrenia: a near infrared spectroscopy study. Prog Neuro Psychopharmacol Biol Psychiatry. (2017) 78:96–104. doi: 10.1016/j.pnpbp.2017.05.001
PubMed Abstract | CrossRef Full Text | Google Scholar
19. Chou P, Lin W, Hung C, Chang C, Li W, Lan T, et al. Perceived occupational stress is associated with decreased cortical activity of the prefrontal cortex: a multichannel near-infrared spectroscopy study. Sci Rep. (2016) 6:39089. doi: 10.1038/srep39089
PubMed Abstract | CrossRef Full Text | Google Scholar
20. Quan W, Wu T, Li Z, Wang Y, Dong W, Lv B. Reduced prefrontal activation during a verbal fluency task in Chinese-speaking patients with schizophrenia as measured by near-infrared spectroscopy. Prog Neuropsychopharmacol Biol Psychiatry. (2015) 58:51–8. doi: 10.1016/j.pnpbp.2014.12.005
PubMed Abstract | CrossRef Full Text | Google Scholar
21. Morrens M, Krabbendam L, Bak M, Delespaul P, Mengelers R, Sabbe B, et al. The relationship between cognitive dysfunction and stress sensitivity in schizophrenia: a replication study. Soc Psychiatry Psychiatr Epidemiol. (2007) 42:284–7. doi: 10.1007/s00127-007-0170-7
PubMed Abstract | CrossRef Full Text | Google Scholar
22. Aleksandrowicz A, Hagenmuller F, Haker H, Heekeren K, Theodoridou A, Walitza S, et al. Frontal brain activity in individuals at risk for schizophrenic psychosis and bipolar disorder during the emotional stroop task–an fNIRS study. Neuroimage Clin. (2020) 26:102232. doi: 10.1016/j.nicl.2020.102232
PubMed Abstract | CrossRef Full Text | Google Scholar
23. Jakobsen K, Frederiksen J, Hansen T, Jansson L, Parnas J, Werge T. Reliability of clinical ICD-10 schizophrenia diagnoses. Nordic J Psychiatry. (2005) 59:209–12. doi: 10.1080/08039480510027698
PubMed Abstract | CrossRef Full Text | Google Scholar
24. Kay S, Opler L, Lindenmayer J. Reliability and validity of the positive and negative syndrome scale for schizophrenics. Psychiatry Res. (1988) 23:99–110. doi: 10.1016/0165-1781(88)90038-8
CrossRef Full Text | Google Scholar
26. Depp C, Loughran C, Vahia I, Molinari V. Assessing psychosis in acute and chronic mentally ill older adults. 2nd ed. In: P Lichtenberg editor. Handbook of Assessment in Clinical Gerontology. (San Diego, CA: Academic Press) (2010). p. 123–54. doi: 10.1016/B978-0-12-374961-1.10005-3
CrossRef Full Text | Google Scholar
31. Hallak J, Machado-de-Sousa J, Crippa J, Sanches R, Trzesniak C, Chaves C, et al. Performance of schizophrenic patients in the stroop color word test and electrodermal responsiveness after acute administration of cannabidiol (CBD). Braz J Psychiatry. (2010) 32:56–61. doi: 10.1590/S1516-44462010000100011
PubMed Abstract | CrossRef Full Text | Google Scholar
32. Hepp H, Maier S, Hermle L, Spitzer M. The stroop effect in schizophrenic patients. Schizophr Res. (1996) 22:187–95. doi: 10.1016/S0920-9964(96)00080-1
CrossRef Full Text | Google Scholar
33. Kempler D, Teng E, Dick M, Taussig I, Davis D. The effects of age, education, and ethnicity on verbal fluency. J Int Neuropsychol Soc. (1998) 4:531–8. doi: 10.1017/S1355617798466013
留言 (0)