


記住我
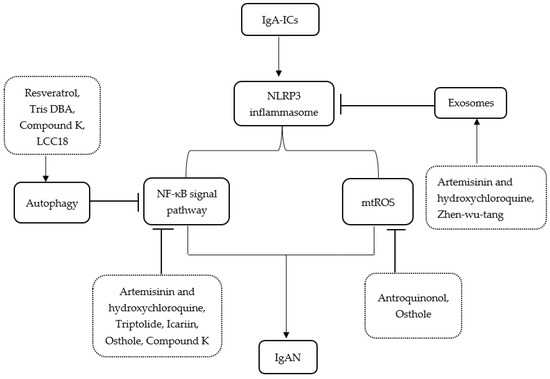

Figure 1. Chemical structure of chrysophanol.
Figure 1. Chemical structure of chrysophanol.
Figure 2. Chrysophanol reduced cell viability and proliferation in CAL-27 and Ca9-22 cells. (A,B) Both cells were incubated with several concentrations of chrysophanol for 24 to 72 h (0–300 μM), and then the viability of cells was measured using the MTT assay. (C–F)) A colony-formation assay was performed to examine cell proliferation. Cells were treated with chrysophanol for seven days and stained with a 1% crystal violet solution. The number of colonies was converted into a percentage and shown in a histogram. The results are exhibited as mean ± SD (* p < 0.05, ** p < 0.01, *** p < 0.001).
Figure 2. Chrysophanol reduced cell viability and proliferation in CAL-27 and Ca9-22 cells. (A,B) Both cells were incubated with several concentrations of chrysophanol for 24 to 72 h (0–300 μM), and then the viability of cells was measured using the MTT assay. (C–F)) A colony-formation assay was performed to examine cell proliferation. Cells were treated with chrysophanol for seven days and stained with a 1% crystal violet solution. The number of colonies was converted into a percentage and shown in a histogram. The results are exhibited as mean ± SD (* p < 0.05, ** p < 0.01, *** p < 0.001).
Figure 3. Chrysophanol induced apoptosis via caspase activations in CAL-27 and Ca9-22 cells. Both cells were incubated with chrysophanol (0, 100, and 150 μM) for 24 h. (A,B). The change in nuclear morphology was investigated by Hoechst agents. Then, nuclear condensation was converted into proportions to control the process and is shown in a histogram. (C,D) After the treatment of 200 μM chrysophanol, the mitochondrial membrane potential (ΔΨm) was measured by JC-1 solutions. (E) Western blot analysis was used to identify the expression level of proteins which affect cell apoptosis, such as Bax, Bcl-2, caspase-3, caspase-7, and PARP. β-actin was used to present a loading control. (F,G) The relative protein, cleaved PARP/PARP, and Bax/Bcl-2 density were measured; and the fold change was calculated. Data are expressed as mean ± SD (* p < 0.05, ** p < 0.01).
Figure 3. Chrysophanol induced apoptosis via caspase activations in CAL-27 and Ca9-22 cells. Both cells were incubated with chrysophanol (0, 100, and 150 μM) for 24 h. (A,B). The change in nuclear morphology was investigated by Hoechst agents. Then, nuclear condensation was converted into proportions to control the process and is shown in a histogram. (C,D) After the treatment of 200 μM chrysophanol, the mitochondrial membrane potential (ΔΨm) was measured by JC-1 solutions. (E) Western blot analysis was used to identify the expression level of proteins which affect cell apoptosis, such as Bax, Bcl-2, caspase-3, caspase-7, and PARP. β-actin was used to present a loading control. (F,G) The relative protein, cleaved PARP/PARP, and Bax/Bcl-2 density were measured; and the fold change was calculated. Data are expressed as mean ± SD (* p < 0.05, ** p < 0.01).
Figure 4. Chrysophanol-induced autophagy in CAL-27 and Ca9-22 cells. (A,B) The cells were treated with 100 μM chrysophanol. Then, acidic vesicular organelles’ (AVOs) formation was observed by AO staining, and MDC staining was used to detect the autophagic vacuole accumulation. (C,D) The expression levels of autophagy-related protein ATG5, beclin-1, LC3B-I/LC3B-II, and p62 were examined using a Western blot analysis, and the density of protein LC3B-II/LC3B-I ratios is shown in the graph. β-actin was used to present a loading control. (E–G) Autophagy-related mRNA expression levels, such as those of ATG5, beclin-1, p62/SQSTM1, and MAP1LC3B, were identified using a real-time PCR. GAPDH was used to present a loading control. Data are expressed as mean ± SD (* p < 0.05).
Figure 4. Chrysophanol-induced autophagy in CAL-27 and Ca9-22 cells. (A,B) The cells were treated with 100 μM chrysophanol. Then, acidic vesicular organelles’ (AVOs) formation was observed by AO staining, and MDC staining was used to detect the autophagic vacuole accumulation. (C,D) The expression levels of autophagy-related protein ATG5, beclin-1, LC3B-I/LC3B-II, and p62 were examined using a Western blot analysis, and the density of protein LC3B-II/LC3B-I ratios is shown in the graph. β-actin was used to present a loading control. (E–G) Autophagy-related mRNA expression levels, such as those of ATG5, beclin-1, p62/SQSTM1, and MAP1LC3B, were identified using a real-time PCR. GAPDH was used to present a loading control. Data are expressed as mean ± SD (* p < 0.05).
Figure 5. It was found that 3-MA inhibited autophagy and cooperated with apoptosis, which was occasioned by chrysophanol in CAL-27 and Ca9-22 cells. (A,B) Cell viability was executed by an MTT assay after chrysophanol treatments with or without 3-MAfor 24 h. (C,D) The protein expression levels of autophagy-associated proteins (ATG5, beclin-1, and LC3B) and apoptosis-associated proteins (Bax, Bcl-2, Caspase -3, and PARP) were detected by using a Western blot analysis. β-actin was used to present a loading control. (E–G) Bax/Bcl-2, cleaved caspase -3/caspase -3, and cleaved PARP/PARP ratios were calculated by using the Western blot band density. (H,I) Chrysophanol (0, 150 μM) was treated with both cells in the presence or absence 3-MA, and then the revelation of cytochrome c was visualized by immunofluorescence analyses. The results are exhibited as mean ± SD (* p < 0.05, ** p < 0.01, and *** p < 0.001).
Figure 5. It was found that 3-MA inhibited autophagy and cooperated with apoptosis, which was occasioned by chrysophanol in CAL-27 and Ca9-22 cells. (A,B) Cell viability was executed by an MTT assay after chrysophanol treatments with or without 3-MAfor 24 h. (C,D) The protein expression levels of autophagy-associated proteins (ATG5, beclin-1, and LC3B) and apoptosis-associated proteins (Bax, Bcl-2, Caspase -3, and PARP) were detected by using a Western blot analysis. β-actin was used to present a loading control. (E–G) Bax/Bcl-2, cleaved caspase -3/caspase -3, and cleaved PARP/PARP ratios were calculated by using the Western blot band density. (H,I) Chrysophanol (0, 150 μM) was treated with both cells in the presence or absence 3-MA, and then the revelation of cytochrome c was visualized by immunofluorescence analyses. The results are exhibited as mean ± SD (* p < 0.05, ** p < 0.01, and *** p < 0.001).
Figure 6. Chrysophanol enhanced the Akt/mTOR pathway in CAL-27 and Ca9-22 cells. (A,B) Chrysophanol was applied at 0 to 200 μM for 24 h in both OSCC cells. The expression of levels of Akt, p-Akt, mTOR, and p-mTOR were obtained using Western blot analysis and the p-Akt/Akt Western blot band density ratio is shown in the histogram. β-actin was used to present loading controls. Data are expressed as mean ± SD (* p < 0.05).
Figure 6. Chrysophanol enhanced the Akt/mTOR pathway in CAL-27 and Ca9-22 cells. (A,B) Chrysophanol was applied at 0 to 200 μM for 24 h in both OSCC cells. The expression of levels of Akt, p-Akt, mTOR, and p-mTOR were obtained using Western blot analysis and the p-Akt/Akt Western blot band density ratio is shown in the histogram. β-actin was used to present loading controls. Data are expressed as mean ± SD (* p < 0.05).
Figure 7. Inhibition of the PI3K/Akt/mTOR pathway promoted chrysophanol-induced apoptosis in CAL-27 and Ca9-22 cells. Both cells were pre-treated with 20 μM LY294002 for 2 h and then treated with chrysophanol for 24 h. (A,B) The expression levels of Akt, p-Akt, mTOR, and p-mTOR were detected using Western blot analyses, and the relative protein p-Akt/Akt ratio was calculated by a Western blot band. (C–G) The protein expression levels of autophagy-related proteins (beclin-1, p62, and LC3B) and apoptosis-related proteins (Bax, Bcl-2, caspase -3, and PARP) were evaluated by Western blot analyses, and then the ratios of apoptosis-regulated proteins are indicated in the histogram. (H,I) Making observations for JC-1, cells were treated with 150 μM chrysophanol in the presence or absence of LY294002. Data are expressed as mean ± SD (* p < 0.05, ** p < 0.01, *** p < 0.001).
Figure 7. Inhibition of the PI3K/Akt/mTOR pathway promoted chrysophanol-induced apoptosis in CAL-27 and Ca9-22 cells. Both cells were pre-treated with 20 μM LY294002 for 2 h and then treated with chrysophanol for 24 h. (A,B) The expression levels of Akt, p-Akt, mTOR, and p-mTOR were detected using Western blot analyses, and the relative protein p-Akt/Akt ratio was calculated by a Western blot band. (C–G) The protein expression levels of autophagy-related proteins (beclin-1, p62, and LC3B) and apoptosis-related proteins (Bax, Bcl-2, caspase -3, and PARP) were evaluated by Western blot analyses, and then the ratios of apoptosis-regulated proteins are indicated in the histogram. (H,I) Making observations for JC-1, cells were treated with 150 μM chrysophanol in the presence or absence of LY294002. Data are expressed as mean ± SD (* p < 0.05, ** p < 0.01, *** p < 0.001).
Figure 8. Graphical illustration of apoptotic and autophagic effects induced by chrysophanol in human OSCC, CAL-27 and Ca9-22 cells. Chrysophanol activates autophagy and in parallel inhibits apoptosis activity. 3-MA, an autophagy inhibitor, inhibits autophagy and cooperates with apoptosis, which is occasioned by chrysophanol. Inhibition of the PI3K/Akt/mTOR signaling pathway with the PI3K inhibitor LY294002 enhances chrysophanol-induced apoptosis and reduces autophagy. Therefore, chrysophanol-induced autophagy acts as a cell protection mechanism and interferes with the apoptosis pathway of OSCC cells.
Figure 8. Graphical illustration of apoptotic and autophagic effects induced by chrysophanol in human OSCC, CAL-27 and Ca9-22 cells. Chrysophanol activates autophagy and in parallel inhibits apoptosis activity. 3-MA, an autophagy inhibitor, inhibits autophagy and cooperates with apoptosis, which is occasioned by chrysophanol. Inhibition of the PI3K/Akt/mTOR signaling pathway with the PI3K inhibitor LY294002 enhances chrysophanol-induced apoptosis and reduces autophagy. Therefore, chrysophanol-induced autophagy acts as a cell protection mechanism and interferes with the apoptosis pathway of OSCC cells.
Table 1. Sequences of primers.
Table 1. Sequences of primers.
Target Gene Primer Sequence (5′ to 3′)ATG5ForwardGGGGTGACTGGACTTGTTGReverseCACTTCCCGCCCTCTGGTATCp62/SQSTM1ForwardAGCTCAGGAAGGTGCCATTReverseTTCTCAAGGCCCCATGTTGCACMAP1LC3BForwardAAGGCTTTCAGAGAGACCCTGReverseTTGCGCTTCCAACTCAGGCGAPDHForwardGACAGTCAGCCGCATCTTCTReverseGCGCCCAATACGACCAAATC
留言 (0)