
記住我
The development of NPs is generally caused by stimulation on the epithelial mucosa of nasal cavity by inflammatory substances that destroy the epithelium and subsequently produce subepithelial mesenchyme to generate a remodeling process, which results in the deformation and protrusions to form a spherical object that causes nasal congestion and the obstruction of the sinus opening [1].
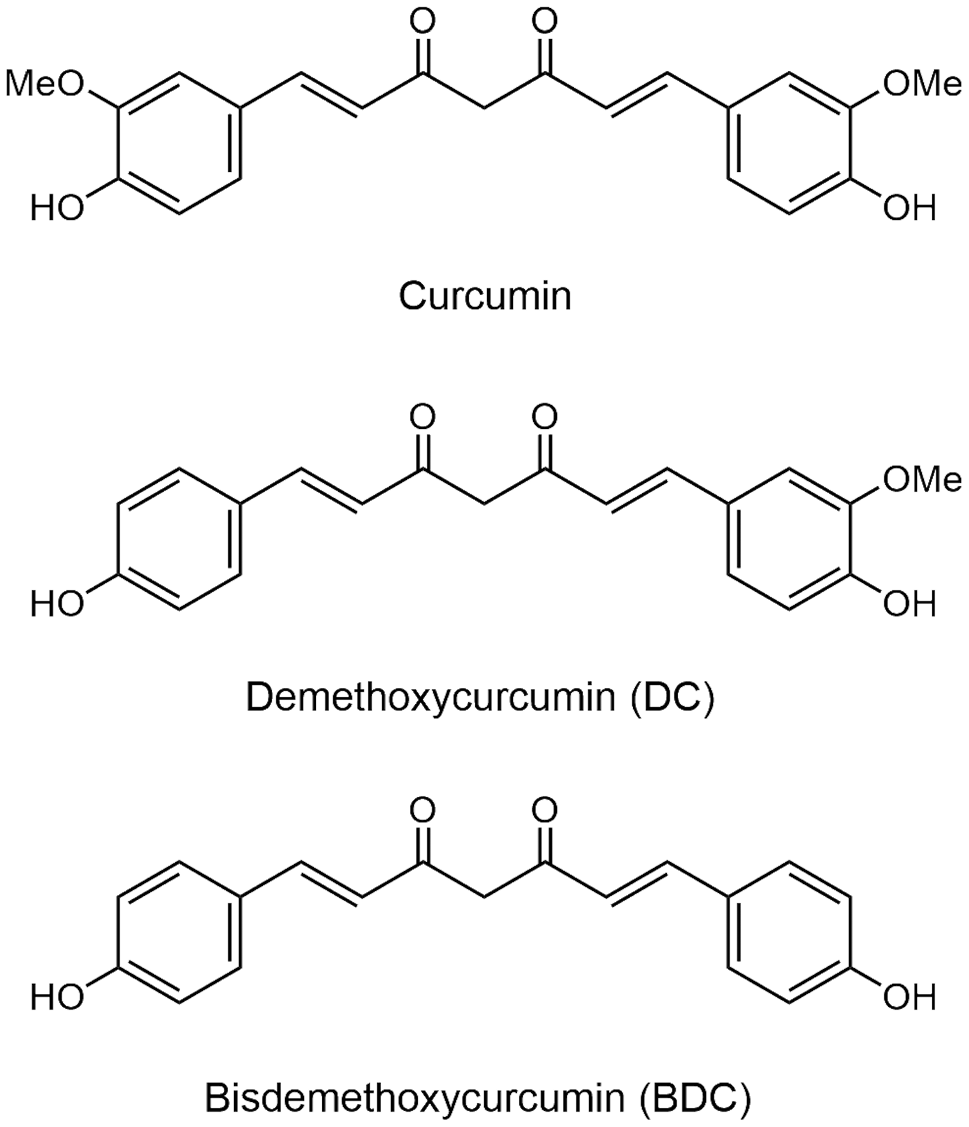
In cell-level studies, the generally used model for research includes isolated fibroblasts from NPs (NP-derived fibroblast, NPDF) [14, 15]. However, under transforming growth factor–β1 (TGF-β1) stimulation [16, 17], the downstream inflammatory pathways are activated, which include mitogen-activated protein kinase/extracellular signal-regulated kinases (MAPK/ERK), p38, and c-Jun N-terminal kinase (JNK), among others [14, 18, 19], producing α-smooth muscle actin (α-SMA) to convert fibroblasts into myofibroblasts [20]. Subsequently, the activated fibroblasts generate extracellular matrix (ECM), containing fibronectin (FBN) and type I collagen, among others, which could increase the mesenchyme of polyps [19]. Therefore, this study was based on the commonly used NP-experimental model for analysis.
We enrolled three patients with large NPs extending to the nasal cavities who received LNI treatment and endoscopic examination before and after treatment showed that the sizes of NPs had regressed significantly (Fig. 1C). Biopsies under endoscopy were performed for the NPs 2 weeks before and after the licorice treatment (Fig. 2).
Fig. 2
Research process. Patients with nasal polyps received biopsies before and two weeks after using nasal irrigation with licorice extract, and the fibroblasts in the polyps were isolated for culture (n = 3). The pathological differences of nasal polyps before and after treatment were evaluated by immunohistochemistry staining, and the molecular mechanism of the licorice extract on fibroblasts was investigated by in vitro experiments
H&E histologySpecimens of NPs before and after treatment with LE were stained with hematoxylin and eosin (H&E), and the numbers of eosinophils, lymphocytes, neutrophils and plasma cells were calculated and analyzed as follows: in each patient’s NP specimen, under 400× microscopic view, we selected three separate full-fields and estimated the numbers of above-mentioned four types of cells under H&E stain, respectively, and subsequently obtained a total of nine results from the three patients. The results obtained from the nine visual fields were averaged, and the differences in the numbers of eosinophils, lymphocytes, neutrophils and plasma cells before and after treatment were analyzed.
ImmunohistochemistryThe differences of TGF-β1 (BS1361; Bioworld Technology, Inc., MN, USA), α-SMA (Sigma-Aldrich Corp., St. Louis, MO, USA), vimentin (Cell Signaling), Masson’s trichrome (TASS01; Toson Technology Co., Ltd., Hsinchu, Taiwan), ERK (Cell Signaling), and phosphorylated ERK (p-ERK) (Santa Cruz Biotechnology, TX, USA) staining in those NP specimens before and after licorice treatment were analyzed by immunohistochemistry (IHC).
Furthermore, the method for analyzing TGF-β1, α-SMA, vimentin, Masson’s trichrome, ERK, and p-ERK included selecting three separate full-fields for each patient’s NP specimen under 400× microscopic view and the subsequent use of ImageJ software to filter the stained area. Next, we calculated the ratio of stained area relative to the entire field of view and averaged the nine data of these three patients. Lastly, the differences between the staining biomarkers before and after treatment were analyzed.
Nasal polyp-derived fibroblast (NPDF)Briefly, we collected the NPs from two patients with clinically significant responses to LNI (the cross-sectional area of the polyps in endoscopic images was reduced by 60–100% after treatment) (Fig. 2). After their NPs were separated, the fibroblasts were isolated and cultured to enable subsequent cell experiments. The NPs were obtained during sinonasal surgery and were subsequently processed into single-cell suspensions using a gentle MACS dissociator (Miltenyi Biotec GmbH, Bergisch Gladbach, Germany), which is a specialized machine for processing human nasal mucosa into single-cell suspensions. Furthermore, we sorted the nasal polyp-derived fibroblasts (NPDFs) from the single-cell suspensions. On the basis of the protocol of the EasySep Human-Positive Selection Kit II (STEMCELL Technologies Inc., Vancouver, Canada), the samples were placed into a magnet and then incubated for the sorting process. Next, we sorted and purified the NPDFs using flow cytometry (BD FACS Canto II, BD Biosciences, San Jose, CA, USA) with fluorochrome-conjugated antibody clones, including the anti-human fibroblast antibody (anti-vimentin antibody for human, Abcam, Cambridge, MA, USA) and pan-cytokeratin antibody (Santa Cruz Biotechnology), which was considered the control. After sorting, we further employed flow cytometry to confirm the isolated cells with anti-vimentin antibodies.
Licorice extractWe prepared the LE for research following our developed standardized protocol [13]. Briefly, 450 g of licorice slices (Glycyrrhiza glabra) was put into a 2-L high-pressure cooker, and 1.1 L of reverse osmosis pure water was added. The decoction time was 30 minutes, and the temperature was set to 120 °C. Next, the decoction liquid was carefully filtered to remove impurities, after which we removed water from the liquid using concentration and freeze–drying processes. Approximately 90 g of the dry extract could be obtained (extraction rate of ~ 20%). Finally, we used the dry extract for cell experiments. We used Glycyrrhiza glabra for all methods of this study in accordance with the relevant institutional and national, and international guidelines, regulations and legislation.
Real-time quantitative polymerase chain reaction (RT-PCR)Briefly, 1 × 10⁶ NPDF cells were seeded into a 10 cm dish and treated with phosphate-buffered saline (PBS) or different concentrations of TGF-β1 (20 ng/ml) and LE (200, 500, 1000 μg/mL) for 24 hours. The experimental groups included the following: 1. PBS as a control; 2. TGF-β1 alone; 3. LE alone; and 4. TGF-β1 and LE. On the basis of the manufacturer’s instructions, we applied the RNA isolation protocol to extract the RNA (NucleoSpin RNA Midi kit, MACHEREY-NAGEL GmbH & Co. KG, Duren, Germany). Subsequently, the first-strand cDNA fragments were synthesized using cDNA synthase (iScript™ cDNA Synthesis Kit, Bio-Rad Laboratories, Inc., Hercules, CA, USA) in a cDNA synthesizer (C1000 Thermal Cycler, Bio-Rad Laboratories). Next, the cDNA was transferred to the RT-PCR workstation (CFX96 Real-Time System, Bio-Rad) to synthesize the target DNA using various gene-specific primers, which include the following: α-SMA (sense sequence 5′–TGA AGT ACC CGA TAG AAC ATG–3′ and antisense sequence 5′–ATG CCA GTT GTG CGT CCA GAG–3′), FBN (sense sequence 5′–TGG TTG TAT CAG GAC TTA TGG–3′ and antisense sequence 5′–CCT GTG ATG GTG TAG CTT CTG–3′), collagen type I (sense sequence 5′–TGG TTG TAT CAG GAC TTA TGG–3′ and antisense sequence 5′–CCT GTG ATG GTG TAG CTT CTG–3′), and glyceraldehyde-3-phosphate dehydrogenase (GAPDH; sense sequence 5′–AGA ACA TCA TCC CTG CCT CT–3′ and antisense sequence 5′–TTA CTC CTT GGA GGC CAT GT–3′). Additionally, the values of the threshold cycle (Ct) were identified in the individual reactions using the CFX96 Real-Time System software. Finally, the Ct values of GAPDH were used as controls and normalization, and relative mRNA expressions were calculated using the 2−ΔΔCt method.
Western blottingBriefly, 6 × 10⁵ NPDF cells were seeded in a 6 cm dish and treated or untreated with TGF-β1 (20 ng/mL) for 1 hour. Subsequently, the cells were treated with PBS or different concentrations of LE (25, 100, 300, 1000 μg/mL) in a culture medium for 24 hours and lysed for immunoblotting. The experimental groups included the following: 1. PBS as a control; 2. TGF-β1 alone; 3. LE alone; and 4. TGF-β1 and LE. Next, proteins in the lysate were quantified. Then, aliquots of cellular protein were subjected to SDS-PAGE electrophoresis for western blotting and later transferred to polyvinylidene difluoride membranes (PVDF; Immobilon-P PVDF Membrane, Merck, Darmstadt, Germany). The membranes were probed with the primary antibodies for overnight incubation at 4 °C. The primary antibodies used included the following: α-SMA (Cell Signaling), FBN (Cell Signaling), ERK-1/2 (Cell Signaling), phosphorylated ERK-1/2 (p-ERK-1/2) (Cell Signaling), JNK (Cell Signaling), phosphorylated JNK (p-JNK) (Cell Signaling), p38 (Cell Signaling), phosphorylated p38 (p-p38) (Cell Signaling), and GAPDH (Proteintech, Rosemont, IL, USA). Next, a secondary antibody was added on the basis of the type of primary antibody, and subsequently, a chemiluminescent horseradish peroxidase (HRP) substrate (Themo Fisher or Merck) was added to generate luminescence. Finally, ImageJ software was used for quantification and analysis based on the protein bands and GAPDH as an internal control.
ImmunofluorescenceAdditionally, we used immunofluorescence (IF) staining and confocal laser microscopy to detect and analyze the expressions of α-SMA and ECM of the NPDFs stimulated by TGF-β1 (20 ng/ml) and treated with or without LE (500 μg/mL). Briefly, 1.5 × 10⁵ NPDFs were seeded in a six-well plate containing a coverslip per well. Subsequently, PBS or TGF-β1 (20 ng/mL) was added, and the cells were treated with PBS or 500 μg/mL LE for 24 hours. Next, the NPDFs were fixed with 4% paraformaldehyde and added to 0.2% Triton X-100 to increase permeability, followed by the addition of antibodies of α-SMA (Cell Signaling), FBN (Cell Signaling), ERK (Cell Signaling), and p-ERK-1/2 (Cell Signaling), and incubated overnight at 4 °C. Subsequently, rabbit fluorescent antibodies with exciting / absorbing wavelengths of 488 / 500–560 nm were added to these cells for incubation. Finally, the stained NPDFs were visualized and photo-captured using laser scanning confocal microscopy (TCS SP5 II; Leica, Wetzlar, Germany).
Cell migrationBecause fibroblast mobility is associated with polyp volume expansion, we used the transwell migration assay to assess the individual cell migration status of TGF-β1-stimulated NPDF in the presence or absence of LE. 24-well hanging inserts (Millicel Cell Culture Inserts; Merck) with 8 μm mini-holes were used and placed in a 24-well plate. Next, the Roswell Park Memorial Institute (RPMI)-free culture medium was added to the transwell high chamber, and 2 × 10⁴ NPDFs were seeded. The RPMI culture medium was then added to the transwell low chamber. The fibroblasts migrating to the low chamber were fixed with 4% paraformaldehyde after adding PBS or TGF-β1 (20 ng/mL) with PBS or LE (500 μg/mL) for 24 and 48 hours in the upper chamber. Finally, the insert was inverted after adding crystal violet dye (Sigma) to the cells. A light microscope was used to visualize and photo-capture the stained NPDFs from five selected viewpoints.
Statistical analysisDuring IHC, three results were measured for each patient, and a total of nine results were obtained for the three patients. Subsequently, paired Student’s t-tests were used for the statistical analysis before and after treatment. In the experimental part of RT-PCR, western blotting, IF, and migration assay, each result was performed at least three times and presented as a mean with standard deviation. Next, the differences between the two groups were evaluated using the unpaired Student’s t-test for statistical analysis. Statistically, a significant difference was considered at a p-value less than 0.05 and was marked with * on the graph, less than 0.01 as **, and less than 0.001 as ***. Additionally, another group was marked with #, ##, and ### to indicate when two kinds of groups were analyzed together.
留言 (0)