
記住我

Peripheral cytopenia is often encountered in clinical practice and may be associated with a serious disease and requires further evaluation.1–5 In particular, if cytopenia involves 2 or 3 cell lineage hematopoietic systems, it may be associated with hematological malignancy or bone marrow metastasis of the cancers and requires immediate diagnosis and treatment. Bone marrow failure syndromes, such as aplastic anemia (AA) and myelodysplastic syndromes (MDSs), are diseases clinically characterized by cytopenia of 1 or more blood cell lines (anemia, neutropenia, and/or thrombocytopenia). Although MDS and AA present similar peripheral blood findings, they are distinct diseases in etiology (neoplastic or autoimmune mechanisms), treatment (methylation inhibitors or immunosuppressive agents), and prognosis, which can sometimes be difficult to distinguish.6–8
Bone marrow aspiration and biopsy is performed to determine the cause of cytopenia, but due to its safety, the collection site is limited to the iliac bone and only reflects hematopoiesis of the iliac bone marrow. However, hematopoiesis at the iliac site is heterogeneous, and these approaches may not adequately reflect the entire hematopoietic status of the whole bone marrow. Evaluation of the bone marrow of the axial skeleton using MRI is one the useful approaches for diagnosis of AA,9 but no method has been established to evaluate the systemic hematopoiesis of the whole body.
The thymidine analog 3′-deoxy-3′-18F-fluorothymidine (18F-FLT) is a radiopharmaceutical for PET that has been shown to be useful for assessing cell proliferation.1018F-FLT is trapped after phosphorylation by thymidine kinase 1, whose expression is increased in replicating cells; therefore, 18F-FLT uptake can be used as a surrogate marker of DNA synthesis, reflecting cell proliferation. 18F-FLT PET enables the evaluation of whole-body bone marrow proliferative activity and has been used for the diagnosis and monitoring of bone marrow disorders.11–18 We previously reported that bone marrow 18F-FLT PET imaging is useful for the diagnosis and monitoring of bone marrow failure syndrome and the prediction of hematological toxicity after systemic chemotherapy.19,20
Based on these findings, we hypothesized that it would be useful to evaluate systemic hematopoiesis using 18F-FLT PET imaging in individuals with cytopenia. In this study, we investigated the feasibility of quantitative analysis of whole-body bone marrow activity using 18F-FLT PET for the differential diagnosis and the assessment of disease severity and prognosis in AA and MDS patients.
PATIENTS AND METHODS Patients and CharacteristicsSixty-nine patients with cytopenia from July 2016 to March 2021 were eligible for this prospective observational study. Cytopenia was defined according to the reference standards published by the World Health Organization, hemoglobin <12 g/dL for nonpregnant women and <13 g/dL for men, absolute neutrophil count <1800/μL, or platelet count <150,000/μL. Written informed consent was obtained from all individual participants. Figure 1 shows a flowchart that summarizes patient selection and evaluation. This study was approved by the local Medical Ethics Committee.
 FIGURE 1:
 Flowchart summarizes patient selection and evaluation.
Bone Marrow Aspiration and BiopsyBone marrow aspiration and biopsy were performed from the unilateral posterior iliac crest before 18F-FLT PET. Bone marrow aspiration was performed in all patients, and biopsy was performed in 51 patients (74%). Nucleated cell counts (NCCs, /μL) of the bone marrow aspiration specimens were determined by automated hematology analyses. The cell densities of the bone marrow biopsy specimens were determined as follows: hypocellular bone marrow was defined as <30% hematopoietic cells, normocellular bone marrow as 30% to 70%, and hypercellular bone marrow as more than 70%.
18F-FLT PET/MRI Protocol18F-FLT was prepared as previously reported.19,20 After at least 4 hours of fasting, patients received an IV injection of 200 MBq of 18F-FLT. Fifty minutes after the injection, the patients were transferred to the whole-body simultaneous 3.0 T PET/MR scanner (Signa PET/MR; GE Healthcare, Waukesha, WI). Anatomic coverage was from the vertex to midthigh. PET acquisition was performed in 3D mode at a 5.5 min/bed position (89 slices/bed) in 5 to 6 beds with a 24-slice overlap. A 2-point Dixon 3D volumetric interpolated T1-weighted fast spoiled gradient echo sequence (TR/TE1/TE2, 4.0/1.1/2.2 milliseconds; field of view, 50 × 37.5 cm; matrix, 256 × 128; slice thickness/overlap, 5.2/2.6 mm; 120 images/slab; imaging time, 18 seconds) was acquired at each table position and used to generate MR attenuation correction (MR-AC) maps. Additional MR sequences were acquired in the axial plane with the parameters shown in Supplementary Table 1 (Supplemental Digital Content, https://links.lww.com/CNM/A387). The PET data were reconstructed with ordered subset expectation maximization, selecting 14 subsets and 3 iterations, and postsmoothed with a 3-mm Gaussian filter. Reconstructed images were converted to semiquantitative images corrected by the injection dose and subject’s body weight (SUV).
Quantitative Image AnalysisPET and MR images were transferred to a GE workstation (Advantage Workstation 4.6) and evaluated with matched spatial registration. A total of 10 circular regions of interest (ROIs) with a fixed diameter of 15 mm were placed on thoracic vertebrae (Th3, 6, and 9), lumbar vertebrae (L3), bilateral iliac crests, caput femorises, and caput humeruses (Fig. 2). The mean 18F-FLT SUV (SUV) was measured for each ROI using PET/MRI fusion images. Iliac 18F-FLT SUV was defined as the average 18F-FLT SUVs of the right and left ilia. Vertebral 18F-FLT SUV was defined as the average of 18F-FLT SUVs of thoracic and lumbar vertebrae (Th3, 6, and 9 and L3). Whole-body 18F-FLT SUV was defined as the average of 18F-FLT SUVs of the 10 ROIs.
 FIGURE 2:
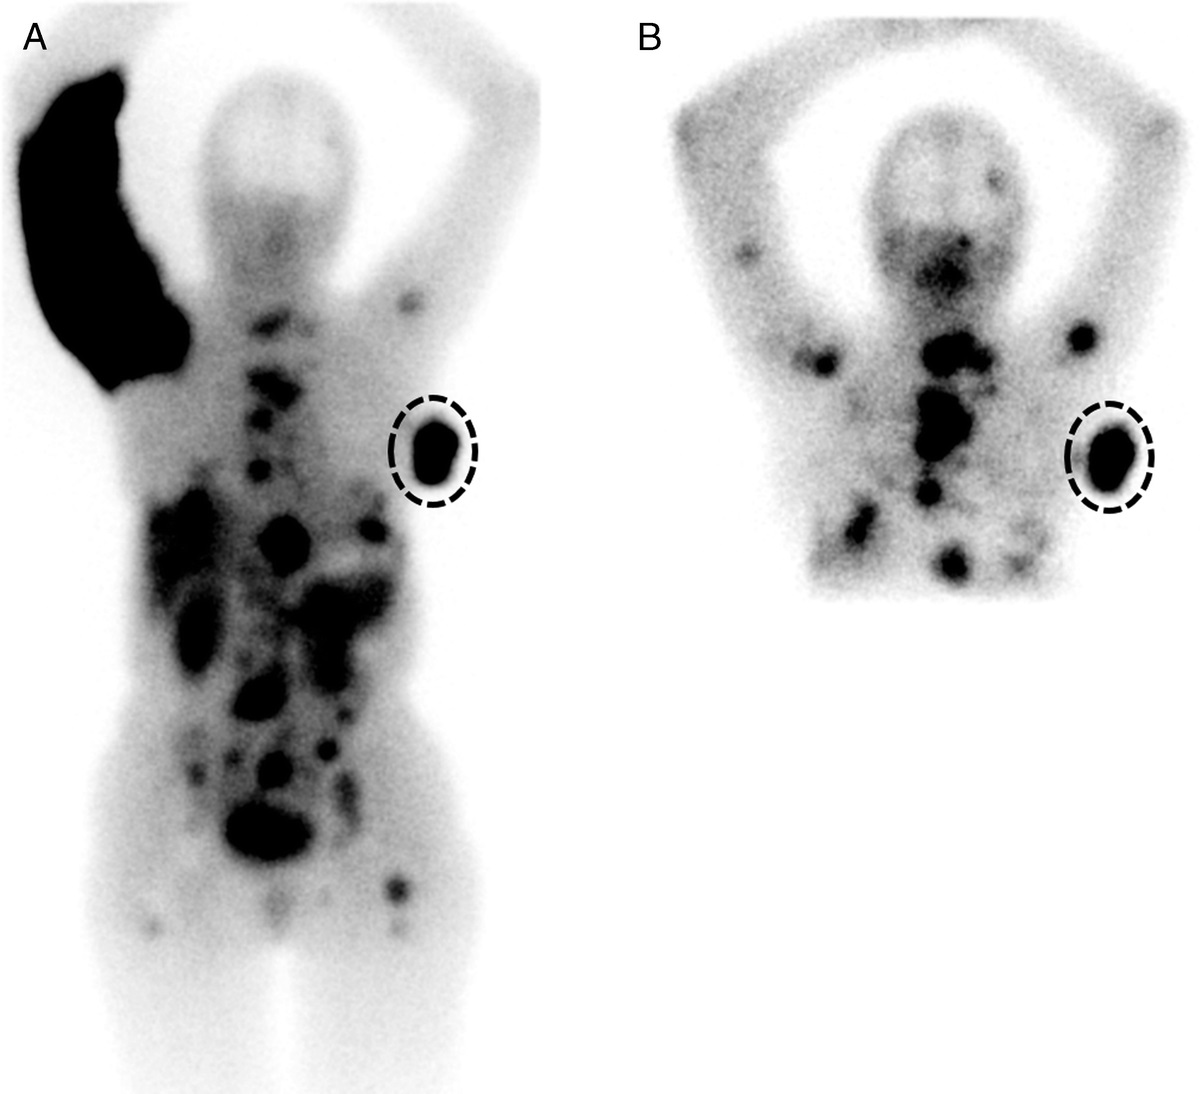
 A, Ten measurement sites for quantitative analysis on whole-body 18F-FLT PET. B, ROI placement on PET/MR fused images.
Statistical AnalysisRegression analyses between SUVs, bone marrow pathology, and characteristics were performed using Pearson and Spearman correlation coefficients for continuous and ordinal variables, respectively. In group comparisons, differences were assessed using one-way analysis of variance with a post hoc Bonferroni test. For comparing the slopes of regression lines, differences were assessed using a factorial analysis of covariance. Overall survival (OS) was evaluated using Kaplan-Meier survival curves and the log-rank test. All statistical analyses were performed using SPSS statistics version 22, and P < 0.05 was considered to be significant.
RESULTS Patients and CharacteristicsOf the 68 patients with cytopenia, 10 patients (14.7%) exhibited 1 lineage cytopenia (anemia: n = 9 and thrombocytopenia: n = 2), 24 patients (36.2%) had bicytopenia (neutropenia and anemia: n = 4, neutropenia and thrombocytopenia: n = 4, and anemia and thrombocytopenia: n = 16), and 33 patients (48.5%) had pancytopenia. The median values in the cytopenia patients were as follows: absolute neutrophil count 775/μL (54–1512/μL), hemoglobin 8.1 g/dL (5.2–13.3 g/dL), and platelet 37,000/μL (1300–146,000/μL). The final diagnosis was based on standard medical evaluation, including blood tests, laboratory findings, bone marrow aspiration/biopsy, and imaging findings, resulting in 12 patients with AA, 27 with MDS, 12 with bone marrow neoplasia (8 with acute leukemia, and 4 with bone marrow involvement of hematological malignancy), 2 with myelofibrosis, and 15 with cytopenia without hematological malignancy (Fig. 1, Table 1, Supplementary Table 2, Supplemental Digital Content, https://links.lww.com/CNM/A387).
TABLE 1 - Patients Characteristics Patients Characteristics N = 68 Age, median (value) 70.5 (18–91) Sex Male 40 (59%) Female 28 (41%) Cytopenia 1 10 (15%) 2 24 (35%) 3 33 (49%) Neutropenia 41 (60%) Anemia 62 (91%) Thrombocytopenia 55 (81%) Final diagnosis MDS 27 (40%) AA 12 (18%) Bone marrow neoplasia 12 (18%) Myelofibrosis 2 (3%) Other 15 (22%)Uptake of iliac 18F-FLT was evaluated by comparing the cellularity assessment by bone marrow aspiration/biopsy of the ilium. The iliac 18F-FLT SUV was significantly correlated with the NCC of the aspiration specimen (r = 0.47, P < 0.001) and the cell density of the biopsy specimen (ρ = 0.65, P < 0.001) (Figs. 3A, B, respectively). In group comparisons, iliac 18F-FLT SUVs in the normocellular and hypercellular groups were significantly higher than those in the hypocellular group (P < 0.001 and P < 0.001, respectively) (Fig. 3B).
 FIGURE 3:
 A, Correlation between NCC of the aspiration specimens and iliac 18F-FLT SUV. A regression line is shown with Pearson correlation coefficients (r) and the associated P value. B, Column scatter plots of cell density of the biopsy specimens and iliac 18F-FLT SUV. Significance for group comparisons is shown with associated P values. NS, not significant.
Differentiation Between AA and MDSIliac and vertebral 18F-FLT SUVs had significant positive correlations with each other in both AA and MDS (r = 0.65, P < 0.05 and r = 0.70, P < 0.001, respectively) (Fig. 4A). Overall, the SUVs were low in AA, and the iliac SUVs were significantly lower in AA (1.07 ± 0.27) than in MDS (5.19 ± 0.67, P < 0.001). Comparison of the slopes of the regression lines of the 18F-FLT SUVs of the iliac and vertebral showed a significantly steeper slope in AA than in MDS (P < 0.05).
 FIGURE 4:
 A, Correlation between iliac and vertebral 18F-FLT SUVs in AA and MDS. Regression lines are shown with Pearson correlation coefficients (r) and associated P values. B, Column scatter plots of vertebral 18F-FLT SUV for disease severity in AA. Significance for group comparisons is shown with associated P values. NS, not significant. C, Representative cases of AA. 18F-FLT uptake remained in the vertebrae in a mild case and decreased with disease progression.
Severity Assessment in AAThe utility of 18F-FLT PET was further investigated in AA. The vertebral 18F-FLT SUV was significantly lower in AA patients with stage 4/5 disease than in those with stage 1/2 and stage 3 disease (P < 0.01 and P < 0.05, respectively) (Fig. 4B). Representative images of AA are shown in Figure 4C. Vertebral 18F-FLT uptake remained in a mild AA patient and decreased with disease progression.
Prognosis Assessment in MDSTwenty-seven patients with MDS were clinically followed up for periods ranging from 3.5 to 51.3 months (median, 19.0 months), and MDS classification according to World Health Organization 2018 is shown in Supplementary Table 3, (Supplemental Digital Content, https://links.lww.com/CNM/A387). Of the 27 patients, 14 died during the study period. Kaplan-Meier curves of OS stratified by the median value for whole-body 18F-FLT SUVs are shown in Figure 5A. The median OS was significantly shorter for the patient group with a high whole-body 18F-FLT SUV (n = 14; range, 5.8–12.7) than for the group with a low whole-body 18F-FLT SUV (n = 13; range, 0.6–5.2) (19.0 vs 42.4 months; hazards ratio [HR], 3.18; 95% confidence interval [CI], 1.07–9.47; P < 0.05).
 FIGURE 5:
 Overall survival of MDS patients according to whole-body 18F-FLT SUV and clinical characteristics. Kaplan-Meier curves of OS stratified by the median value for whole-body 18F-FLT SUV (A), IPSS-R (B), the optimal cutoff values for WT1 mRNA level (C), and blast percentage (D).
Kaplan-Meier curves of OS stratified by the optimal cutoffs for the revised International Prognostic Scoring System (IPSS-R) 3.5,21 the expression of peripheral Wilms’ tumor 1 (WT1) mRNA (200 copies/μgRNA),22–24 and the proportion of blast cells in the bone marrow (5%) are shown in Figures 5B, C, and D, respectively. The median OS was significantly shorter in the patient group with high IPSS-R (n = 14; range, 3.5–49.9) than in the group with low IPSS-R (n = 13; range, 13.1–51.3) (15.7 months vs not reached; HR, 5.99; 95% CI, 1.55–12.6; P < 0.01) and in the patient group with high WT1 mRNA levels (n = 15; range, 3.5–49.9) than in the patient group with low WT1 mRNA levels (n = 11; range, 11.3–51.3) (19.7 months vs not reached; HR, 4.06; 95% CI, 1.05–8.87; P < 0.05). Although a high blast percentage showed shorter OS than a low blast percentage, the differences were not significant.
Assessment of Therapeutic ResponsePosttreatment 18F-FLT PET imaging was performed in 3 AA patients and 3 MDS patients to evaluate treatment responsiveness. AA patients successfully treated with immunosuppressive agents showed improved 18F-FLT uptake in the vertebrae and ilium (Fig. 6A). Conversely, whole-body 18F-FLT SUV was reduced in MDS patients who achieved hematological responses using hypomethylating agents compared with pretreatment (Fig. 6B).
 FIGURE 6:
 A, Representative cases of AA during treatment. Both cases underwent 18F-FLT PET scans before and 8–13 months after immunosuppressive therapy (IST). Vertebral 18F-FLT uptake recovered after IST. B, Representative cases of MDS during treatment. Both cases underwent 18F-FLT PET scans before and after receiving hypomethylating agents (HMAs). Whole-body 18F-FLT uptake decreased after the indicated cycles of HMA. Both cases achieved marrow complete remission (CR) according to the revised IWG 2018 hematological response criteria.
DISCUSSIONWe conducted a prospective observational study to investigate the usefulness of the quantitation of bone marrow activity using 18F-FLT PET in patients with peripheral cytopenia, including AA and MDS. 18F-FLT SUVs in the ilium, vertebra, and whole body were evaluated quantitatively. We confirmed that iliac 18F-FLT SUV is correlated with bone marrow cellularity of the ilium (Figs. 3A, B; NCC of the aspiration specimen and cell density of the biopsy specimen), indicating that bone marrow proliferative activity may be quantified by 18F-FLT PET. The differential diagnosis of cytopenia is generally assessed using peripheral blood smears and bone marrow specimens, but the appropriate site for bone marrow examination is limited and can only be performed on the ilium or sternum. However, discrepancies between 18F-FLT uptake and NCC were observed in some cases, such as high 18F-FLT SUV and low NCC (Fig. 3A), probably due to an inappropriate bone marrow puncture site.
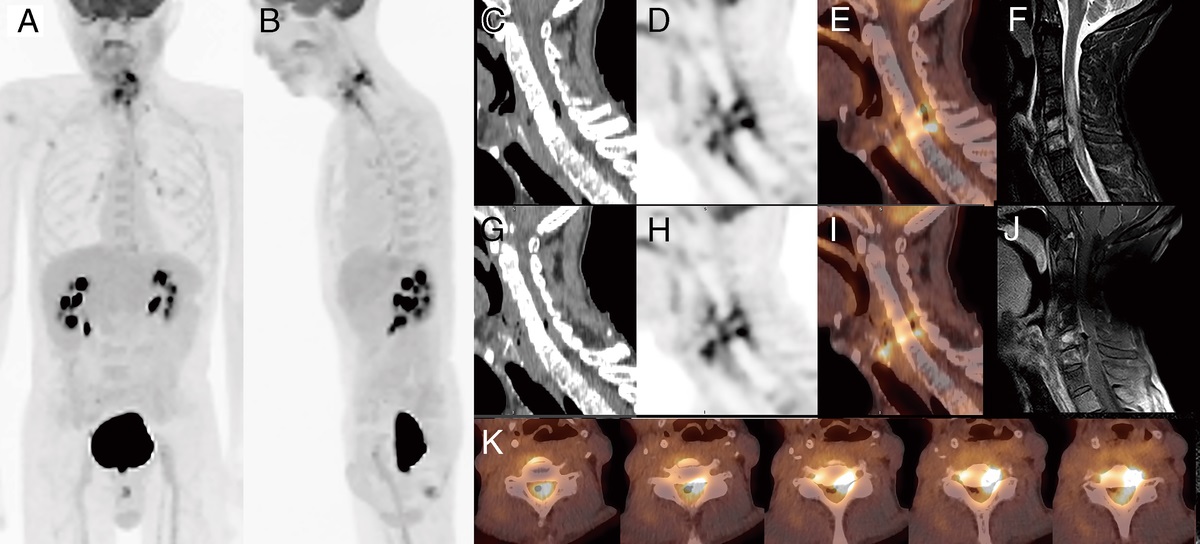
There have always been concerns about whether the local bone marrow findings reflect systemic hematopoiesis, and 18F-FLT PET allows the quantitative assessment of whole-body bone marrow activity noninvasively. Focusing on 18F-FLT uptake in the ilium, we found that iliac hematopoiesis was heterogeneous, with laterality and patchy hematopoiesis in some cases (Fig. 4C). Without this information, correct bone marrow aspiration for diagnosis might be difficult. 18F-FLT PET distinguishes cellular bone marrow from fatty bone marrow and visualizes its distributions and heterogeneity.19 Similarly in recent years, evaluation of hematopoietic function by 18F-FLT PET has suggested that it may be useful in assessing extramedullary hematopoiesis17 and in planning “marrow-sparing” radiation therapy.18 MRIs acquired simultaneously with our PET/MRI scanner detected fatty bone marrow in cases of low 18F-FLT uptake (Figs. 7A–C). This inverse correlation between fat fraction on MRI and 18F-FLT PET accumulation was also reported in the previous 18F-FDG study.25 Before performing bone marrow aspiration and/or biopsy, 18F-FLT PET might provide information about appropriate sites for examinations.
 FIGURE 7:
 Representative 18F-FLT PET and MR images of an AA case simultaneously acquired with PET/MRI. Bone marrow consists largely of fat components except for 18F-FLT foci. A, 18F-FLT PET. B, PET/MR fusion. C, Fat fraction images.
It was also suggested that 18F-FLT PET could be used for differential diagnosis of AA and MDS presenting with pancytopenia. The scatter plots of iliac and vertebral 18F-FLT SUVs showed regression lines with significantly different slopes between AA and MDS (Fig. 4A). Intense 18F-FLT uptake in the ilium and vertebrae was observed in MDS, and vertebral 18F-FLT uptake was relatively maintained even in hypoplastic MDS. On the other hand, in AA patients, vertebral 18F-FLT uptake decreased as the disease progressed with substantially low 18F-FLT uptake in the ilium. Vertebral 18F-FLT SUVs were correlated with clinical severity in AA (Fig. 4B). Although the degree of 18F-FLT uptake overlaps in some cases, the iliac accumulation may distinguish the 2 diseases. These results were similar to the previously reported changes in vertebral body hematopoiesis in AA and MDS using MRI,26 which was also observed in the present study on MRI (data not shown). In addition, AA patients successfully treated with immunosuppressive agents showed improved 18F-FLT uptake in the vertebrae and ilium (Fig. 6A). Therefore, the evaluation of vertebral and iliac hematopoiesis using 18F-FLT PET is very important in AA at the time of diagnosis and in observing the course of treatment.
In this prospective cohort study, whole-body 18F-FLT uptake, IPSS-R, and WT1 mRNA levels were significantly associated with prognosis in patients with MDS (Figs. 5A–C, respectively). For 18F-FLT PET, patients with higher whole-body 18F-FLT SUV had worse OS rates than those with lower whole-body 18F-FLT SUV. In particular, there were several cases in which 18F-FLT uptake was observed not only in the ilium and vertebra but also in the femorises and humeruses. Han et al recently reported that high 18F-FLT uptake in bone marrow after chemotherapy predicted early relapse in acute myeloid leukemia14 and that high 18F-FLT SUV might reflect neoplastic hematopoiesis. Unlike acute myeloid leukemia, bone marrow 18F-FLT uptake reflects the diversity of hematopoiesis and neoplastic proliferation in MDS, making it difficult to accurately distinguish immature hematopoiesis and neoplastic growth by 18F-FLT PET alone. Bone marrow proliferative activity assessed by 18F-FLT PET, when combined with clinical and genetic risk factors, may better predict outcomes for patients with MDS, including progression to acute myeloid leukemia.
There were several limitations in this study, one of which would be the effect of MR-AC on SUV values. Dixon images were used for MR-AC in the PET reconstruction, which does not include bone attenuation. In the present study, SUV values were compared for quantitative evaluation, but bone marrow values are usually slightly underestimated on PET/MRI even when time-of-flight acquisition is applied.27 Although under those conditions, the accumulation trend and distribution of 18F-FLT should be reliable since all patients were imaged with the same scanner and SUVs were compared only between the 2 patient groups. Other limitations were due to the small number of patients. The total numbers of AA (n = 12) and MDS (n = 27) patients were not sufficient to perform multivariate tests. A larger number of patients and multiregression analysis are needed to validate our findings in further prospective studies.
In conclusion, 18F-FLT PET can be used for the noninvasive quantitative assessment of whole-body bone marrow proliferative activity in patients with cytopenia. Quantitative 18F-FLT PET imaging helps distinguish AA from MDS and reflects the disease severity in AA and patient prognosis in MDS.
REFERENCES 1. Valent P. Low blood counts: immune mediated, idiopathic, or myelodysplasia. Hematology Am Soc Hematol Educ Program. 2012;2012:485–491. 2. Young NS, Abkowitz JL, Luzzatto L. New insights into the pathophysiology of acquired cytopenias. Hematology Am Soc Hematol Educ Program. 2000;2000:18–38. 3. Pascutti MF, Erkelens MN, Nolte MA. Impact of viral infections on hematopoiesis: from beneficial to detrimental effects on bone marrow output. Front Immunol. 2016;7:364. 4. Marks PW. Hematologic manifestations of liver disease. Semin Hematol. 2013;50:216–221. 5. Risitano AM, Maciejewski JP, Selleri C, et al. Function and malfunction of hematopoietic stem cells in primary bone marrow failure syndromes. Curr Stem Cell Res Ther. 2007;2:39–52. 6. Levy RN, Sawitsky A, Florman AL, et al. Fatal aplastic anemia after hepatitis. Report of five cases. N Engl J Med. 1965;273:1118–1123. 7. Zeldis JB, Dienstag JL, Gale RP. Aplastic anemia and non-a, non-B hepatitis. Am J Med. 1983;74:64–68. 8. Young NS, Calado RT, Scheinberg P. Current concepts in the pathophysiology and treatment of aplastic anemia. Blood. 2006;108:2509–2519. 9. De Mola RL, Kurre P. MRI findings in aplastic anemia. Am J Hematol. 2009;84:754. 10. Machulla HJ, Blocher A, Kuntzsch M, et al. Simplified labeling approach for synthesizing 3′-deoxy-3′-[18F]fluorothymidine ([18F]FLT). J Radioanal Nucl Chem. 2000;24:843–846. 11. Agool A, Schot BW, Jager PL, et al. 18F-FLT PET in hematologic disorders: a novel technique to analyze the bone marrow compartment. J Nucl Med. 2006;47:1592–1598. 12. Agool A, Slart RH, Kluin PM, et al. F-18 FLT PET: a noninvasive diagnostic tool for visualization of the bone marrow compartment in patients with aplastic anemia: a pilot study. Clin Nucl Med. 2011;36:286–289. 13. Vercellino L, Ouvrier MJ, Barré E, et al. Assessing bone marrow activity in patients with myelofibrosis: results of a pilot study of 18F-FLT PET. J Nucl Med. 2017;58:1603–1608. 14. Han EJ, Lee BH, Kim JA, et al. Early assessment of response to induction therapy in acute myeloid leukemia using 18F-FLT PET/CT. EJNMMI Res. 2017;7:75. 15. Williams KM, Holter-Chakrabarty J, Lindenberg L, et al. Imaging of subclinical haemopoiesis after stem-cell transplantation in patients with haematological malignancies: a prospective pilot study. Lancet Haematol. 2018;5:e44–e52. 16. Lin C, Kume K, Mori T, et al. Predictive value of early-stage uptake of 3′-deoxy-3′-18F-fluorothymidine in cancer cells treated with charged particle irradiation. J Nucl Med. 2015;56:945–950. 17. Campbell BA, Hofman MS, Prince HM. A novel application of [18F]Fluorothymidine-PET ([18F]FLT-PET) in clinical practice to quantify regional bone marrow function in a patient with treatment-induced cytopenias and to guide “marrow-sparing” radiotherapy. Clin Nucl Med. 2019;44:e624–e626. 18. Campbell BA, Jason C, Merrole CS, et al. 18F-Fluorothymidine PET for functional response assessment following radiation therapy for extramedullary hematopoiesis. Clin Nucl Med. 2021;46:e454–e457. 19. Tsujikawa T, Tasaki T, Hosono N, et al. 18F-FLT PET/MRI for bone marrow failure syndrome-initial experience. EJNMMI Res. 2019;9:16. 20. Umeda Y, Tsujikawa T, Anzai M, et al. The vertebral 3′-deoxy-3′-18F-fluorothymidine uptake predicts the hematological toxicity after systemic chemotherapy in patients with lung cancer. Eur Radiol. 2019;29:3908–3917. 21. Greenberg PL, Tuechler H, Schanz J, et al. Revised international prognostic scoring system for myelodysplastic syndromes. Blood. 2012;120:2454–2465. 22. Miyawaki S, Emi N, Mitani K, et al. Clinical course of the disease and the level of WT1 mRNA in 191 patients with acute myeloid leukemia (AML): joint research by 23 institutions in Japan. Rinsho Ketsueki. 2005;46:1279–1287. 23. Kitamura K, Nishiyama T, Ishiyama K, et al. Clinical usefulness of WT1 mRNA expression in bone marrow detected by a new WT1 mRNA assay kit for monitoring acute myeloid leukemia: a comparison with expression of WT1 mRNA in peripheral blood. Int J Hematol. 2016;103:53–62. 24. Kobayashi S, Ueda Y, Nannya Y, et al. Prognostic significance of Wilms tumor 1 mRNA expression levels in peripheral blood and bone marrow in patients with myelodysplastic syndromes. Cancer Biomark. 2016;17:21–32. 25. Tsujikawa T, Oikawa H, Tasaki T, et al. Integrated 18F-FDG PET/MRI demonstrates the iron-related bone-marrow physiology. Sci Rep. 2020;10:13878. 26. Kusumoto S, Jinnai I, Matsuda A, et al. Bone marrow patterns in patients with aplastic anaemia and myelodysplastic syndrome: observations with magnetic resonance imaging. Eur J Haematol. 1997;59:155–161. 27. Mehranian A, Zaidi H. Impact of time-of-flight PET on quantification errors in MR imaging-based attenuation correction. J Nucl Med. 2015;56:635–641.
留言 (0)