
記住我


Approximately 8% to 15% of the US adult population is affected by depression and anxiety, respectively [,], at least 1 in 4 is affected negatively by stress, and ≥60% report sleep disturbance such as trouble falling or staying asleep, insufficient sleep duration, or restlessness during the night []. Poor mental health (ie, depression, anxiety, or stress) and lack of sleep are linked to limitations in daily activities and increased health care use and thus pose a major burden to society [-]. Poor mental health and sleep disturbance are increasingly recognized as top contributors to reduced productivity and increased economic burden for employers (ie, via increased medical costs per employee and financial losses due to reduced work productivity) [-]. In the United States, depressive symptoms alone account for an estimated US $6 billion total in missed work costs (absenteeism) and nearly US $85 billion in productivity losses due to on-the-job impairment (presenteeism) [,]. Sleep-related productivity losses are estimated to cost more than US $1967 per employee each year [].
Benefits of Mindfulness and Gaps in the LiteratureMindfulness-based workplace interventions (eg, mindfulness meditation or mindfulness-based stress reduction programs) have been shown to improve mental health (ie, depression, anxiety, and stress) and sleep [-]. Two recent meta-analyses examined the effects of mindfulness-based interventions in the workplace on a number of employee mental health outcomes and sleep. Mindfulness interventions have demonstrated significant benefits in anxiety, stress, and sleep [,]. One of the meta-analyses reported marginal improvements in depressive symptoms as a result of mindfulness interventions but noted limitations such as the small number of studies available and data inadequacy []. The other reported on another key construct in emotional coping–resilience–which refers to one’s ability to bounce back or recover from stress [,] and which can serve as a buffer between stressful life events and the development of mental health problems including depression, anxiety, and chronic stress []. Meta-analytic results indicated significant effects of mindfulness interventions on resilience in the workplace, although the results were interpreted with caution because only 4 studies contributed to the analysis [].
Even fewer studies have examined the effects on key work productivity measures, such as absenteeism (productivity losses owing to missed time working as a result of mental or physical health concerns), presenteeism (productivity losses due to impairment while on the job as a result of mental or physical health concerns), overall impairment in work productivity (absenteeism and presenteeism combined), and overall impairment in nonwork activities [,,]; all of these constructs are particularly relevant to balancing the costs and benefits of these programs for employers. Some studies have found positive effects of mindfulness training on productivity [,], particularly for presenteeism, whereas others have found no significant impact [,]. One potential reason for these mixed results is the heterogeneity of measurement and the use of assessment measures that have not been extensively validated []. There is also a dearth of evidence for the ultimate cost-effectiveness of these programs in terms of health care expenditures for employers [,]. Thus, more work is needed in this area to understand the economic benefits of mindfulness-based interventions in the workplace, particularly with well-validated measures of overall productivity.
In addition, to date, most mindfulness-based interventions in the workplace have been delivered in-person, which limits scalability because of the costly need for a trained interventionist at each session [], as well as employee-level barriers such as the need for child care, transportation to a site, and limited scheduling options [,]. Digital mindfulness-based interventions in the workplace offer employers the ability to help employees manage their mental health, while mitigating many barriers associated with in-person interventions. Although few studies have evaluated mindfulness apps specifically in the workplace, preliminary evidence supports their effectiveness both for mental health and productivity outcomes. For example, 1 recent study found that employees randomized to receive a commercially available mindfulness meditation app in the workplace had significantly greater improvements in anxiety and depression versus those in a waitlist control condition, but no effects on sleep were evaluated []. The study also found positive effects on self-reported job strain but did not assess employee productivity []. Another limitation is that the study sample was restricted to a relatively healthy population due to the exclusion of employees with several common physical and mental health concerns (eg, depression, hypertension, and cardiovascular disease) []. It is unclear how the results would generalize to the broader population of working individuals with a range of health concerns. Another recent study examined the effects of a mindfulness app in the workplace compared with an app-plus-group intervention or waitlist control; however, this study did not evaluate mental health or sleep outcomes aside from post hoc participant perceptions []. In addition, there was only a marginal effect on measured overall productivity, and the study did not examine presenteeism and absenteeism separately []. To date, no studies have assessed the effects of a stand-alone mindfulness app concurrently on mental health outcomes, resilience, workplace productivity, and health care use, particularly with an inclusive sample that is more representative of the present-day workforce.
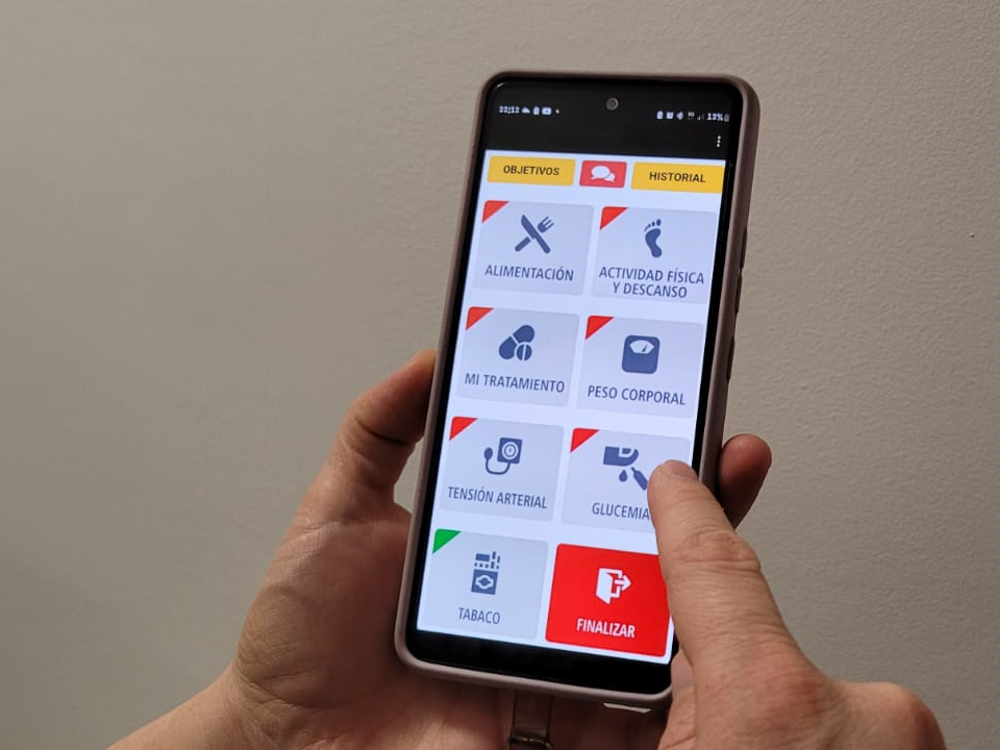
Study AimsThe purpose of this study was to evaluate the experimental effects of the Calm app, a mobile meditation app, on employee mental health (depression, anxiety, and stress), sleep, resilience, work productivity outcomes (absenteeism, presenteeism, overall work impairment, and overall activity impairment) and health care use (operationalized as the number of visits with a medical provider) in a workplace setting. We also explored the financial benefit of the Calm app in terms of productivity impairment cost savings (the amount of money saved per employee owing to the improvements in overall work productivity observed in the Calm intervention group vs waitlist control). This is the first study to evaluate the Calm app in a workplace setting (offered to employees for free and paid by the employer), specifically with a focus on employee mental health and productivity.
This study was approved by the institutional review board of Arizona State University (STUDY00014072) and registered with ClinicalTrials.gov (trial registration NCT05120310). All participants provided electronic informed consent before participating in the study.
Participants and RecruitmentParticipants were employees of a large consumer electronics retailer. Recruitment occurred nationally between August and December 2021 via email invitations from human resources, store leaders, and flyers posted in store breakrooms. Email materials and flyers included a QR code and website link that directed participants to a web-based eligibility survey (via the Qualtrics web-based survey platform). All recruitment materials referred to the intervention as the use of a health and wellness app. Invitations and flyers for recruitment were sent to 294 (estimated 20,000 employees), 288 (estimated 18,000 employees), and 511 work sites (estimated 36,000 employees) over the 6-month recruitment period.
Employees were eligible for the study if they were (1) were a current employee of the company, (2) were at least 18 years of age, (3) were able to read and understand English, (4) owned a smartphone, (5) were willing to download the Calm app, and (6) were meditation-naive and had not practiced meditation for ≥60 minutes per month for the past 6 months. We included only those that were meditation-naive because the literature suggests differences in the effects of mindfulness in those that have less meditation experience than those that have more (eg, recruiting different brain regions during meditation, which are differentially related to building attentional control and emotional regulation, versus maintaining existing networks []). Eligibility surveys took approximately 2 minutes to complete. At the end of the survey, ineligible employees were notified of their status, and eligible employees were automatically directed to a link containing the electronic informed consent and a video explaining the details of the study and the consent form. After consenting, participants were directed to complete the baseline questionnaires.
Depending on site randomization, employees were assigned to either the intervention group (ie, Calm app [10 minutes per day]) or the waitlist control group (ie, received access to the Calm app after 8 weeks). The primary and secondary outcomes of this study were sleep (ie, insomnia symptoms, daytime sleepiness, and sleep diaries), productivity (ie, absenteeism, presenteeism, work impairment, and activity impairment), resilience, and mental health (ie, depression, anxiety, and stress). Study outcomes were assessed at baseline (week 0), midintervention (weeks 2, 4, and 6), and after the intervention (week 8). A subsample of participants who self-reported elevated sleep disturbance was also invited to receive 6 weeks of sleep coaching during their study participation. Coaching participants completed daily sleep diaries to measure sleep or wake time and sleep quality (secondary outcomes). The sleep coaching outcomes are beyond the scope of this manuscript and will be reported elsewhere.
Randomization and BlindingRandomization occurred at the work site to avoid treatment contamination between employees at the same work site. Before recruitment, all sites in the company (N=1096 sites) were randomized using stratification by total number of employees (ie, 33rd and 67th percentiles; small ≤53 employees, medium=54-73 employees, and large ≥74 employees). Store locations were randomized using allocation sequences generated before the start of the study []. Allocation sequences were concealed from the research personnel involved in allocation until the time of group assignment. Participants were informed of their group assignment following completion of the baseline questionnaires.
Intervention and Control GroupsCalm Intervention GroupParticipants assigned to the intervention group were instructed to download the consumer-based mobile meditation app, Calm, and were asked to use it autonomously for at least 10 minutes per day during the 8-week intervention period. Meditation in the Calm app uses mindfulness components [], breathing techniques, and body scans, all of which are consistent with core mindfulness practices, including mindfulness-based stress reduction (nonjudgmental moment-to-moment awareness []), and vipassana (objective observation of physical sensation in the body []). The frequency, dose, and timing of engagement with the Calm app, as well as its content and use of features, is entirely self-selected by the user. The Calm app is offered internationally in 7 different languages. The Calm app may be accessed by purchasing the app via a subscription-based service or offered by an employer as a benefit; some content is freely available upon download. In addition to using the Calm app, participants had the option to schedule one synchronous 20-minute web-based coaching session with a Calm app coach in the first week to orient them to the Calm app. Participants received weekly SMS text message reminders to use the Calm app on Sundays at noon during the intervention. For the final survey, participants were able enter a raffle to win 1 of 5 boxes of Calm swag (pencils, notepads, book, etc), which were provided by the Calm app.
A sample of participants with elevated baseline scores on the Insomnia Severity Index (ISI; see the Measures section; determined as a score of >10 at baseline assessment) were invited to attend 5 weekly sessions over 6 weeks with a certified sleep coach to help them improve their sleep. Sessions were structured around basic sleep hygiene principles (eg, establishing a regular pattern of sleep, engaging in sleep hygiene practices, sleep restriction (as appropriate for insomnia symptoms), practicing bedtime mindfulness, and improving the sleep environment). The intent was to randomize individuals with elevated ISI scores to either sleep coaching or Calm app only. However, due to low enrollment, we quickly transitioned to offering sleep coaching to all participants with an elevated ISI. Those who opted into sleep coaching were asked to complete a 2-week sleep diary at the beginning and end of the 6-week period.
Waitlist Control GroupParticipants randomized to the waitlist control group were instructed via email to continue with their usual routines during the 8-week assessment period. After week 8, they received access to the Calm app for an additional 8 weeks. Waitlisted participants with elevated baseline ISI scores were invited to participate in sleep coaching after completing their waitlist period. To ensure consistency in measurement, they also completed a sleep diary during the waitlist period.
MeasuresAll participants in both groups were asked to complete electronic self-report assessments of outcomes every 2 weeks from baseline until the completion of the 8-week study period. The constructs measured and the psychometric properties of the assessments used are described.
DemographicsDemographics and individual characteristics (16 items assessing personal characteristics, such as race, ethnicity, work, and medical status) were collected at baseline.
Mental HealthMental health was measured using the Depression Anxiety Stress Scale (DASS; DASS-21), a 21-item scale assessing symptoms of depression, anxiety, and stress over the past week []. The DASS-21 is the short form of the original 42-item measure by Lovibond and Lovibond []. It has demonstrated construct validity and maintains the tripartite factor structure of the original DASS-42, effectively distinguishing among the latent constructs of depression, anxiety, and stress via items measuring low positive affect, physiological hyperarousal, and perceived stress []. In general population samples, the DASS-21 has shown adequate internal consistency (Cronbach α of .88, .82, and .90 for the depression, anxiety, and stress subscales, respectively) and good convergent and discriminant validity compared with other measures of depression and anxiety [,].
SleepInsomnia symptoms were assessed among all participants via the ISI, a 7-item self-report questionnaire assessing insomnia symptoms (eg, difficulty falling and staying asleep) during the past 2 weeks and the distress and impairment associated with the symptoms []. Items are rated on a 5-point Likert-type scale; total scale scores are obtained by summing the item ratings. The ISI has demonstrated good internal consistency (Cronbach α=.74 in the validation sample), sensitivity to change, and convergence with both objectively measured sleep disturbance and clinician ratings []. Daytime sleepiness symptoms were measured using the Epworth Sleepiness Scale, which includes 8 items assessing recent dozing behavior during routine daytime activities (sitting and reading, in conversation, etc) []. Items are rated on a 4-point Likert scale from 0 (would never doze) to 3 (high chance of dozing). The total scores were obtained by summing the item ratings (range 0-24, with higher scores indicating greater sleepiness). The Epworth Sleepiness Scale has shown high internal consistency (Cronbach α=.7 to .9 in varying populations), demonstrates convergent validity with objective measures of sleepiness and sleep disturbance (ie, sleep latency), and differentiates between clinical and nonclinical sleep populations [,].
ResilienceResilience was measured using the Brief Resilience Scale (BRS), which measures an individual’s ability to bounce back and recover from stress []. Respondents are asked to rate the extent to which 6 statements related to resilience apply to them, on a 5-point Likert-type scale (ie, from strongly disagree to strongly agree). The BRS has been validated in college students as well as clinical samples (eg, individuals with chronic medical concerns) with good to excellent internal consistency (Cronbach α ranging from .80 to .91 for the overall scale) [].
Work Productivity and ImpairmentThe Work Productivity and Activity Impairment (WPAI) Questionnaire–General Health measure (WPAI general health) is a 6-item scale that measures general physical and mental health–related impairments in work and nonwork activities as well as absenteeism and presenteeism []. Respondents were asked about current employment, hours missed due to health problems and other reasons, hours worked, and the degree to which health affected productivity during work and in other nonwork activities in the past 7 days. The 4 outcomes generated from the scale are percent work time missed due to health (absenteeism), percent impairment while working due to health (presenteeism), percent overall work impairment due to health (productivity impairment), and percent nonwork activity impairment due to health (nonwork activity impairment).
Medical Care VisitsAt weeks 4 and 8, participants were asked to self-report the number of times they had seen a medical provider in the past 4 weeks.
Productivity Cost SavingsThe average amount of money saved per employee (US $) due to the improvements in overall work productivity observed in the Calm intervention group versus waitlist control was computed using the human capital approach (HCA) [,], which is one of the most widely used methods for estimating the monetary value associated with productivity losses due to a specific cause (eg, mental and physical health problems) []. This approach assumes that 1 hour of differential productivity (ie, productivity gained via the Calm app) is equivalent in value to an individual’s wages for that same time. In this case, because the WPAI assesses work productivity and impairment over the past 7 days, the HCA produces a weekly estimate of productivity costs associated with employee impairment. Work impairment and associated productivity costs for the present analysis were derived according to employee wage type—hourly versus salaried. First, the total monetary value of an individual’s potential productive hours was computed. For hourly workers, the weekly wage was calculated as an employee’s hourly wage multiplied by the number of hours per week they worked, and for salaried employees, weekly wages were calculated as an employee’s annual salary divided by 52 weeks in a year (given that weekly wages among salaried employees do not depend on the number of hours worked each week). Consistent with HCA, employees’ weekly overall work impairment percentages, as indicated by the WPAI overall work impairment metric (ie, percentage of time, relative to the hours worked per week, that an employee is absent or reporting impaired productivity due to mental or physical health problems), were multiplied by their weekly wages to obtain an overall cost of absenteeism and impaired productivity for each individual. These weekly productivity cost values associated with work impairment were then included as the outcome variable in analyses via mixed effects modeling (see the Data Analyses section).
App UseApp use data were provided by the Calm app. Use over time was measured as the average number of sessions and minutes per week of use per employee. Use assessments included measures of overall app use (any component) and the use of specific app components (eg, meditation, music, and sleep stories).
Data AnalysesPower analyses were conducted using G*Power 3.0. Consistent with prior research that has tested similar interventions and measured changes in mental health, resilience, and sleep [-], we assumed small to moderate effect sizes for improvements (conservative estimate of Cohen d=0.12), thus estimating a total needed sample size of 364. Anticipating approximately 30% attrition, we aimed to enroll a minimum of 500 participants.
All analyses were performed using SPSS (version 27.0; IBM Corp). Baseline comparisons were made between the Calm intervention and waitlist control groups using independent samples 2-tailed t tests and Pearson chi-square analyses, as appropriate. As many baseline variables included numerous categories with potentially small cell sizes for chi-square analyses, omnibus baseline group comparisons were conducted with binary indicator variables collapsed across categories (White race vs non-White, presence vs absence of chronic sleep condition, etc). Similar comparisons were made for complete cases (ie, those with data available at all 5 time points from baseline to week 8) versus incomplete cases.
Inferential analyses were conducted using both complete-case (CC; analysis with data from participants completing all assessments) and intent-to-treat (ITT) approaches []. ITT analyses were conducted using the mixed models applied to all available data [,]. Mixed models were used to analyze group differences in outcomes over time. Mixed models are advantageous because they are well suited for longitudinal data with varying levels of missingness across participants. The models were estimated using maximum likelihood estimation procedures and assuming an autoregressive correlation structure. To allow for the evaluation of nonlinear change, time was treated as a factor, in which time points were individually dummy coded and compared with baseline. All models included dummy-coded indicators of gender; race; ethnicity; education; employee wage type (ie, hourly vs salaried worker); frontline-worker status (ie, working in retail stores or home services); and the presence of mental, physical, and sleep diagnoses as covariates. In addition, to account for potential effects of sleep coaching (ie, for the Calm intervention group, participants with elevated sleep disturbance who opted for sleep coaching) and completion of sleep diaries (ie, for the waitlist participants invited to sleep coaching after completing the waitlist period), we included 2 dummy-coded indicator variables reflecting enrollment in the sleep coaching program and participation in the program (ie, attended at least one coaching session). Of the 101 participants in the Calm intervention group who indicated interest in enrolling in the CCS program, 55 (54%) completed at least one coaching session. Among those who completed at least one coaching session, the median number of sessions attended was 4 (mean 4.1, SD 1.4). All models allowed for random effects of the person and the work site.
To estimate the effect size of the predictors, we calculated Cohen d by dividing the unstandardized regression coefficient by the SD of the outcome variable [,]. On the basis of recommendations in the study by Cohen [], absolute d values near 0.30 and below were considered to reflect small effects, at or around 0.50 to reflect medium or moderate effects, and values near 0.80 or above were considered to reflect large effects.
Among participants assigned to the Calm group, descriptive statistics were generated to illustrate app use over time (ie, minutes per week using the Calm app and minutes per week using specific app components).
Of the 1844 individuals screened for eligibility, 1689 (91.59%) were determined to be eligible and consented to participate. In total, 56.9% (585/1029) of participants were at sites randomized to the Calm intervention group, and 43.14% (444/1029) of participants were at sites randomized to the waitlist control. One participant did not provide sufficient data at any time point (including baseline) to be included in the analyses. Of participants who were randomized, 17.3% (101/444) in the Calm intervention group and 19.6% (87/444) in the control group opted for sleep coaching and sleep diaries. In total, 15% (88/585) of participants had CC data in the Calm intervention group (ie, had data available at all 5 time points), and 23.4% (104/444) of control participants had CC data. Participant flow through the full study is depicted in .
Demographic and clinical characteristics of the participants in each group are described in and , along with group comparisons. The full sample was relatively evenly split between men (474/1024, 46.28%) and women (518/1024, 50.58%), and 3.12% (32/1024) of the participants identified with another gender. Most participants (803/1028, 78.11%) identified their race as White, and 15.46% (159/1028) identified with Hispanic or Latinx ethnicity. The groups did not differ at baseline in terms of sex, race, ethnicity, college education (yes or no), presence of a diagnosed sleep condition, or hourly versus salaried wage type (all P=.11). The waitlist group had a significantly higher proportion of individuals self-reporting a diagnosed mental health condition (χ21=5.5; P=.02), and this variable was included as a covariate in the analyses (as planned) to control for this.
There were no significant baseline differences between groups on measures of depression, stress, insomnia, sleepiness, resilience, absenteeism, presenteeism, or work productivity impairment (). At baseline, waitlist participants had significantly higher anxiety (P=.04) and nonwork activity impairment (P=.046), and more frequent medical visits in the 4 weeks before study participation (P=.03). However, our modeling approach accounted for these baseline group differences using baseline scores as the reference for each subsequent time point evaluated. See for the group means across all time points.
With regard to comparisons of cases with complete data (ie, participants who provided survey data at all 5 study time points) and incomplete cases (ie, participants who completed surveys at fewer than 5 time points), complete cases were more likely to be people of color (χ21=6.2; P=.01), more likely to be non-Hispanic (χ21=4.6; P=.03), and less likely to have completed college education (χ21=7.5; P=.01). Hourly workers were less likely than salaried workers to complete surveys at all 5 time points (χ21=19.3; P<.001); however, among salaried employees, complete cases and incomplete cases did not differ with regard to salary (t397=0.13; P=.89), and among hourly workers, complete and incomplete cases did not significantly differ with regard to hourly wage (t624=1.26; P=.21).
 Figure 1. CONSORT (Consolidated Standards of Reporting Trials) diagram of study participation and analyzed data. *Note that participants may have been ineligible for more than one reason, all of which are reflected here. During the trial, participants could complete a subsequent assessment even if they missed a prior one. View this figureTable 1.
Demographic and employment characteristics of the samplea (N=1029).CharacteristicWaitlist, n (%)Calm, n (%)Chi-square (df)P valueGender0.1 (1).75
Figure 1. CONSORT (Consolidated Standards of Reporting Trials) diagram of study participation and analyzed data. *Note that participants may have been ineligible for more than one reason, all of which are reflected here. During the trial, participants could complete a subsequent assessment even if they missed a prior one. View this figureTable 1.
Demographic and employment characteristics of the samplea (N=1029).CharacteristicWaitlist, n (%)Calm, n (%)Chi-square (df)P valueGender0.1 (1).75aConsistent with the operational definitions of demographic covariates in models of outcomes over time, chi-square tests reflect group comparisons of proportions of men and women, White and racial minority, Hispanic and non-Hispanic, completed and not completed college education, salaried and hourly employment status, and all work setting types.
Table 2. Health characteristics of the samplea (N=1029).CharacteristicWaitlist, n (%)Calm, n (%)Chi-square (df)P valueOverall physical health7.7 (4).10aConsistent with operational definitions of health-related covariates in models of outcomes over time, chi-square tests reflect group comparisons of the proportions of the presence or absence of a chronic health condition and the presence or absence of a sleep-related condition.
bPTSD: posttraumatic stress disorder.
Table 3. Group differences in outcomes at baseline.MeasureWaitlistCalmt test (df)P valueaISI: Insomnia Severity Index.
bESS: Epworth Sleepiness Scale.
cDASS-21: Depression Stress Anxiety Scale 21-item.
dBRS: Brief Resilience Scale.
eWPAI: Work Productivity and Activity Impairment questionnaire. Medical visits were self-reported by employees indicating the number of times they visited a health care provider in the past 4 weeks. Cost due to impaired productivity was calculated based on self-reported pay and WPAI overall work impairment percentages; this metric is reported in US $.
Calm App Effects on Mental Health, Productivity, and Related OutcomesMental HealthIn the CC analyses, participants at sites randomized to the Calm intervention group had significantly larger reductions in depression at week 8 than did participants at sites randomized to the waitlist control group (; ). In ITT analyses (ie, using all available data, inclusive of complete and incomplete cases [,]), participants in the Calm intervention group had significantly larger reductions in depression than participants in the waitlist control group at week 6 (Figure S1 in ). Among complete cases, Calm intervention group participants had significantly larger reductions in anxiety than the control group participants at weeks 4, 6, and 8; in ITT analyses, the effects of week 8 effects were retained. Similarly, complete cases in the Calm intervention group reported significantly larger reductions in stress at weeks 6 and 8 than did CC participants in the waitlist control group, whereas in the ITT analyses, employees using the Calm app had significantly greater reductions in stress at week 6 than those in the waitlist control group. Across all analyses, the effect sizes for changes in mental health indicated small to medium effects.
 Figure 2. Estimated marginal means indicating group differences in changes in mental health outcomes over time among study completers. *P<.05; **P<.01; ***P<.001. DASS-21: Depression Anxiety Stress Scale-21 item. View this figureTable 4.
Estimates of group differences in changes in mental health over timea.ParameterComplete casesAll available (ITTb)
Figure 2. Estimated marginal means indicating group differences in changes in mental health outcomes over time among study completers. *P<.05; **P<.01; ***P<.001. DASS-21: Depression Anxiety Stress Scale-21 item. View this figureTable 4.
Estimates of group differences in changes in mental health over timea.ParameterComplete casesAll available (ITTb)
留言 (0)